Student Population by Gender
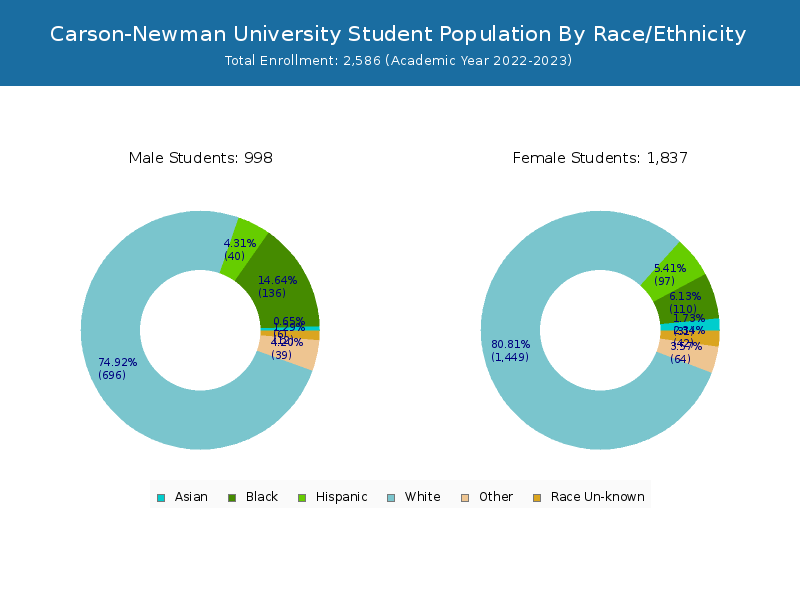
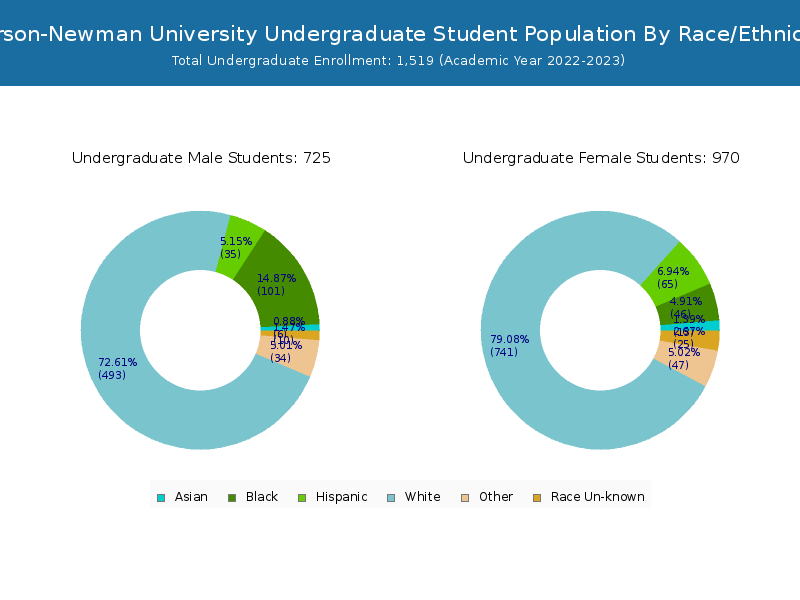
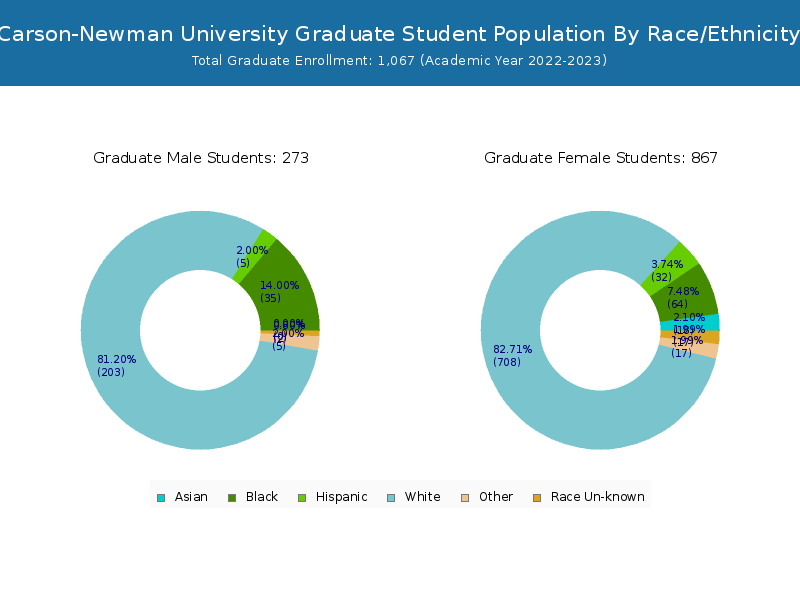
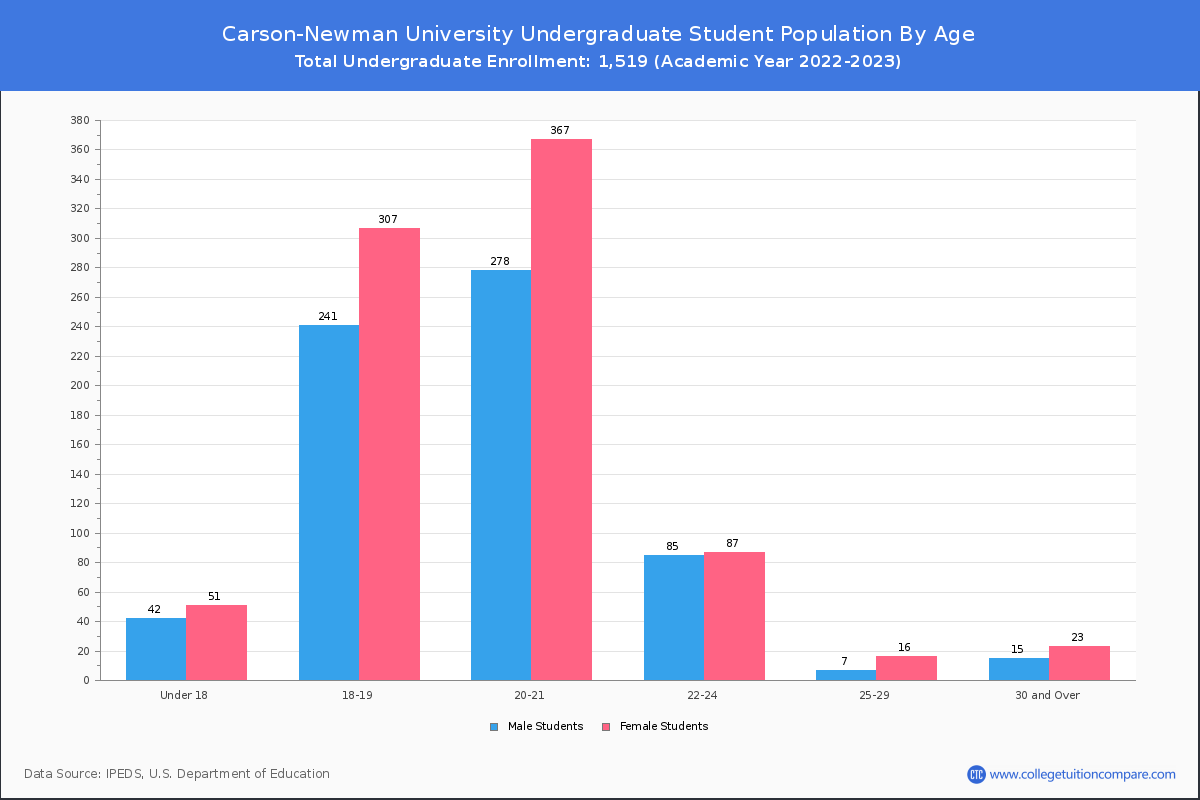
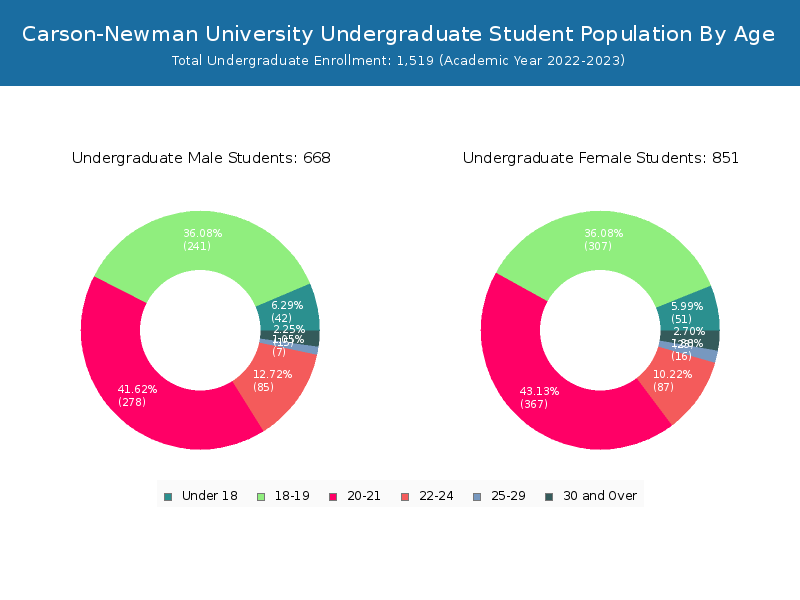
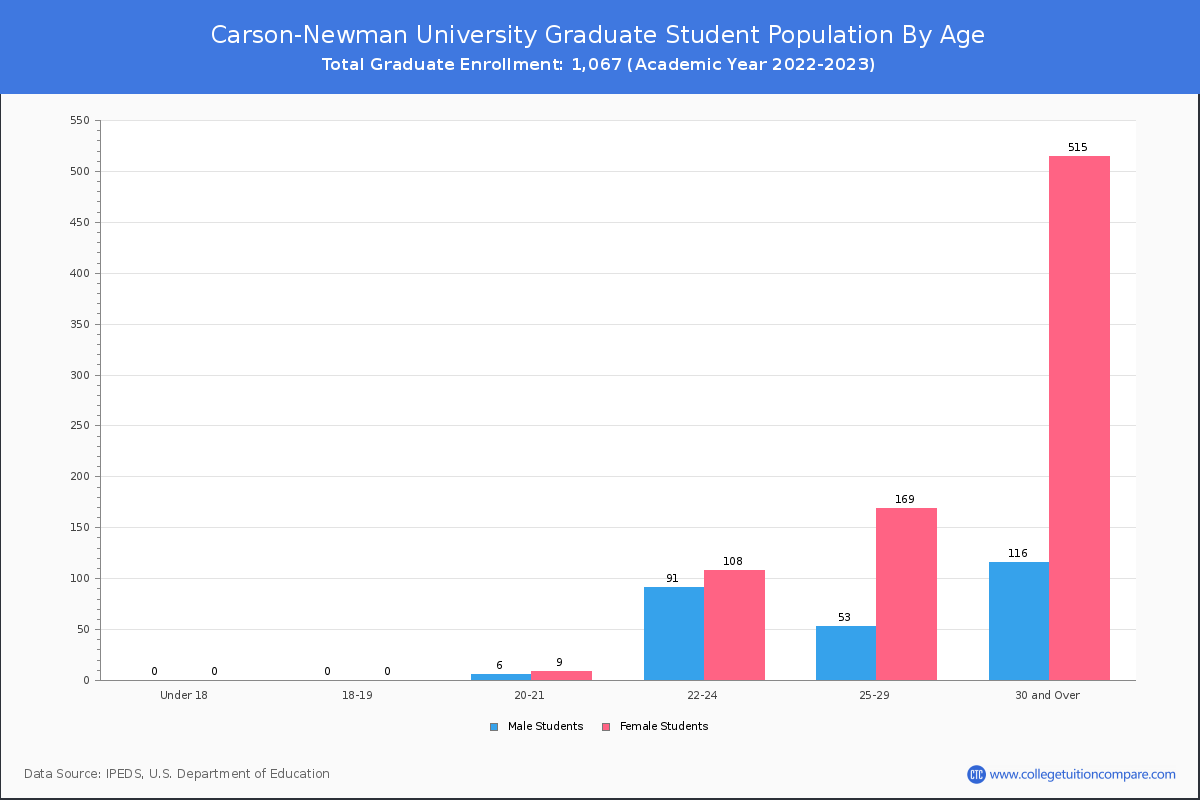
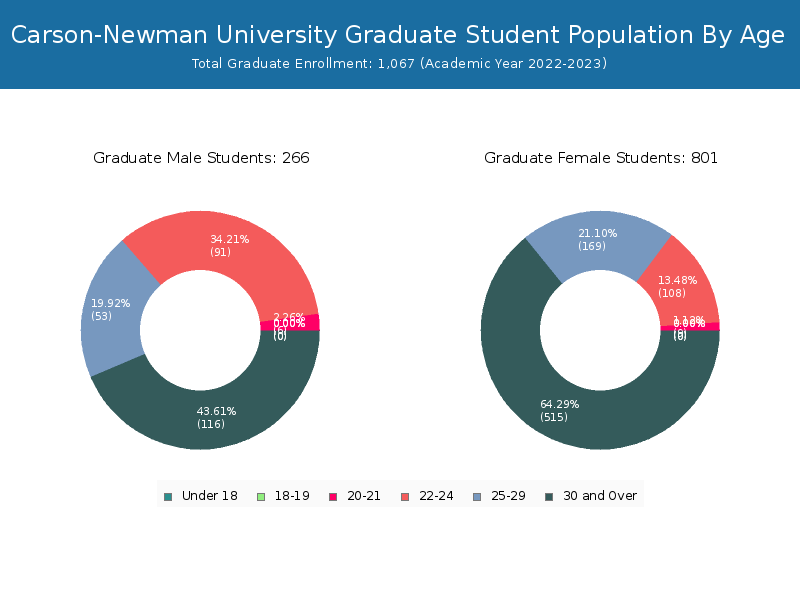
Carson-Newman University has a total of 2,586 enrolled students for the academic year 2022-2023. 1,519 students have enrolled in undergraduate programs and 1,067 students joined graduate programs.
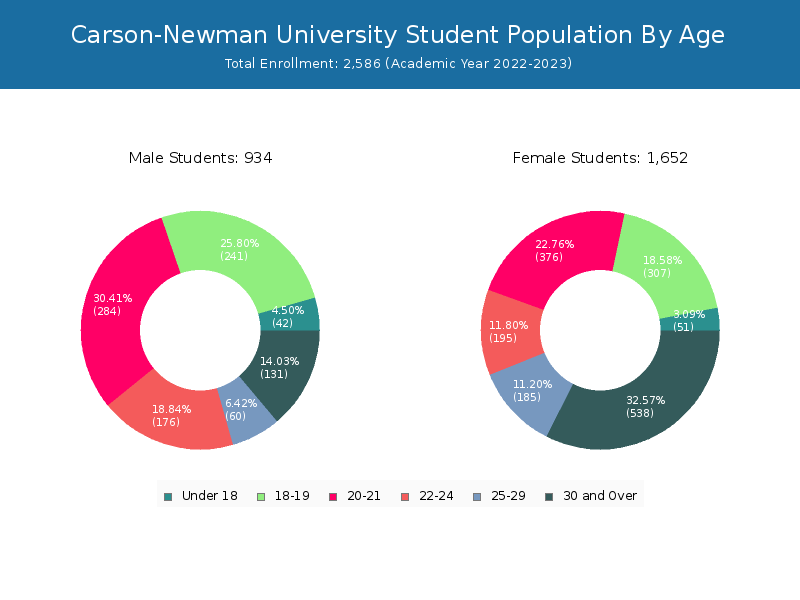
By gender, 934 male and 1,652 female students (the male-female ratio is 36:64) are attending the school. The gender distribution is based on the 2022-2023 data.
| Total | Undergraduate | Graduate | |
|---|---|---|---|
| Total | 2,586 | 1,519 | 1,067 |
| Men | 934 | 668 | 266 |
| Women | 1,652 | 851 | 801 |
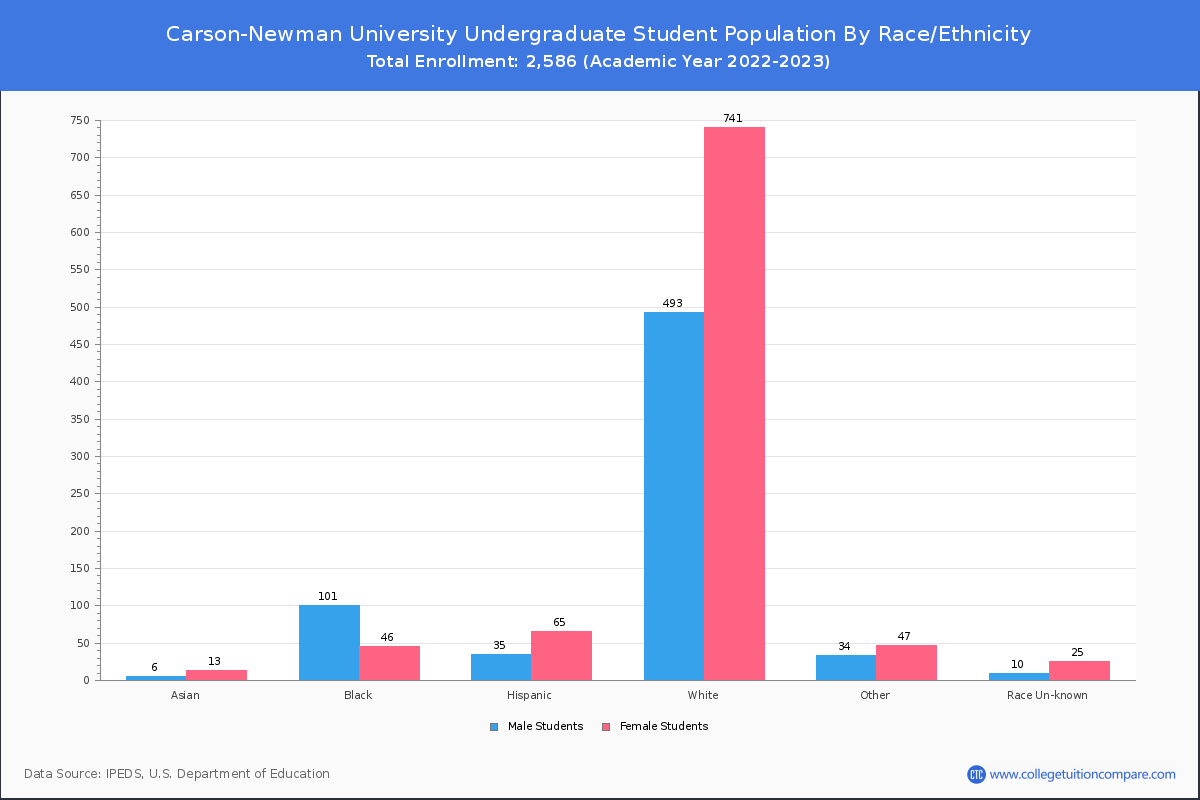
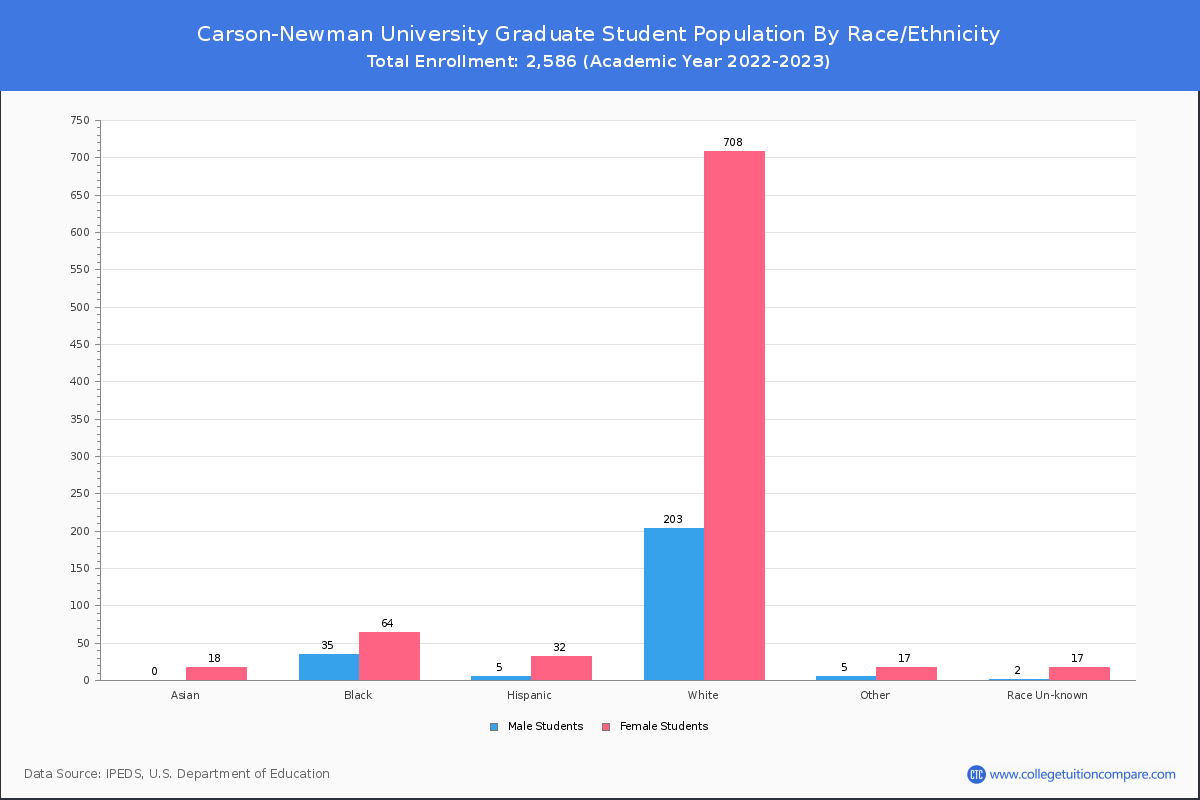
Student Distribution by Race/Ethnicity
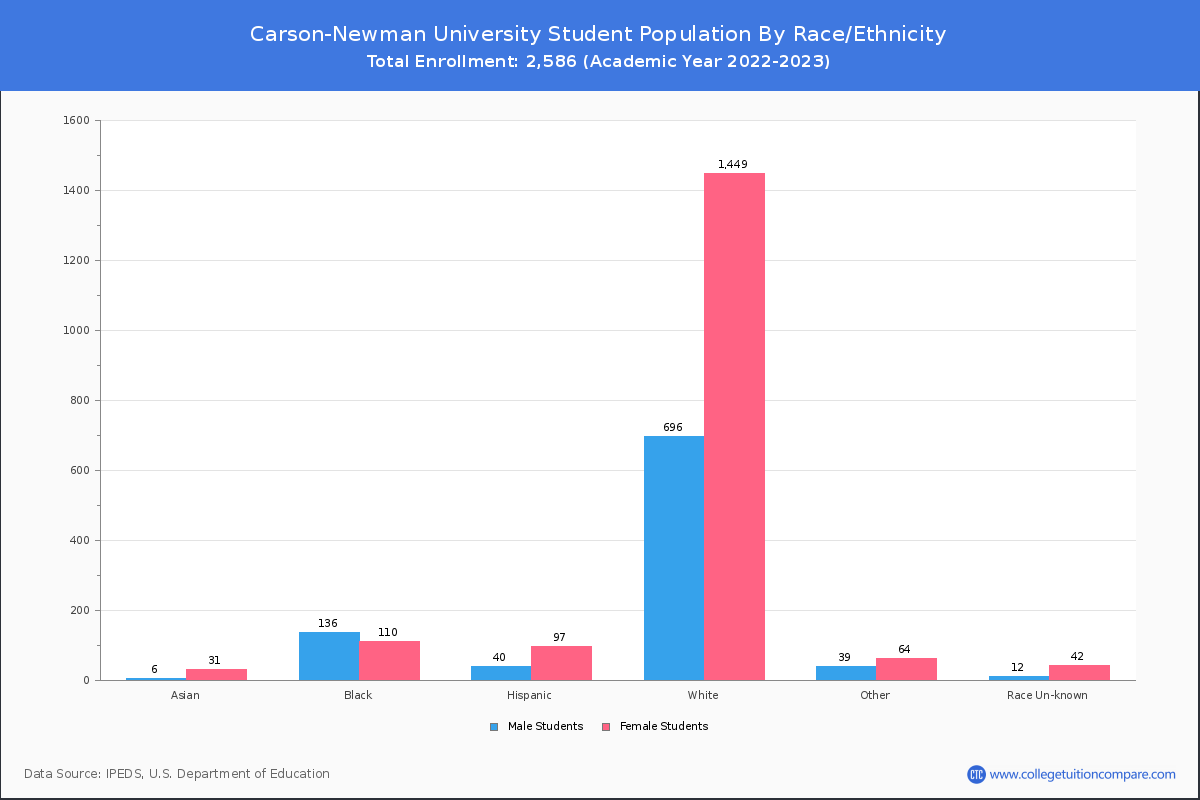
By race/ethnicity, 1,937 White, 235 Black, and 38 Asian students out of a total of 2,586 are attending at Carson-Newman University. Comprehensive enrollment statistic data by race/ethnicity is shown in the next chart (Academic year 2022-2023 data).
| Race | Total | Men | Women |
|---|---|---|---|
| American Indian or Native American | 19 | 12 | 7 |
| Asian | 38 | 8 | 30 |
| Black | 235 | 135 | 100 |
| Hispanic | 128 | 43 | 85 |
| Native Hawaiian or Other Pacific Islanders | 4 | 2 | 2 |
| White | 1,937 | 631 | 1,306 |
| Two or more races | 71 | 25 | 46 |
| Race Unknown | 39 | 13 | 26 |
| Race | Total | Men | Women |
|---|---|---|---|
| American Indian or Native American | 10 | 8 | 2 |
| Asian | 17 | 5 | 12 |
| Black | 135 | 98 | 37 |
| Hispanic | 86 | 36 | 50 |
| Native Hawaiian or Other Pacific Islanders | 4 | 2 | 2 |
| White | 1,117 | 453 | 664 |
| Two or more races | 59 | 21 | 38 |
| Race Unknown | 17 | 8 | 9 |
| Race | Total | Men | Women |
|---|---|---|---|
| American Indian or Native American | 0 | 0 | 0 |
| Asian | 0 | 0 | 0 |
| Black | 14 | 11 | 3 |
| Hispanic | 6 | 1 | 5 |
| Native Hawaiian or Other Pacific Islanders | 0 | 0 | 0 |
| White | 72 | 29 | 43 |
| Two or more races | 2 | 0 | 2 |
| Race Unknown | 5 | 1 | 4 |
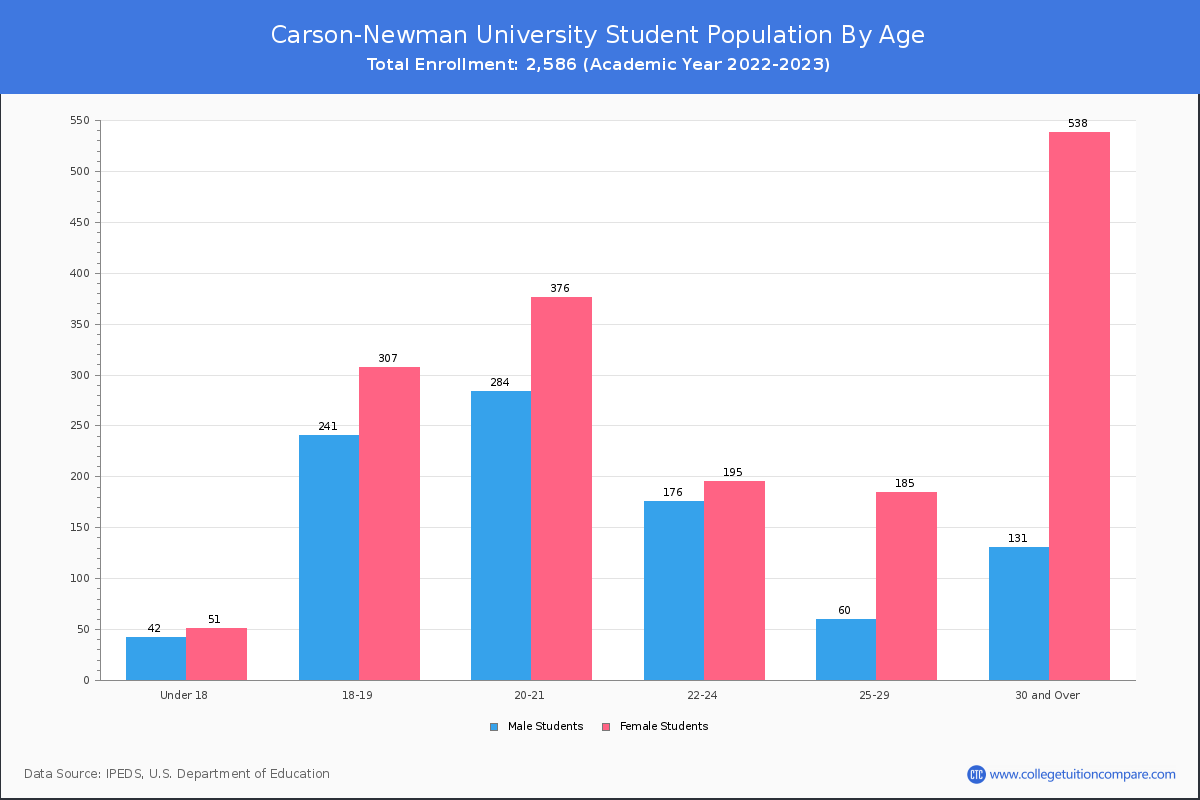
Student Age Distribution
By age, Carson-Newman has 93 students under 18 years old and 2 students over 65 years old. There are 1,672 students under 25 years old, and 914 students over 25 years old out of 2,586 total students.
Carson-Newman has 1,458 undergraduate students aged under 25 and 61 students aged 25 and over.
It has 214 graduate students aged under 25 and 853 students aged 25 and over.
| Age | Total | Men | Women |
|---|---|---|---|
| Under 18 | 93 | 51 | 42 |
| 18-19 | 548 | 307 | 241 |
| 20-21 | 660 | 376 | 284 |
| 22-24 | 371 | 195 | 176 |
| 25-29 | 245 | 185 | 60 |
| 30-34 | 178 | 130 | 48 |
| 35-39 | 146 | 124 | 22 |
| 40-49 | 236 | 192 | 44 |
| 50-64 | 107 | 90 | 17 |
| Over 65 | 2 | 2 | 0 |
| Age | Total | Men | Women |
|---|---|---|---|
| Under 18 | 93 | 51 | 42 |
| 18-19 | 548 | 307 | 241 |
| 20-21 | 645 | 367 | 278 |
| 22-24 | 172 | 87 | 85 |
| 25-29 | 23 | 16 | 7 |
| 30-34 | 19 | 11 | 8 |
| 35-39 | 7 | 4 | 3 |
| 40-49 | 7 | 4 | 3 |
| 50-64 | 5 | 4 | 1 |
| Age | Total | Men | Women |
|---|
Online Student Enrollment
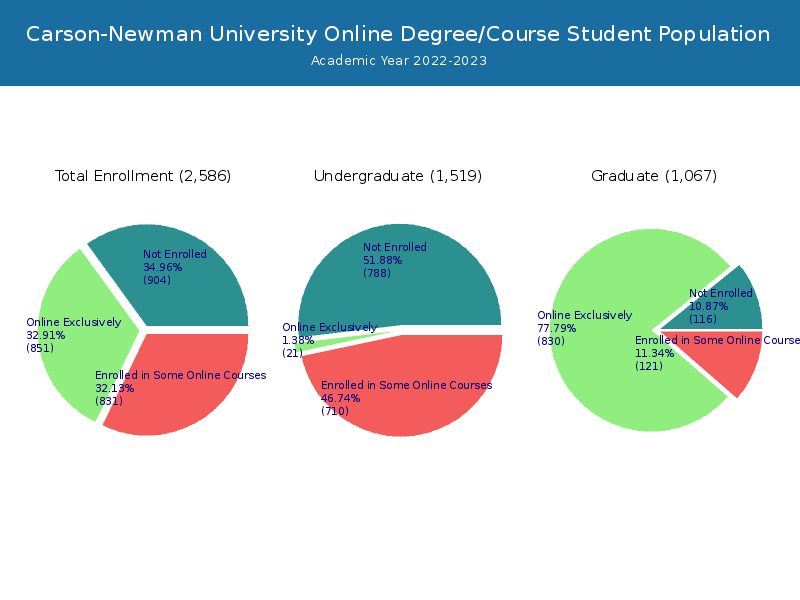
Distance learning, also called online education, is very attractive to students, especially who want to continue education and work in field. At Carson-Newman University, 851 students are enrolled exclusively in online courses and 831 students are enrolled in some online courses.
515 students lived in Tennessee or jurisdiction in which the school is located are enrolled exclusively in online courses and 336 students live in other State or outside of the United States.
| All Students | Enrolled Exclusively Online Courses | Enrolled in Some Online Courses | |
|---|---|---|---|
| All Students | 2,586 | 851 | 831 |
| Undergraduate | 1,519 | 21 | 710 |
| Graduate | 1,067 | 830 | 121 |
| Tennessee Residents | Other States in U.S. | Outside of U.S. | |
|---|---|---|---|
| All Students | 515 | 329 | 7 |
| Undergraduate | 19 | 2 | 0 |
| Graduate | 496 | 327 | 7 |
Transfer-in Students (Undergraduate)
Among 1,519 enrolled in undergraduate programs, 104 students have transferred-in from other institutions. The percentage of transfer-in students is 6.85%.103 students have transferred in as full-time status and 1 students transferred in as part-time status.
| Number of Students | |
|---|---|
| Regular Full-time | 1,305 |
| Transfer-in Full-time | 103 |
| Regular Part-time | 110 |
| Transfer-in Part-time | 1 |