Graduation Rates in Reasonable Completion Time
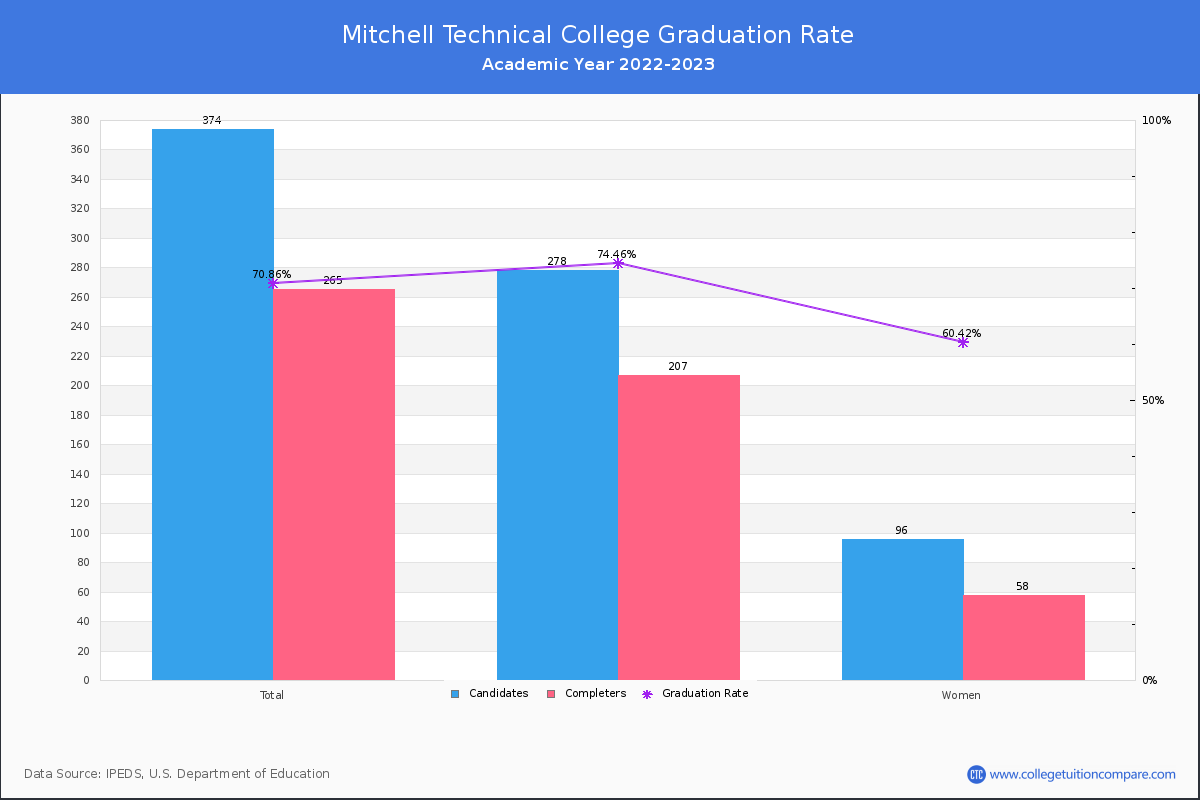
For the academic year 2022-2023, 265 students out of 374 candidates have completed their courses within 150% normal time (i.e. in 3 years for 2-year Associate degree) at Mitchell Technical College.
By gender, 207 male and 58 female students graduated the school last year completing their jobs in the period. Its graduation rate is much higher than the average rate when comparing similar colleges' rate of 34.56% (public urban-serving multi-campus Associate's college).
| Candidates | Completers | Graduation Rates | |
|---|---|---|---|
| Total | 374 | 265 | 70.86% |
| Men | 278 | 207 | 74.46% |
| Women | 96 | 58 | 60.42% |
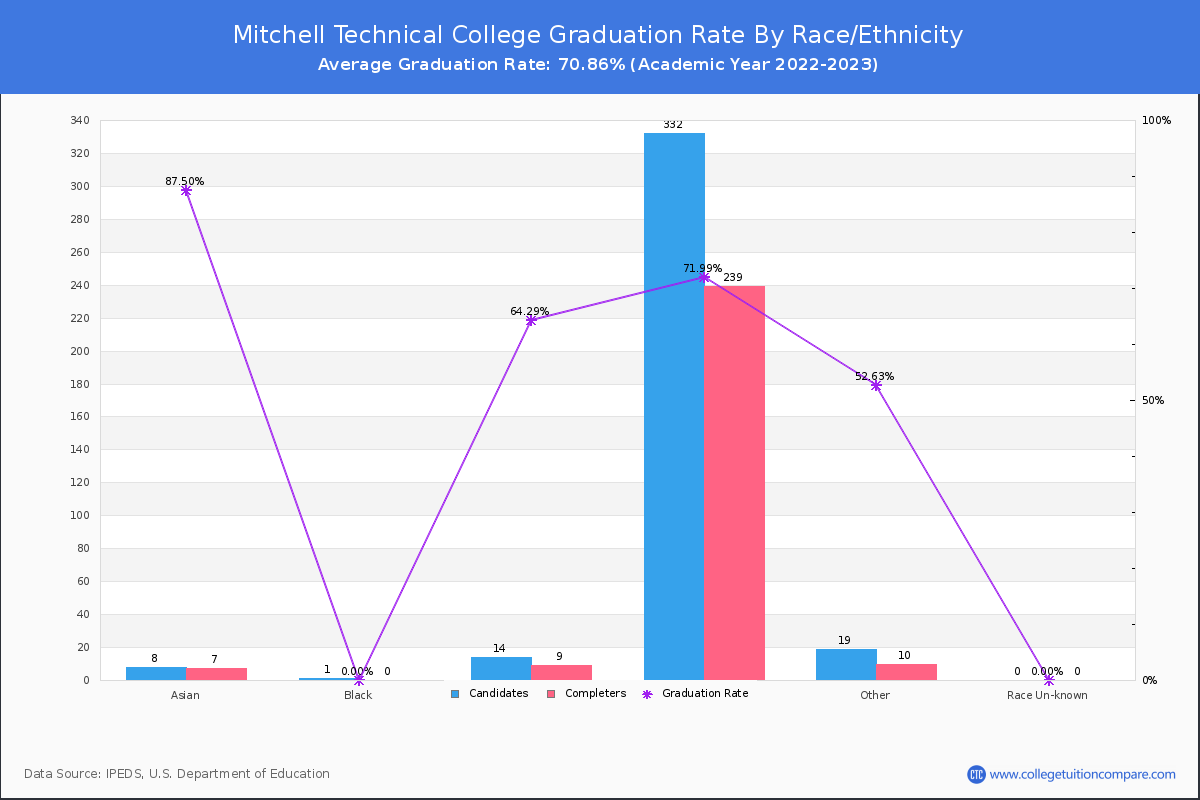
Graduation Rate By Race/Ethnicity
The following table shows graduation rate by race and at Mitchell Technical College.
- American Indian or Alaska Native: 46.67%
- Asian: 87.50%
- Black (Non-Hispanic): 0.00%
- Hispanic: 64.29%
- White: 71.99%
- Native Hawaiian or Other Pacific Islander: 100.00%
- Two or More Race: 66.67%
| Total | Male | Female | |
|---|---|---|---|
| American Indian or Alaska Native | 46.67%(7/15) | 40.00%(4/10) | 60.00%(3/5) |
| Asian | 87.50%(7/8) | 85.71%(6/7) | 100.00%(1/1) |
| Black (Non-Hispanic) | 0.00%(-/1) | - | - |
| Hispanic | 64.29%(9/14) | 72.73%(8/11) | 33.33%(1/3) |
| White | 71.99%(239/332) | 75.61%(186/246) | 61.63%(53/86) |
| Native Hawaiian or Other Pacific Islander | 100.00%(1/1) | 100.00%(1/1) | - |
| Two or More Race | 66.67%(2/3) | 100.00%(2/2) | - |
Transfer-out and Retention Rates
At Mitchell Technical, the transfer-out rate is 5.35%. Its transfer-out rate is much lower than the average rate when comparing similar colleges' rate of 13.91%.
AMitchell Technical's retention rate is 81% for full-time students and 64 % for part-time students last year. Its retention rate is higher than the average rate when comparing similar colleges' rate of 62.17%.