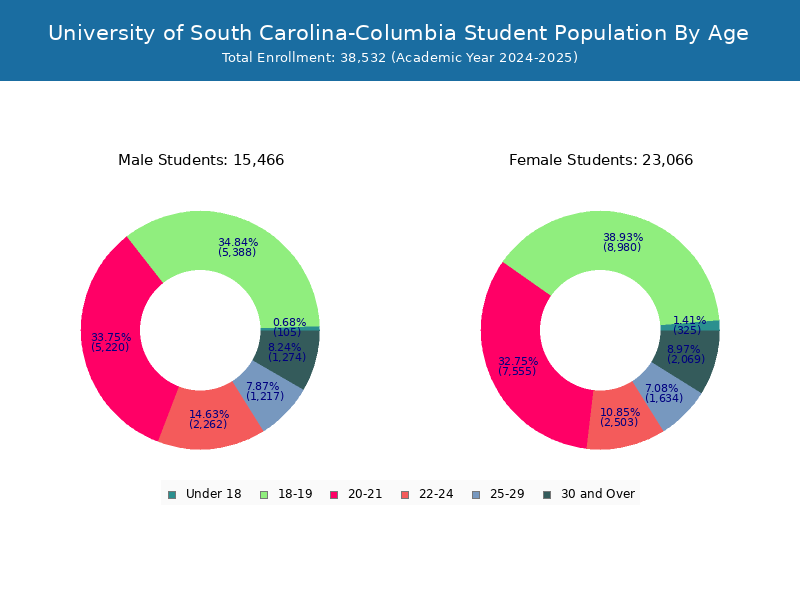
Student Population by Gender
University of South Carolina-Columbia has a total of 35,653 enrolled students for the academic year 2022-2023. 27,343 students have enrolled in undergraduate programs and 8,310 students joined graduate programs.
By gender, 15,070 male and 20,583 female students (the male-female ratio is 42:58) are attending the school. The gender distribution is based on the 2022-2023 data.
| Total | Undergraduate | Graduate | |
|---|---|---|---|
| Total | 35,653 | 27,343 | 8,310 |
| Men | 15,070 | 11,975 | 3,095 |
| Women | 20,583 | 15,368 | 5,215 |
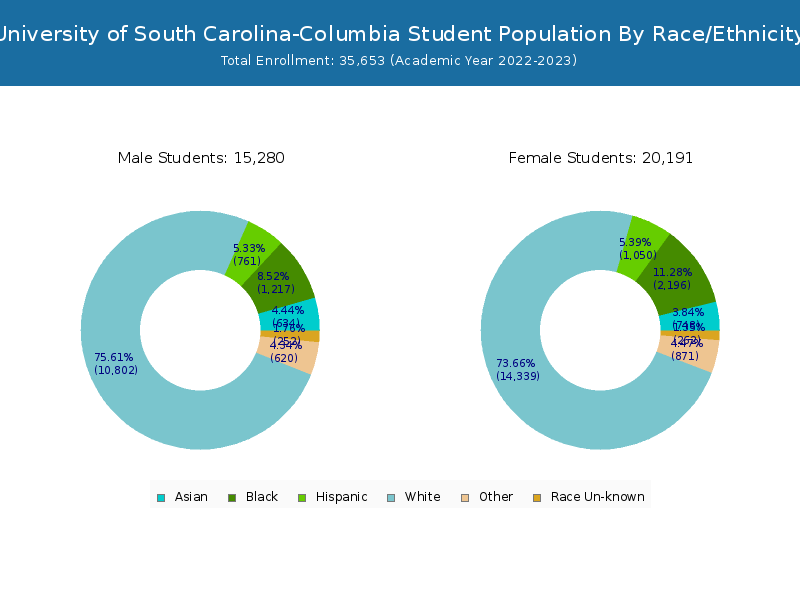

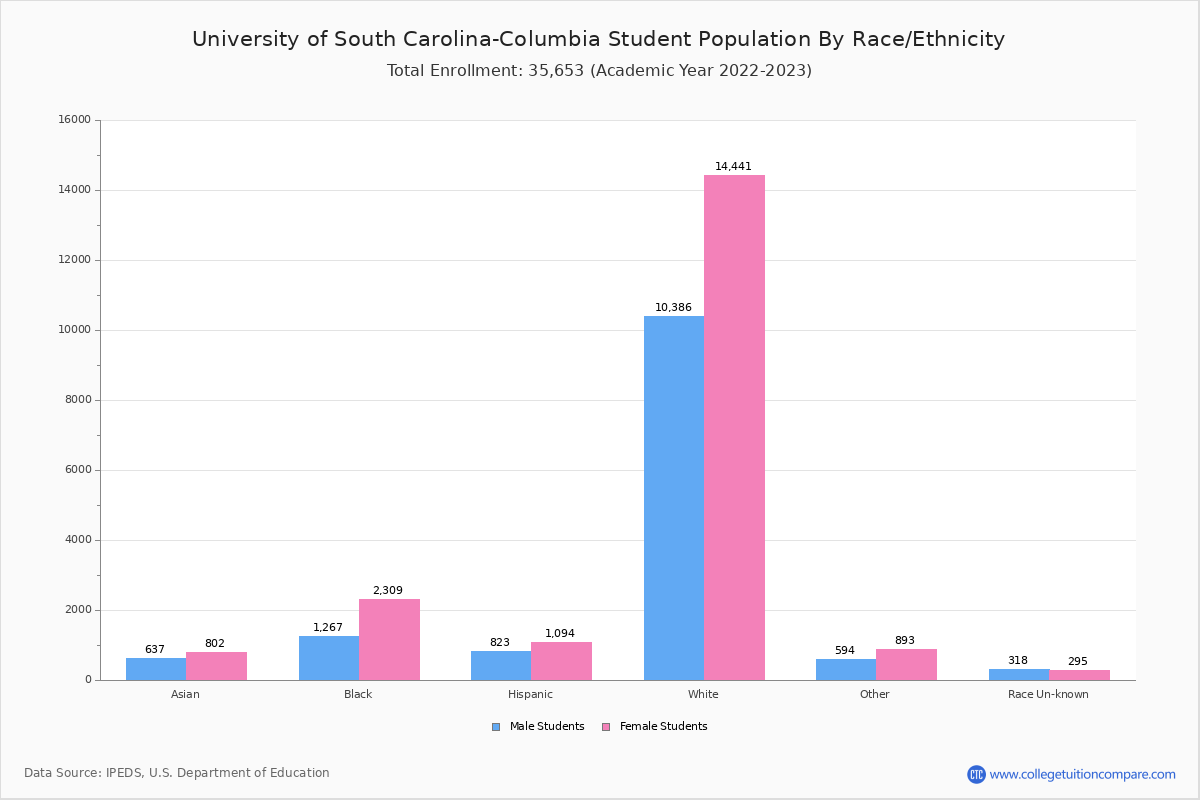
Student Distribution by Race/Ethnicity
By race/ethnicity, 24,827 White, 3,576 Black, and 1,439 Asian students out of a total of 35,653 are attending at University of South Carolina-Columbia. Comprehensive enrollment statistic data by race/ethnicity is shown in the next chart (Academic year 2022-2023 data).

| Race | Total | Men | Women |
|---|---|---|---|
| American Indian or Native American | 53 | 18 | 35 |
| Asian | 1,439 | 637 | 802 |
| Black | 3,576 | 1,267 | 2,309 |
| Hispanic | 1,917 | 823 | 1,094 |
| Native Hawaiian or Other Pacific Islanders | 23 | 11 | 12 |
| White | 24,827 | 10,386 | 14,441 |
| Two or more races | 1,411 | 565 | 846 |
| Race Unknown | 613 | 318 | 295 |
| Race | Total | Men | Women |
|---|---|---|---|
| American Indian or Native American | 37 | 13 | 24 |
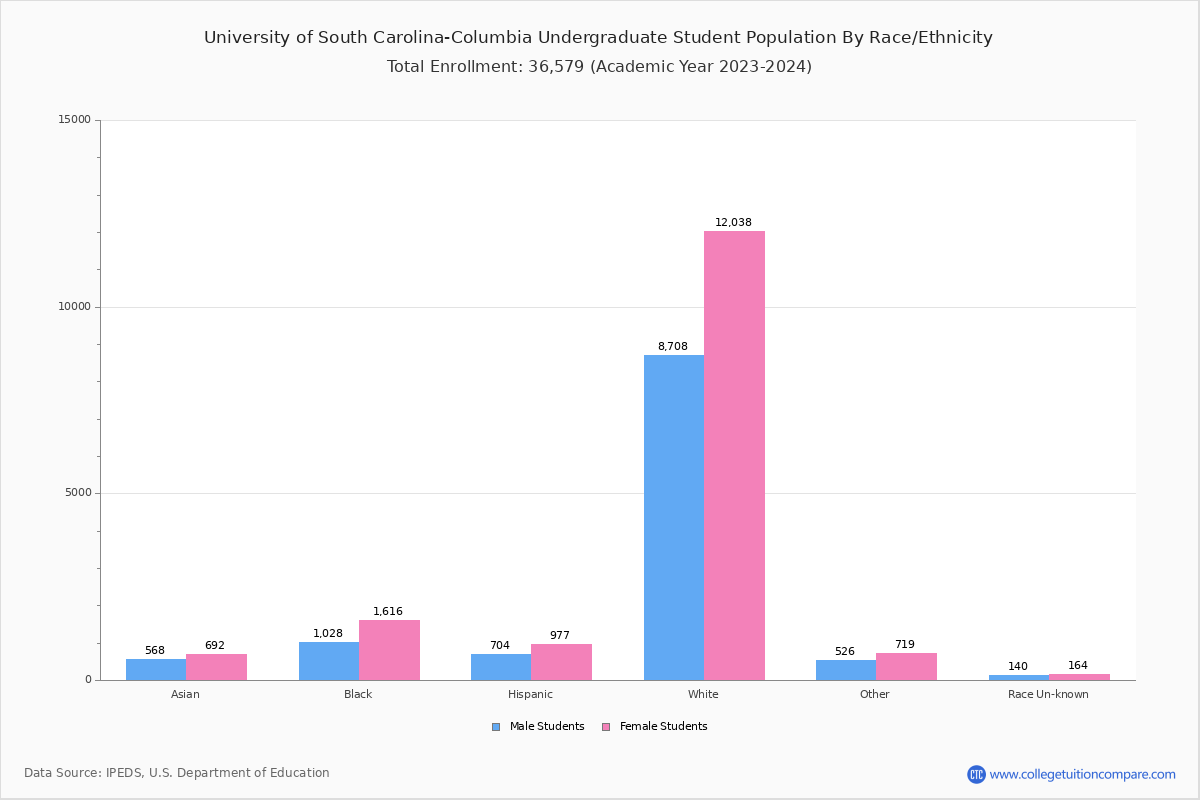
| Asian | 1,151 | 518 | 633 |
| Black | 2,511 | 1,029 | 1,482 |
| Hispanic | 1,570 | 694 | 876 |
| Native Hawaiian or Other Pacific Islanders | 21 | 10 | 11 |
| White | 19,871 | 8,645 | 11,226 |
| Two or more races | 1,138 | 471 | 667 |
| Race Unknown | 302 | 144 | 158 |
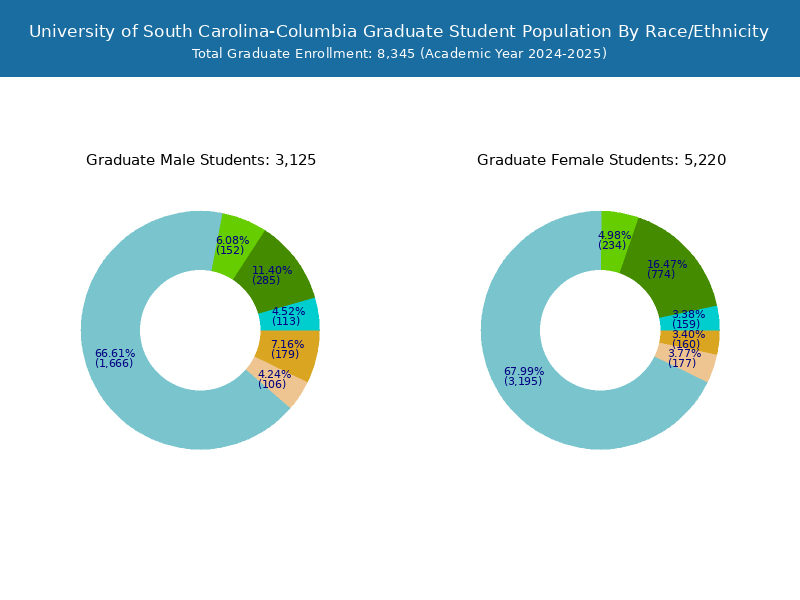
| Race | Total | Men | Women |
|---|---|---|---|
| American Indian or Native American | 1 | 0 | 1 |
| Asian | 42 | 21 | 21 |
| Black | 202 | 90 | 112 |
| Hispanic | 105 | 52 | 53 |
| Native Hawaiian or Other Pacific Islanders | 2 | 1 | 1 |
| White | 863 | 435 | 428 |
| Two or more races | 62 | 31 | 31 |
| Race Unknown | 3 | 3 | 0 |
Student Age Distribution
By age, South Carolina has 383 students under 18 years old and 91 students over 65 years old. There are 29,381 students under 25 years old, and 6,272 students over 25 years old out of 35,653 total students.
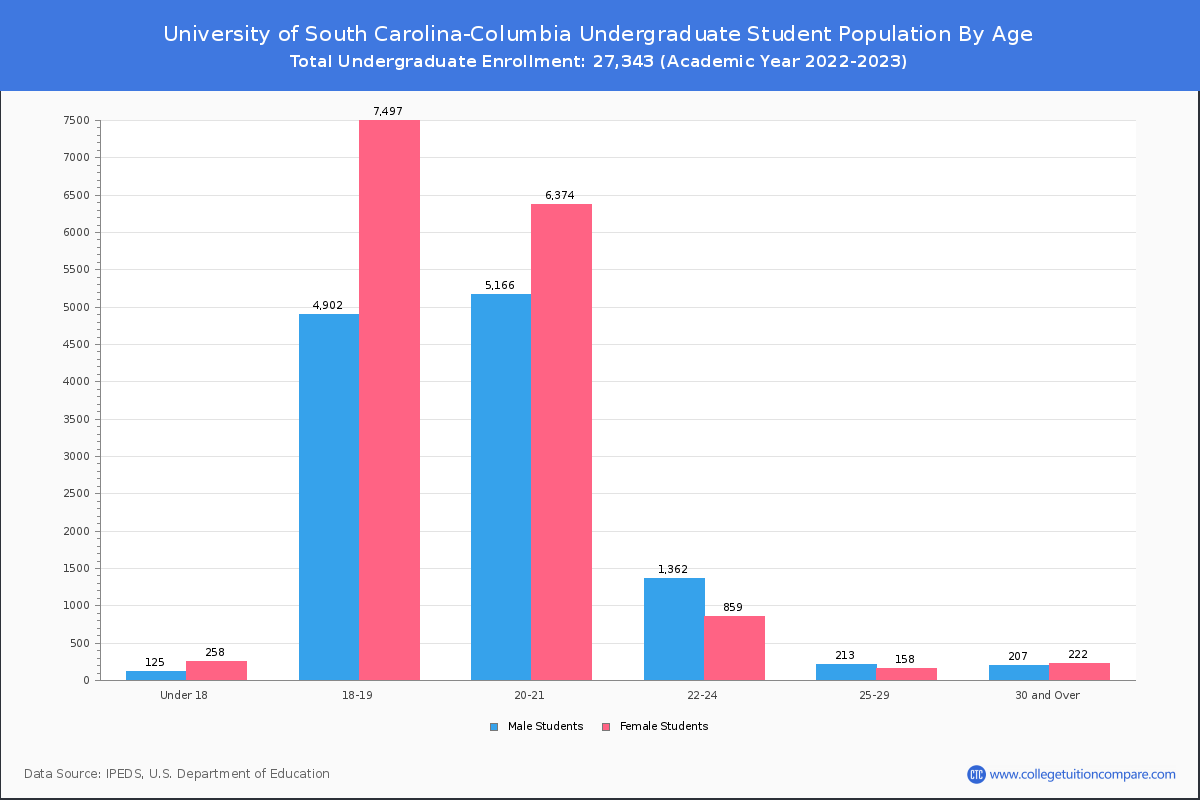
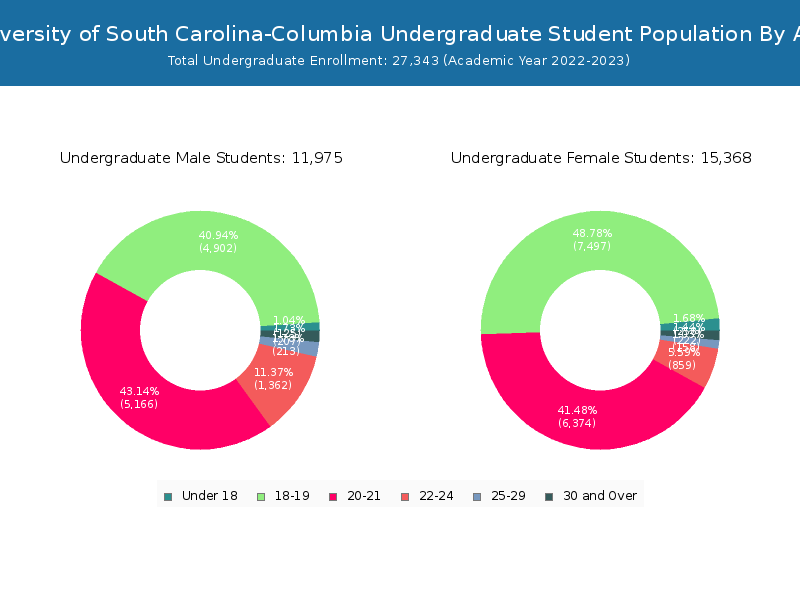
In undergraduate programs, 383 students are younger than 18 and 46 students are older than 65. South Carolina has 26,543 undergraduate students aged under 25 and 800 students aged 25 and over.
It has 2,838 graduate students aged under 25 and 5,472 students aged 25 and over.
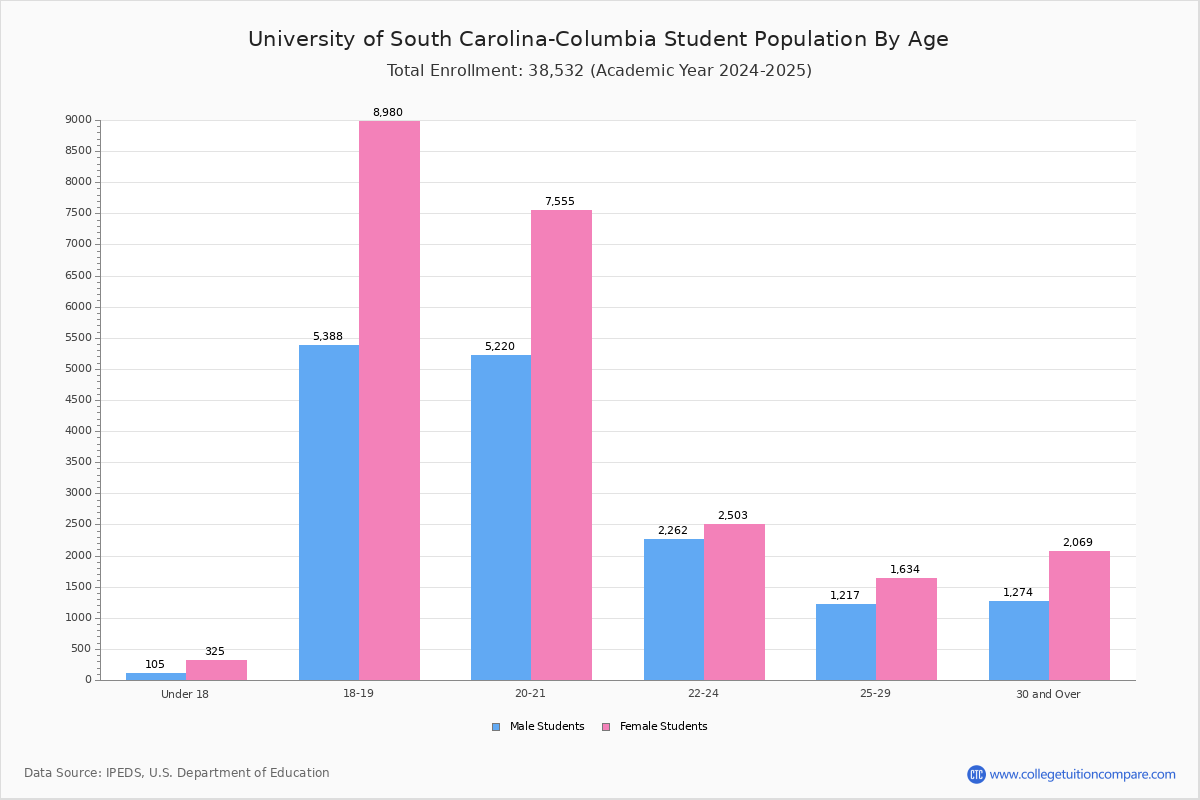


| Age | Total | Men | Women |
|---|---|---|---|
| Under 18 | 383 | 258 | 125 |
| 18-19 | 12,401 | 7,498 | 4,903 |
| 20-21 | 11,856 | 6,610 | 5,246 |
| 22-24 | 4,741 | 2,485 | 2,256 |
| 25-29 | 2,865 | 1,616 | 1,249 |
| 30-34 | 1,328 | 735 | 593 |
| 35-39 | 714 | 449 | 265 |
| 40-49 | 890 | 624 | 266 |
| 50-64 | 384 | 267 | 117 |
| Over 65 | 91 | 41 | 50 |
| Age | Total | Men | Women |
|---|---|---|---|
| Under 18 | 383 | 258 | 125 |
| 18-19 | 12,399 | 7,497 | 4,902 |
| 20-21 | 11,540 | 6,374 | 5,166 |
| 22-24 | 2,221 | 859 | 1,362 |
| 25-29 | 371 | 158 | 213 |
| 30-34 | 161 | 73 | 88 |
| 35-39 | 77 | 41 | 36 |
| 40-49 | 85 | 51 | 34 |
| 50-64 | 60 | 37 | 23 |
| Over 65 | 46 | 20 | 26 |
| Age | Total | Men | Women |
|---|
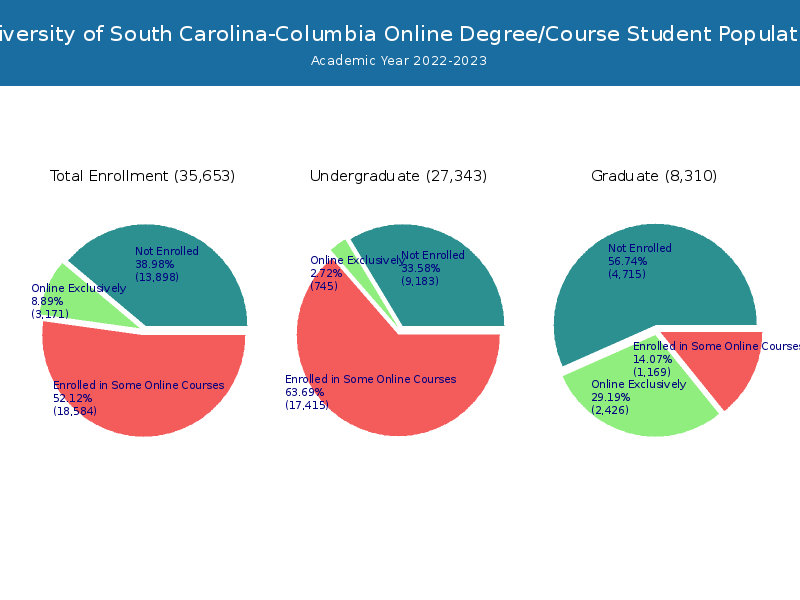
Online Student Enrollment
Distance learning, also called online education, is very attractive to students, especially who want to continue education and work in field. At University of South Carolina-Columbia, 3,171 students are enrolled exclusively in online courses and 18,584 students are enrolled in some online courses.
2,446 students lived in South Carolina or jurisdiction in which the school is located are enrolled exclusively in online courses and 725 students live in other State or outside of the United States.
| All Students | Enrolled Exclusively Online Courses | Enrolled in Some Online Courses | |
|---|---|---|---|
| All Students | 35,653 | 3,171 | 18,584 |
| Undergraduate | 27,343 | 745 | 17,415 |
| Graduate | 8,310 | 2,426 | 1,169 |
| South Carolina Residents | Other States in U.S. | Outside of U.S. | |
|---|---|---|---|
| All Students | 2,446 | 717 | 8 |
| Undergraduate | 653 | 91 | 1 |
| Graduate | 1,793 | 626 | 7 |
Transfer-in Students (Undergraduate)
Among 27,343 enrolled in undergraduate programs, 1,315 students have transferred-in from other institutions. The percentage of transfer-in students is 4.81%.1,236 students have transferred in as full-time status and 79 students transferred in as part-time status.
| Number of Students | |
|---|---|
| Regular Full-time | 25,006 |
| Transfer-in Full-time | 1,236 |
| Regular Part-time | 1,022 |
| Transfer-in Part-time | 79 |