Graduation Rates in Reasonable Completion Time
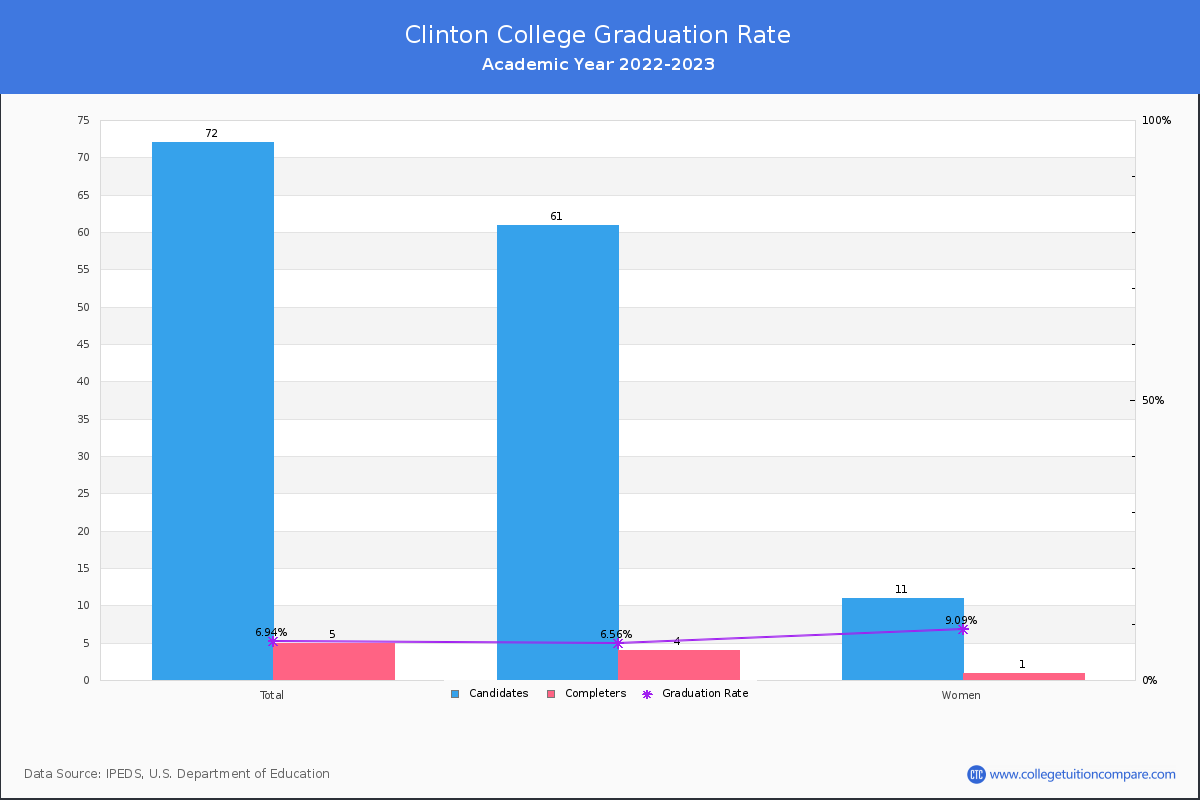
For the academic year 2022-2023, 10 students out of 84 candidates have completed their courses within 150% normal time (i.e. in 6 years for 4-year BS degree) at Clinton College.
By gender, 8 male and 2 female students graduated the school last year completing their jobs in the period. Its graduation rate is much lower than the average rate when comparing similar colleges' rate of 39.69% (private (not-for-profit) Baccalaureate/Associate's College).
| Candidates | Completers | Graduation Rates | |
|---|---|---|---|
| Total | 84 | 10 | 11.90% |
| Men | 70 | 8 | 11.43% |
| Women | 14 | 2 | 14.29% |
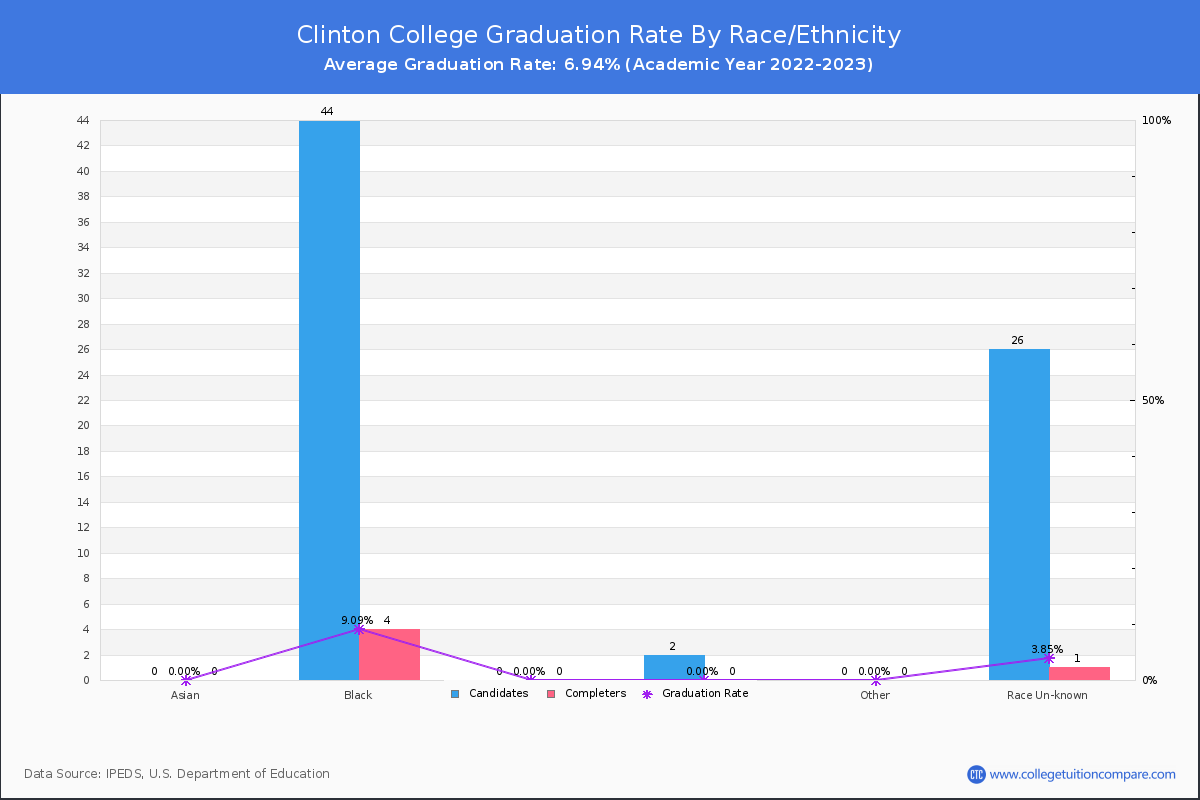
Graduation Rate By Race/Ethnicity
The following table shows graduation rate by race and at Clinton College.
- Black (Non-Hispanic): 15.38%
- White: 0.00%
- Unknown: 6.67%
| Total | Male | Female | |
|---|---|---|---|
| Black (Non-Hispanic) | 15.38%(8/52) | 13.64%(6/44) | 25.00%(2/8) |
| White | 0.00%(-/2) | - | - |
| Unknown | 6.67%(2/30) | 8.33%(2/24) | - |