Student Population by Gender
Clemson University has a total of 28,466 enrolled students for the academic year 2022-2023. 22,566 students have enrolled in undergraduate programs and 5,900 students joined graduate programs.
By gender, 13,554 male and 14,912 female students (the male-female ratio is 48:52) are attending the school. The gender distribution is based on the 2022-2023 data.
| Total | Undergraduate | Graduate | |
|---|---|---|---|
| Total | 28,466 | 22,566 | 5,900 |
| Men | 13,554 | 10,717 | 2,837 |
| Women | 14,912 | 11,849 | 3,063 |
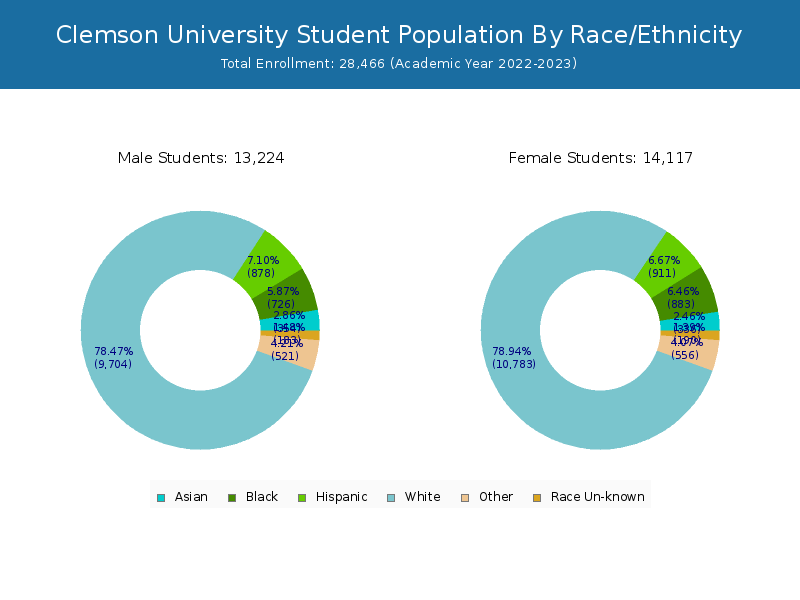
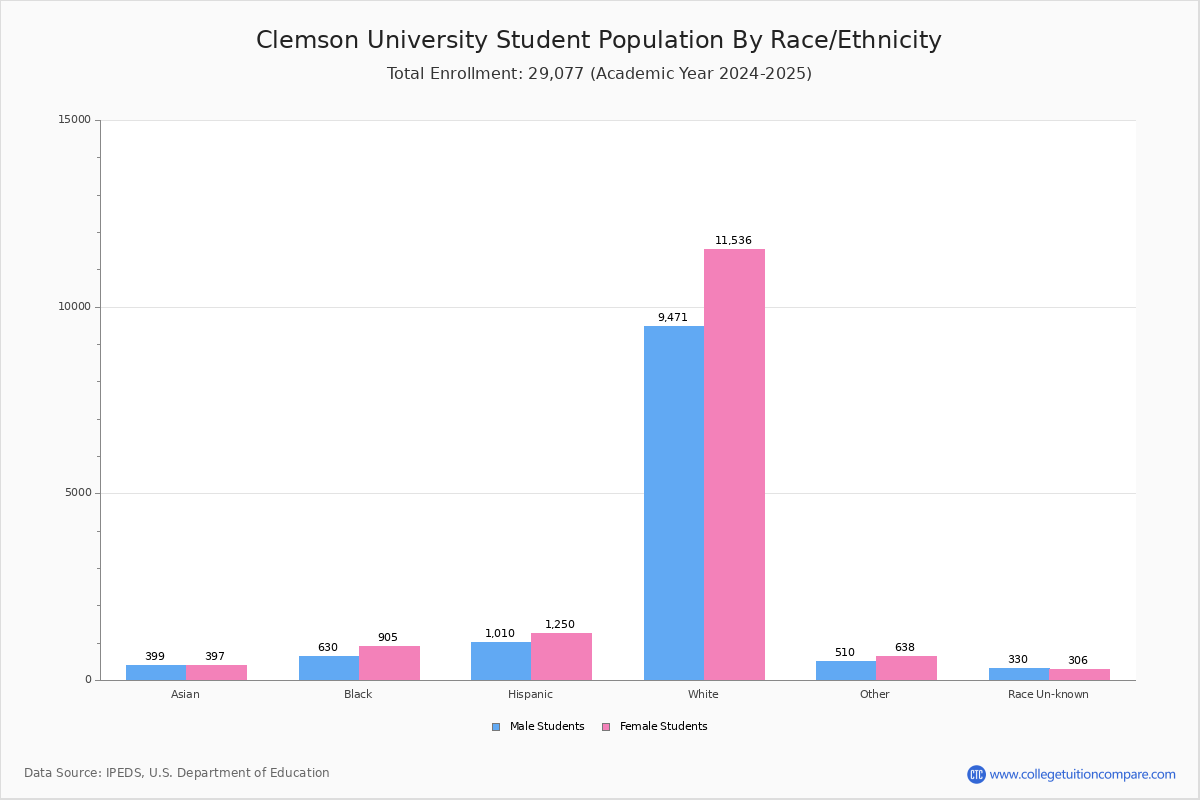
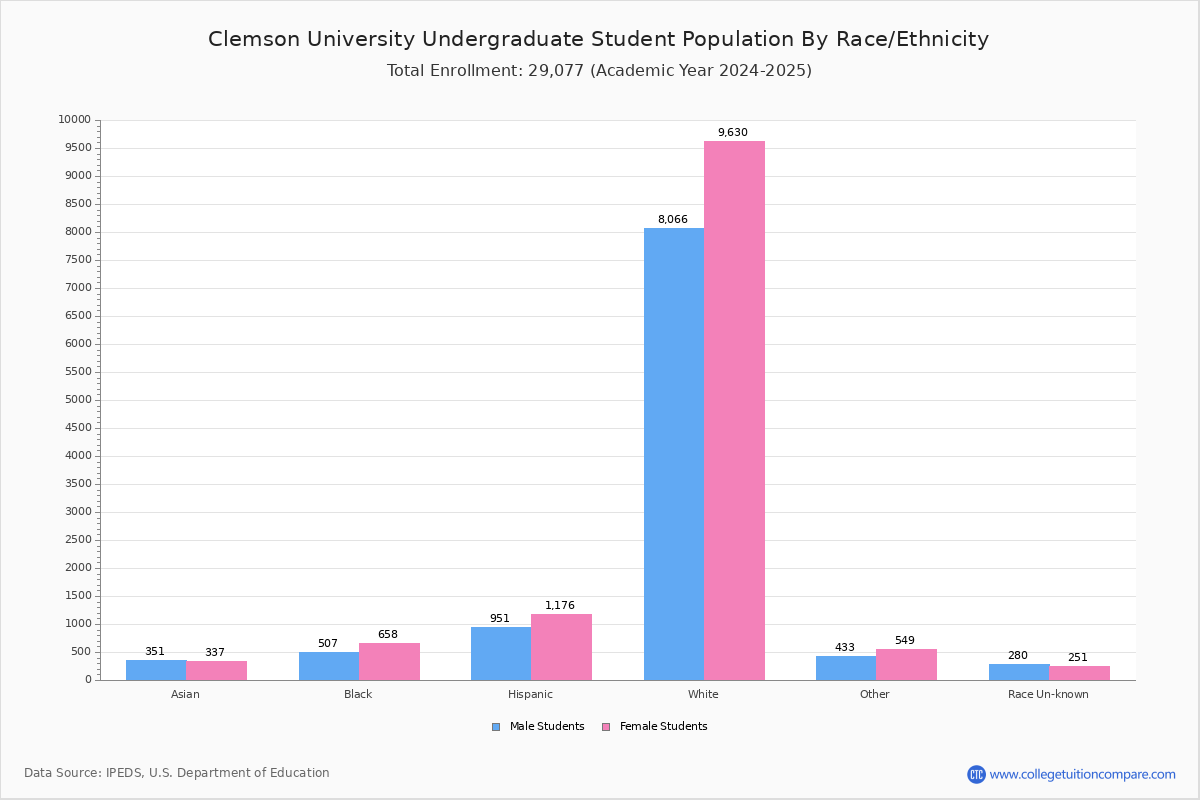
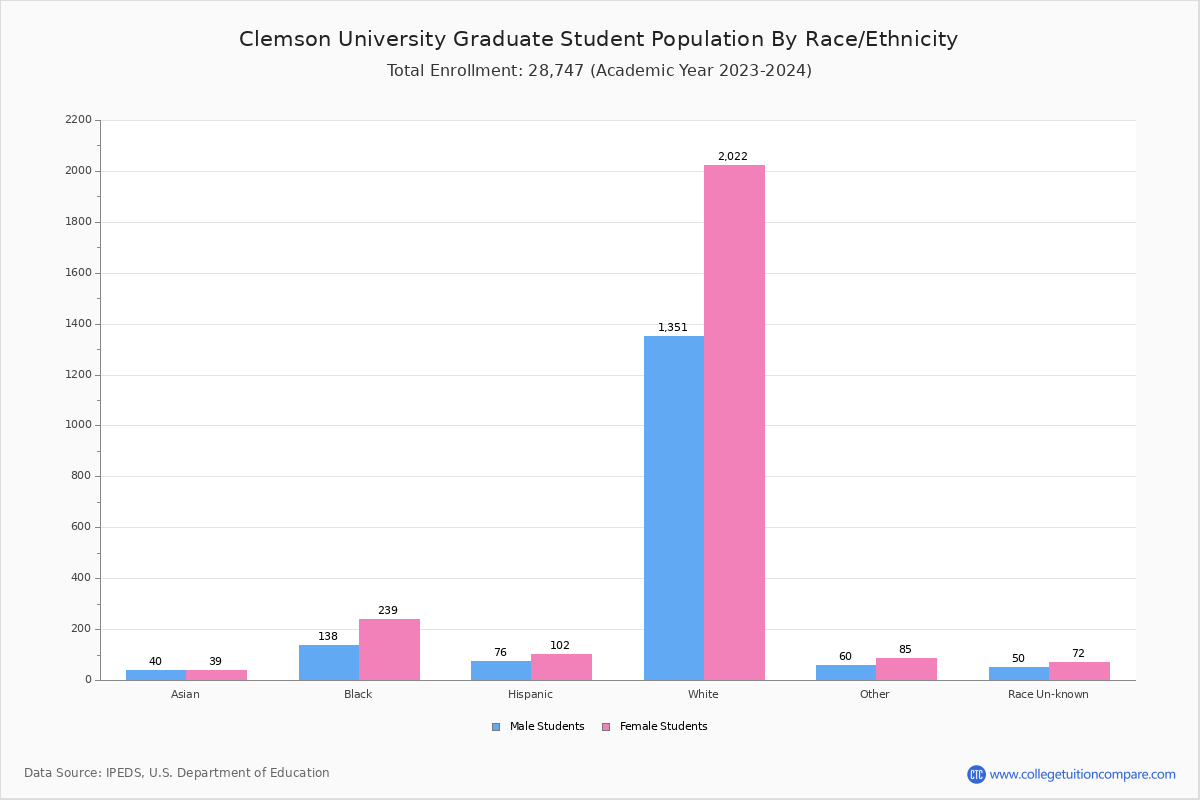
Student Distribution by Race/Ethnicity
By race/ethnicity, 20,834 White, 1,629 Black, and 748 Asian students out of a total of 28,466 are attending at Clemson University. Comprehensive enrollment statistic data by race/ethnicity is shown in the next chart (Academic year 2022-2023 data).
| Race | Total | Men | Women |
|---|---|---|---|
| American Indian or Native American | 61 | 24 | 37 |
| Asian | 748 | 364 | 384 |
| Black | 1,629 | 696 | 933 |
| Hispanic | 2,000 | 951 | 1,049 |
| Native Hawaiian or Other Pacific Islanders | 31 | 19 | 12 |
| White | 20,834 | 9,699 | 11,135 |
| Two or more races | 1,007 | 473 | 534 |
| Race Unknown | 502 | 244 | 258 |
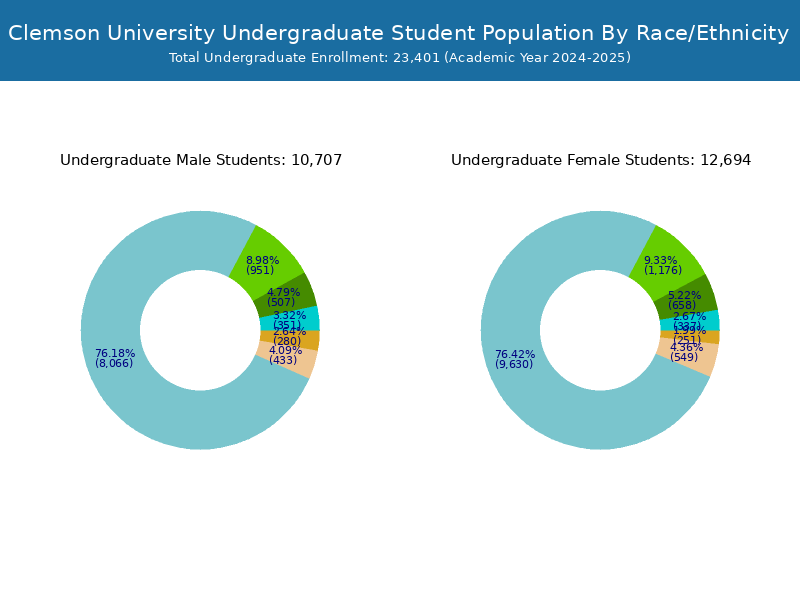
| Race | Total | Men | Women |
|---|---|---|---|
| American Indian or Native American | 54 | 22 | 32 |
| Asian | 662 | 317 | 345 |
| Black | 1,223 | 535 | 688 |
| Hispanic | 1,773 | 860 | 913 |
| Native Hawaiian or Other Pacific Islanders | 24 | 14 | 10 |
| White | 17,385 | 8,262 | 9,123 |
| Two or more races | 887 | 423 | 464 |
| Race Unknown | 384 | 192 | 192 |
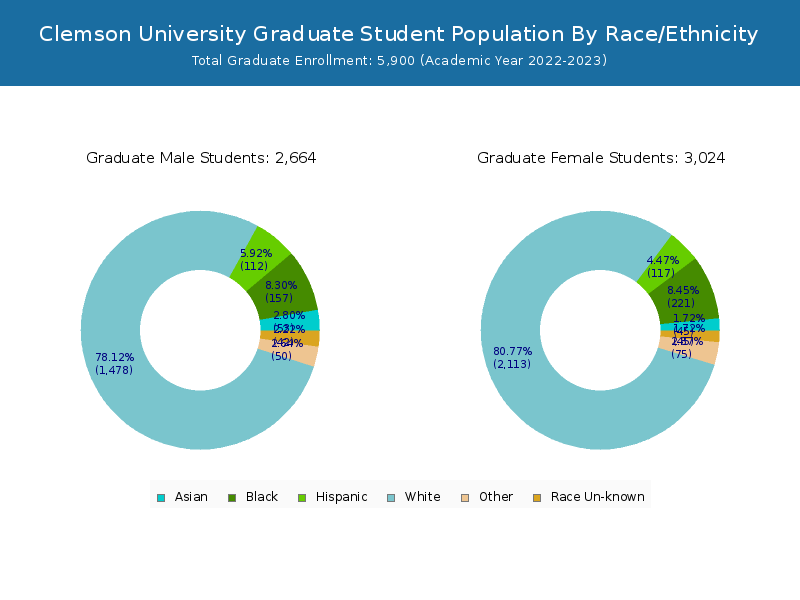
| Race | Total | Men | Women |
|---|---|---|---|
| American Indian or Native American | 1 | 0 | 1 |
| Asian | 49 | 28 | 21 |
| Black | 63 | 27 | 36 |
| Hispanic | 97 | 45 | 52 |
| Native Hawaiian or Other Pacific Islanders | 0 | 0 | 0 |
| White | 1,312 | 725 | 587 |
| Two or more races | 55 | 28 | 27 |
| Race Unknown | 28 | 18 | 10 |
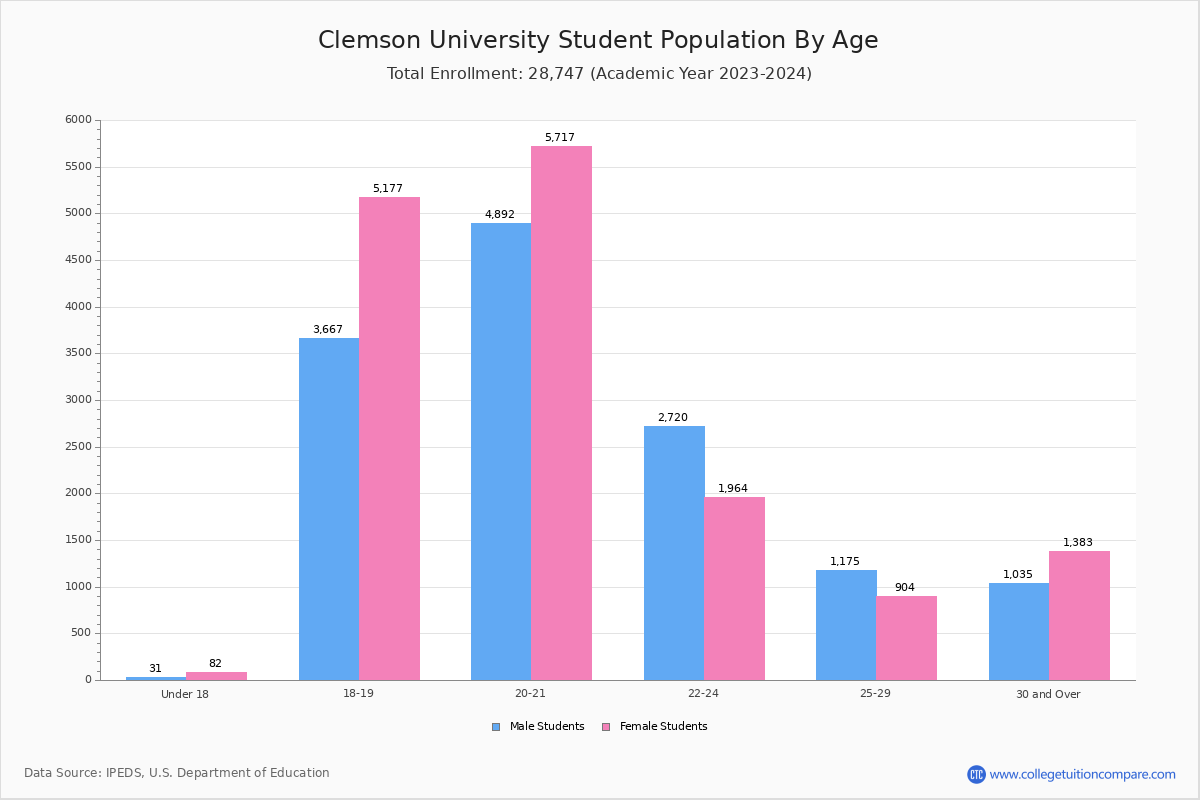
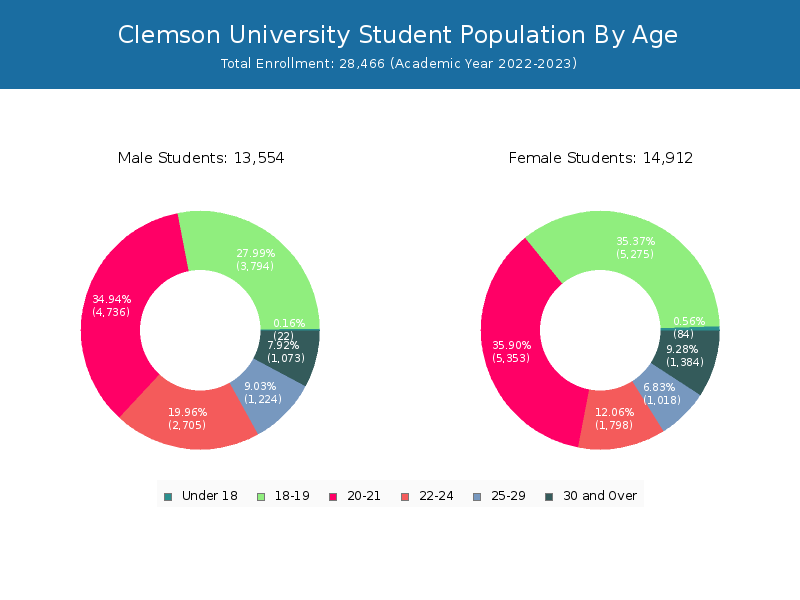
Student Age Distribution
By age, Clemson has 106 students under 18 years old and 20 students over 65 years old. There are 23,767 students under 25 years old, and 4,699 students over 25 years old out of 28,466 total students.
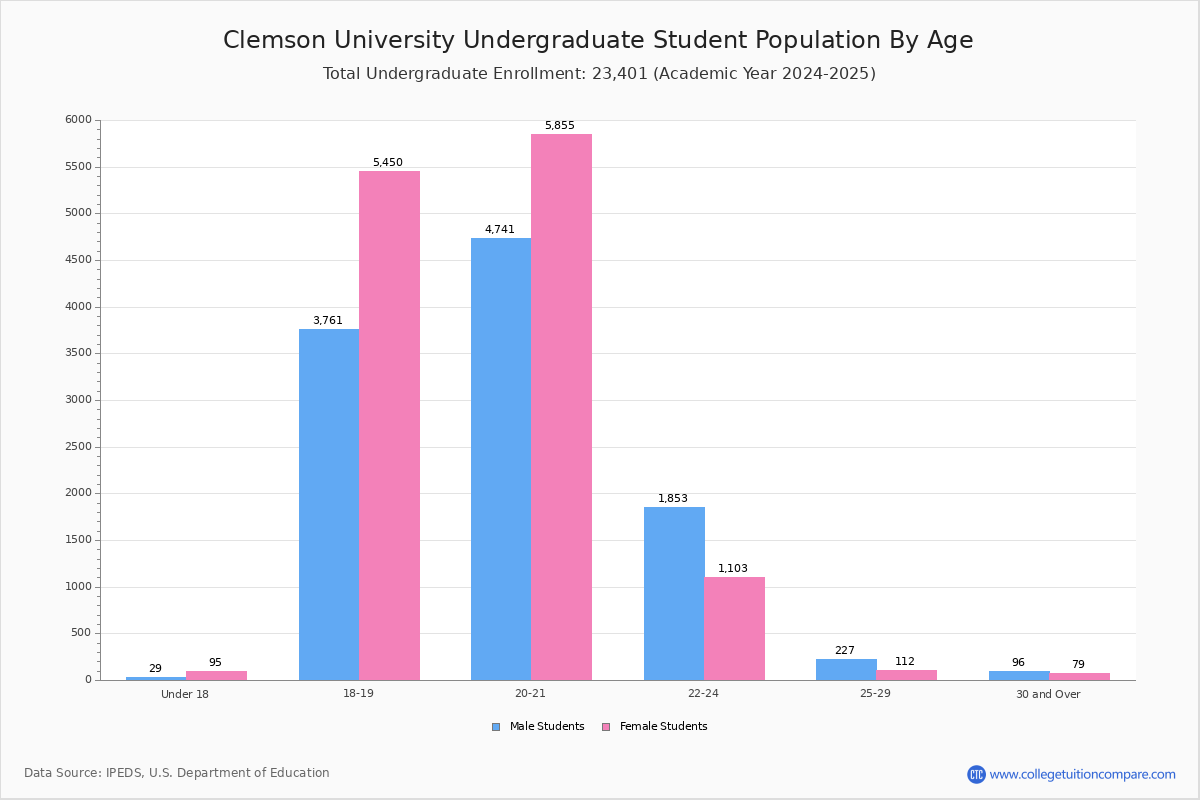
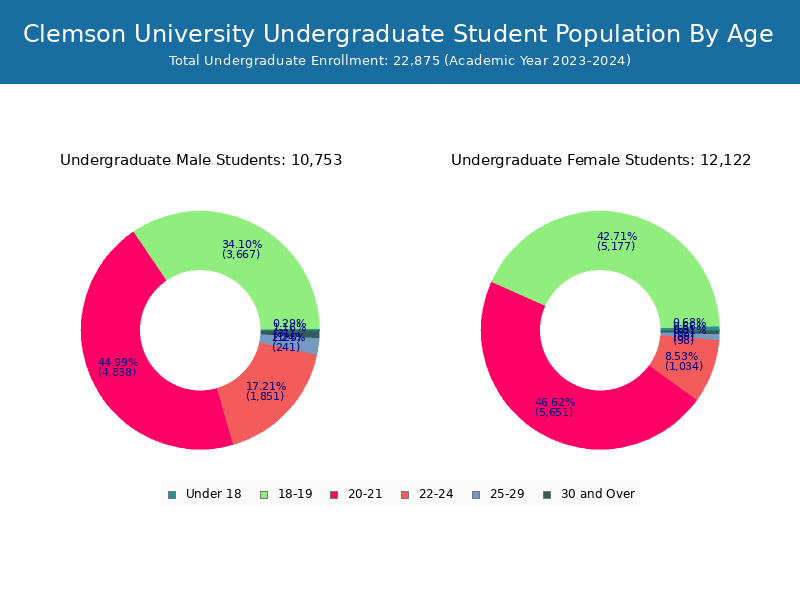
In undergraduate programs, 106 students are younger than 18 and 6 students are older than 65. Clemson has 22,003 undergraduate students aged under 25 and 563 students aged 25 and over.
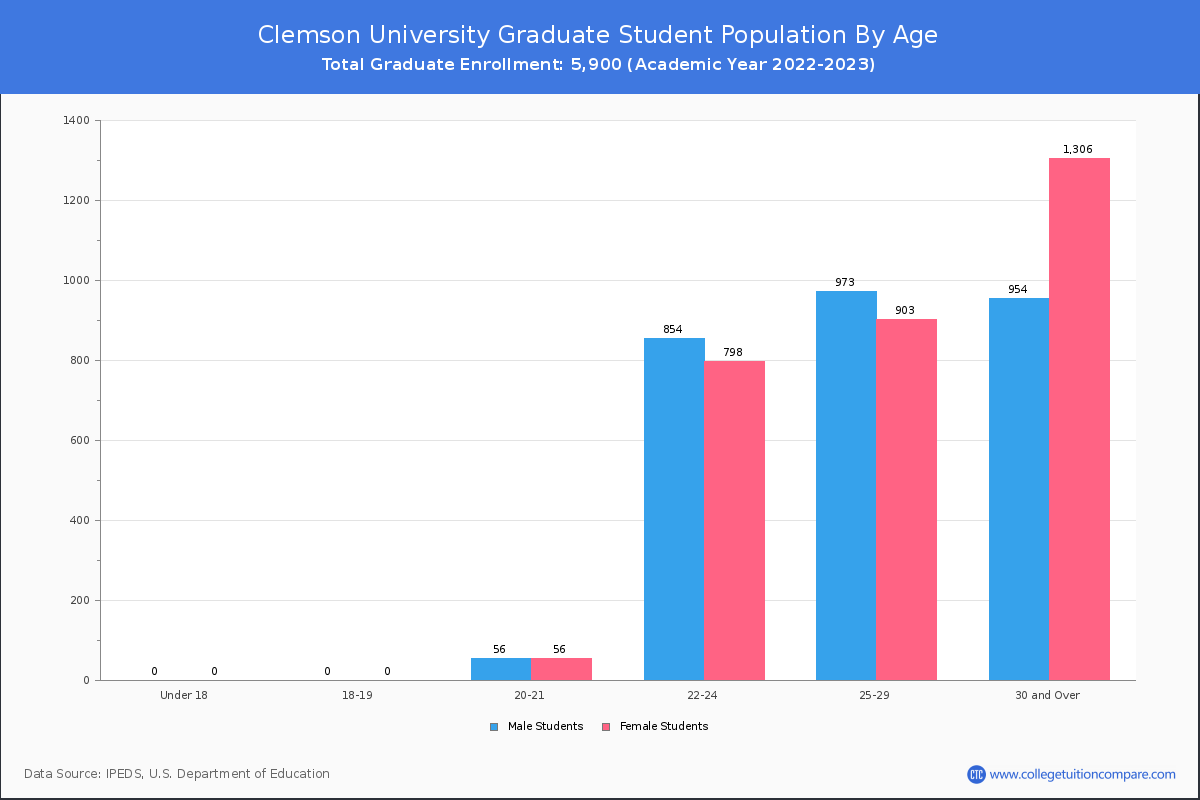
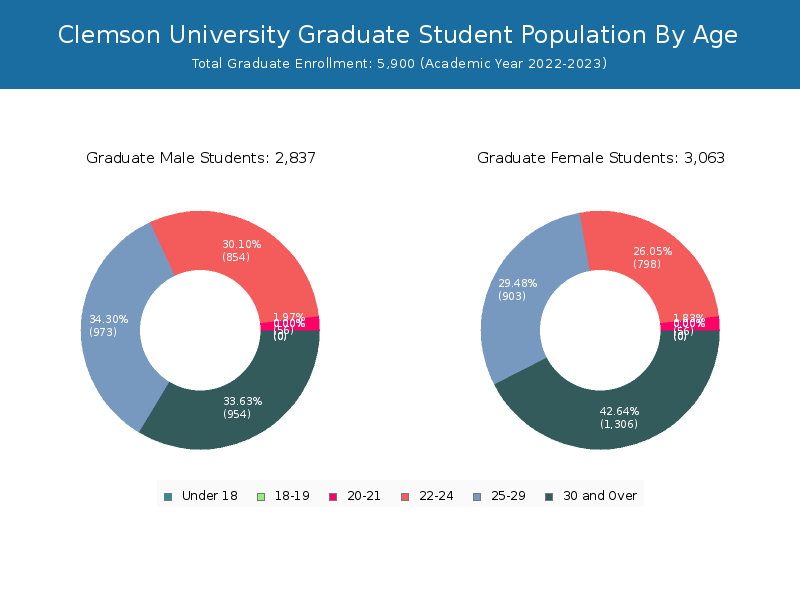
It has 1,764 graduate students aged under 25 and 4,136 students aged 25 and over.
| Age | Total | Men | Women |
|---|---|---|---|
| Under 18 | 106 | 84 | 22 |
| 18-19 | 9,069 | 5,275 | 3,794 |
| 20-21 | 10,089 | 5,353 | 4,736 |
| 22-24 | 4,503 | 1,798 | 2,705 |
| 25-29 | 2,242 | 1,018 | 1,224 |
| 30-34 | 1,001 | 491 | 510 |
| 35-39 | 539 | 289 | 250 |
| 40-49 | 634 | 424 | 210 |
| 50-64 | 263 | 171 | 92 |
| Over 65 | 20 | 9 | 11 |
| Age | Total | Men | Women |
|---|---|---|---|
| Under 18 | 106 | 84 | 22 |
| 18-19 | 9,069 | 5,275 | 3,794 |
| 20-21 | 9,977 | 5,297 | 4,680 |
| 22-24 | 2,851 | 1,000 | 1,851 |
| 25-29 | 366 | 115 | 251 |
| 30-34 | 100 | 32 | 68 |
| 35-39 | 39 | 13 | 26 |
| 40-49 | 34 | 19 | 15 |
| 50-64 | 18 | 11 | 7 |
| Over 65 | 6 | 3 | 3 |
| Age | Total | Men | Women |
|---|
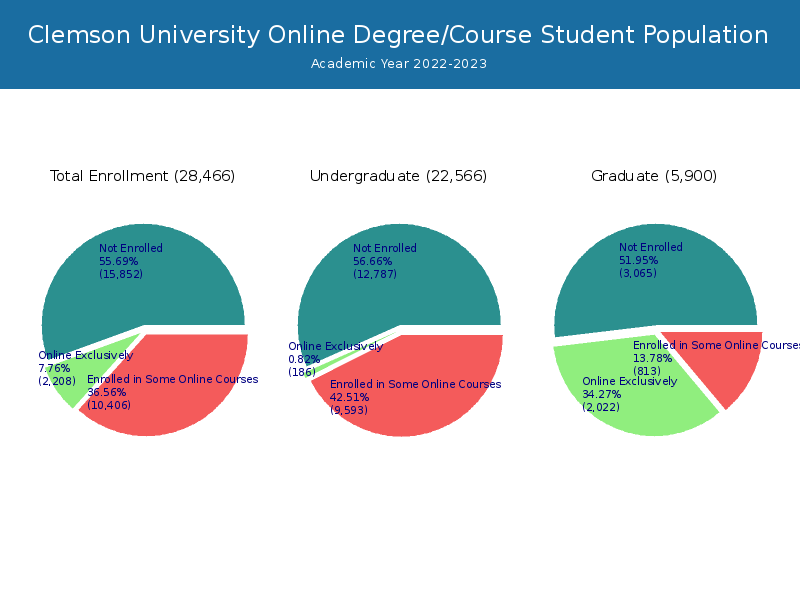
Online Student Enrollment
Distance learning, also called online education, is very attractive to students, especially who want to continue education and work in field. At Clemson University, 2,208 students are enrolled exclusively in online courses and 10,406 students are enrolled in some online courses.
1,347 students lived in South Carolina or jurisdiction in which the school is located are enrolled exclusively in online courses and 861 students live in other State or outside of the United States.
| All Students | Enrolled Exclusively Online Courses | Enrolled in Some Online Courses | |
|---|---|---|---|
| All Students | 28,466 | 2,208 | 10,406 |
| Undergraduate | 22,566 | 186 | 9,593 |
| Graduate | 5,900 | 2,022 | 813 |
| South Carolina Residents | Other States in U.S. | Outside of U.S. | |
|---|---|---|---|
| All Students | 1,347 | 861 | 0 |
| Undergraduate | 168 | 18 | 0 |
| Graduate | 1,179 | 843 | 0 |
Transfer-in Students (Undergraduate)
Among 22,566 enrolled in undergraduate programs, 1,621 students have transferred-in from other institutions. The percentage of transfer-in students is 7.18%.1,577 students have transferred in as full-time status and 44 students transferred in as part-time status.
| Number of Students | |
|---|---|
| Regular Full-time | 20,164 |
| Transfer-in Full-time | 1,577 |
| Regular Part-time | 781 |
| Transfer-in Part-time | 44 |