Student Population by Gender
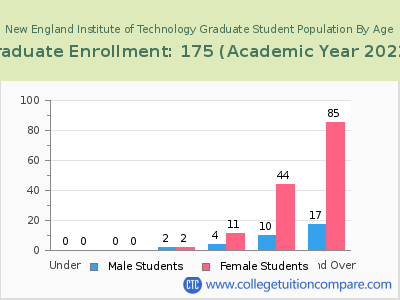
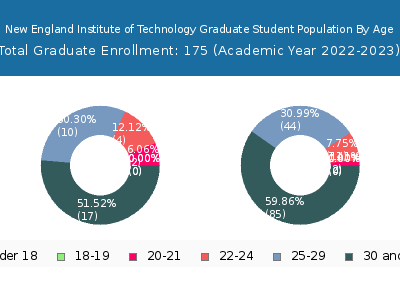
New England Institute of Technology has a total of 1,895 enrolled students for the academic year 2022-2023. 1,720 students have enrolled in undergraduate programs and 175 students joined graduate programs.
By gender, 1,087 male and 808 female students (the male-female ratio is 57:43) are attending the school. The gender distribution is based on the 2022-2023 data.
| Total | Undergraduate | Graduate | |
|---|---|---|---|
| Total | 1,895 | 1,720 | 175 |
| Men | 1,087 | 1,054 | 33 |
| Women | 808 | 666 | 142 |
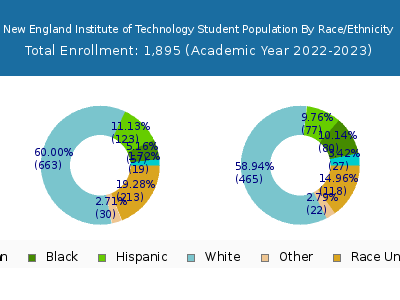
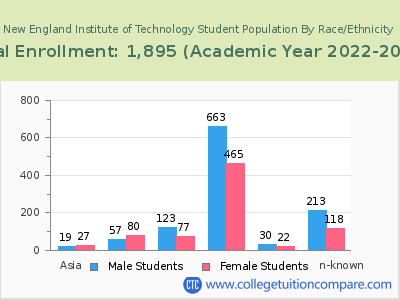
Student Distribution by Race/Ethnicity
| Race | Total | Men | Women |
|---|---|---|---|
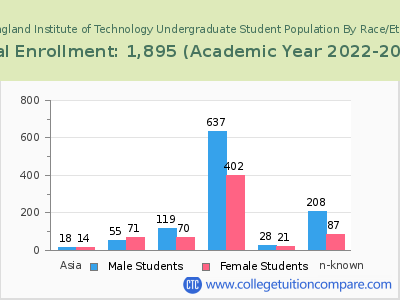
| American Indian or Native American | 8 | 3 | 5 |
| Asian | 64 | 29 | 35 |
| Black | 175 | 85 | 90 |
| Hispanic | 252 | 144 | 108 |
| Native Hawaiian or Other Pacific Islanders | 0 | 0 | 0 |
| White | 1,081 | 633 | 448 |
| Two or more races | 46 | 24 | 22 |
| Race Unknown | 253 | 158 | 95 |
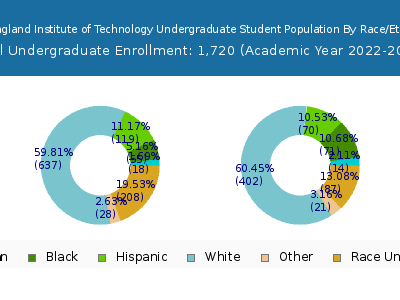
| Race | Total | Men | Women |
|---|---|---|---|
| American Indian or Native American | 8 | 3 | 5 |
| Asian | 49 | 28 | 21 |
| Black | 163 | 82 | 81 |
| Hispanic | 235 | 141 | 94 |
| Native Hawaiian or Other Pacific Islanders | 0 | 0 | 0 |
| White | 988 | 615 | 373 |
| Two or more races | 44 | 24 | 20 |
| Race Unknown | 221 | 152 | 69 |
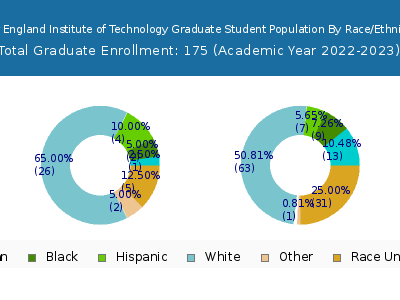
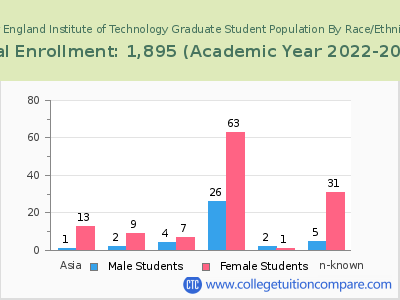
| Race | Total | Men | Women |
|---|---|---|---|
| American Indian or Native American | 0 | 0 | 0 |
| Asian | 5 | 1 | 4 |
| Black | 17 | 5 | 12 |
| Hispanic | 23 | 8 | 15 |
| Native Hawaiian or Other Pacific Islanders | 0 | 0 | 0 |
| White | 109 | 50 | 59 |
| Two or more races | 10 | 4 | 6 |
| Race Unknown | 16 | 6 | 10 |
Student Age Distribution
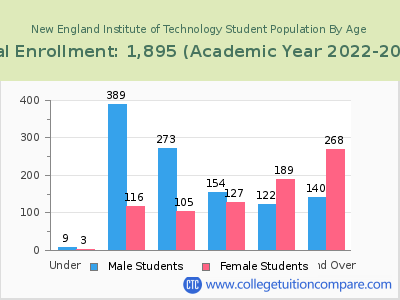
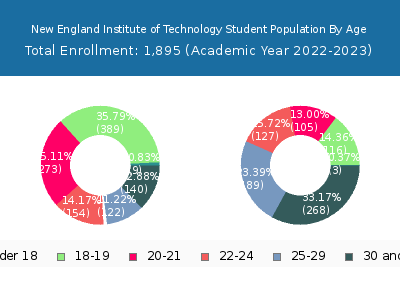
| Age | Total | Men | Women |
|---|---|---|---|
| Under 18 | 12 | 3 | 9 |
| 18-19 | 505 | 116 | 389 |
| 20-21 | 378 | 105 | 273 |
| 22-24 | 281 | 127 | 154 |
| 25-29 | 311 | 189 | 122 |
| 30-34 | 192 | 132 | 60 |
| 35-39 | 110 | 65 | 45 |
| 40-49 | 80 | 54 | 26 |
| 50-64 | 26 | 17 | 9 |
| Age | Total | Men | Women |
|---|---|---|---|
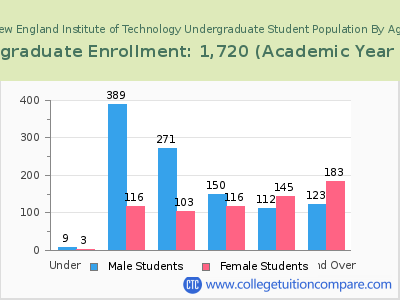
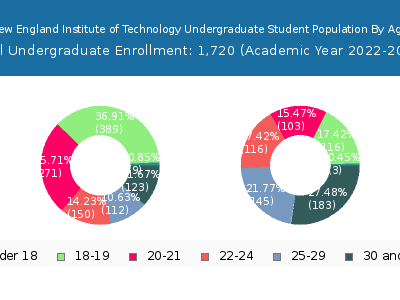
| Under 18 | 12 | 3 | 9 |
| 18-19 | 505 | 116 | 389 |
| 20-21 | 374 | 103 | 271 |
| 22-24 | 266 | 116 | 150 |
| 25-29 | 257 | 145 | 112 |
| 30-34 | 143 | 92 | 51 |
| 35-39 | 83 | 41 | 42 |
| 40-49 | 61 | 39 | 22 |
| 50-64 | 19 | 11 | 8 |
| Age | Total | Men | Women |
|---|
Online Student Enrollment
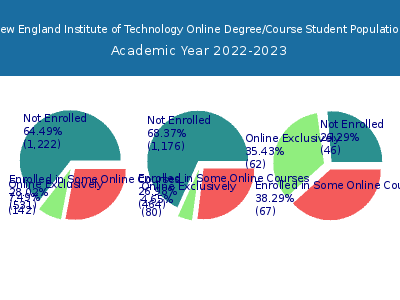
Distance learning, also called online education, is very attractive to students, especially who want to continue education and work in field. At New England Institute of Technology, 142 students are enrolled exclusively in online courses and 531 students are enrolled in some online courses.
61 students lived in Rhode Island or jurisdiction in which the school is located are enrolled exclusively in online courses and 81 students live in other State or outside of the United States.
| All Students | Enrolled Exclusively Online Courses | Enrolled in Some Online Courses | |
|---|---|---|---|
| All Students | 1,895 | 142 | 531 |
| Undergraduate | 1,720 | 80 | 464 |
| Graduate | 175 | 62 | 67 |
| Rhode Island Residents | Other States in U.S. | Outside of U.S. | |
|---|---|---|---|
| All Students | 61 | 81 | 0 |
| Undergraduate | 40 | 40 | 0 |
| Graduate | 21 | 41 | 0 |
Transfer-in Students (Undergraduate)
Among 1,720 enrolled in undergraduate programs, 183 students have transferred-in from other institutions. The percentage of transfer-in students is 10.64%.163 students have transferred in as full-time status and 20 students transferred in as part-time status.
| Number of Students | |
|---|---|
| Regular Full-time | 1,374 |
| Transfer-in Full-time | 163 |
| Regular Part-time | 163 |
| Transfer-in Part-time | 20 |
