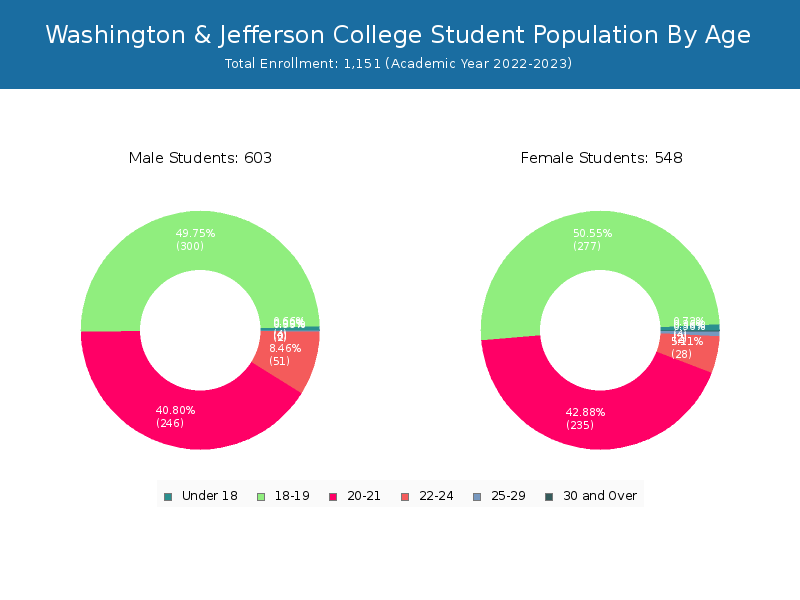
Student Population by Gender
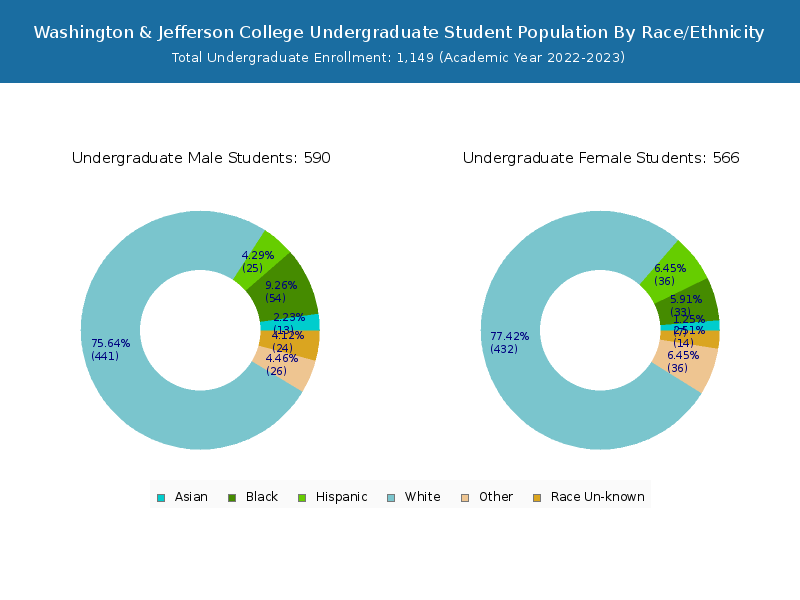
Washington & Jefferson College has a total of 1,151 enrolled students for the academic year 2022-2023. 1,149 students have enrolled in undergraduate programs and 2 students joined graduate programs.
By gender, 603 male and 548 female students (the male-female ratio is 52:48) are attending the school. The gender distribution is based on the 2022-2023 data.
| Total | Undergraduate | Graduate | |
|---|---|---|---|
| Total | 1,151 | 1,149 | 2 |
| Men | 603 | 602 | 1 |
| Women | 548 | 547 | 1 |
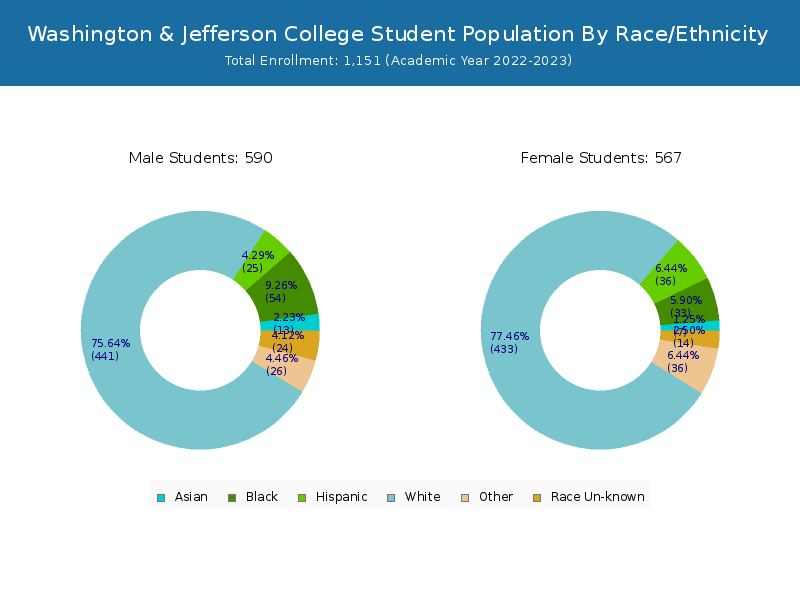

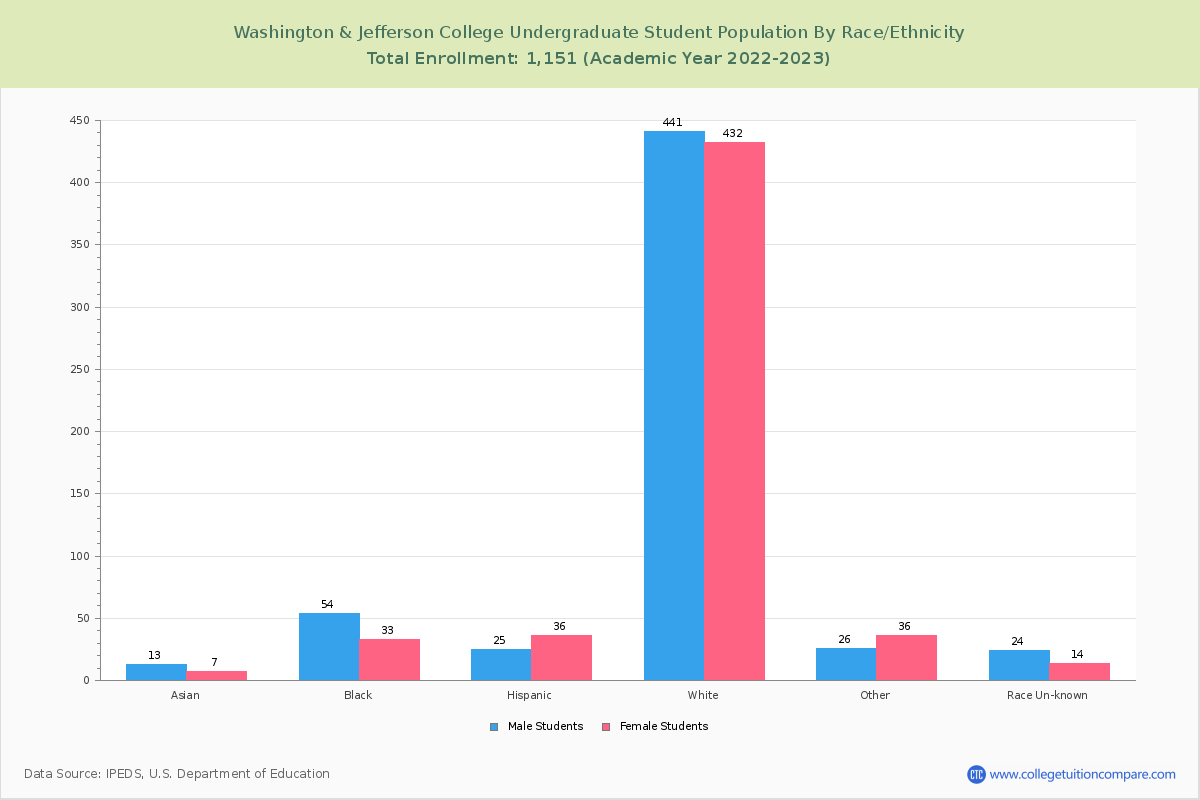
Student Distribution by Race/Ethnicity
By race/ethnicity, 875 White, 85 Black, and 19 Asian students out of a total of 1,151 are attending at Washington & Jefferson College. Comprehensive enrollment statistic data by race/ethnicity is shown in the next chart (Academic year 2022-2023 data).

| Race | Total | Men | Women |
|---|---|---|---|
| American Indian or Native American | 3 | 2 | 1 |
| Asian | 19 | 10 | 9 |
| Black | 85 | 60 | 25 |
| Hispanic | 63 | 33 | 30 |
| Native Hawaiian or Other Pacific Islanders | 1 | 0 | 1 |
| White | 875 | 452 | 423 |
| Two or more races | 69 | 30 | 39 |
| Race Unknown | 16 | 11 | 5 |
| Race | Total | Men | Women |
|---|---|---|---|
| American Indian or Native American | 3 | 2 | 1 |
| Asian | 19 | 10 | 9 |
| Black | 85 | 60 | 25 |
| Hispanic | 63 | 33 | 30 |
| Native Hawaiian or Other Pacific Islanders | 1 | 0 | 1 |
| White | 873 | 451 | 422 |
| Two or more races | 69 | 30 | 39 |
| Race Unknown | 16 | 11 | 5 |
| Race | Total | Men | Women |
|---|---|---|---|
| American Indian or Native American | 0 | 0 | 0 |
| Asian | 0 | 0 | 0 |
| Black | 4 | 3 | 1 |
| Hispanic | 1 | 0 | 1 |
| Native Hawaiian or Other Pacific Islanders | 0 | 0 | 0 |
| White | 17 | 12 | 5 |
| Two or more races | 1 | 1 | 0 |
| Race Unknown | 0 | 0 | 0 |
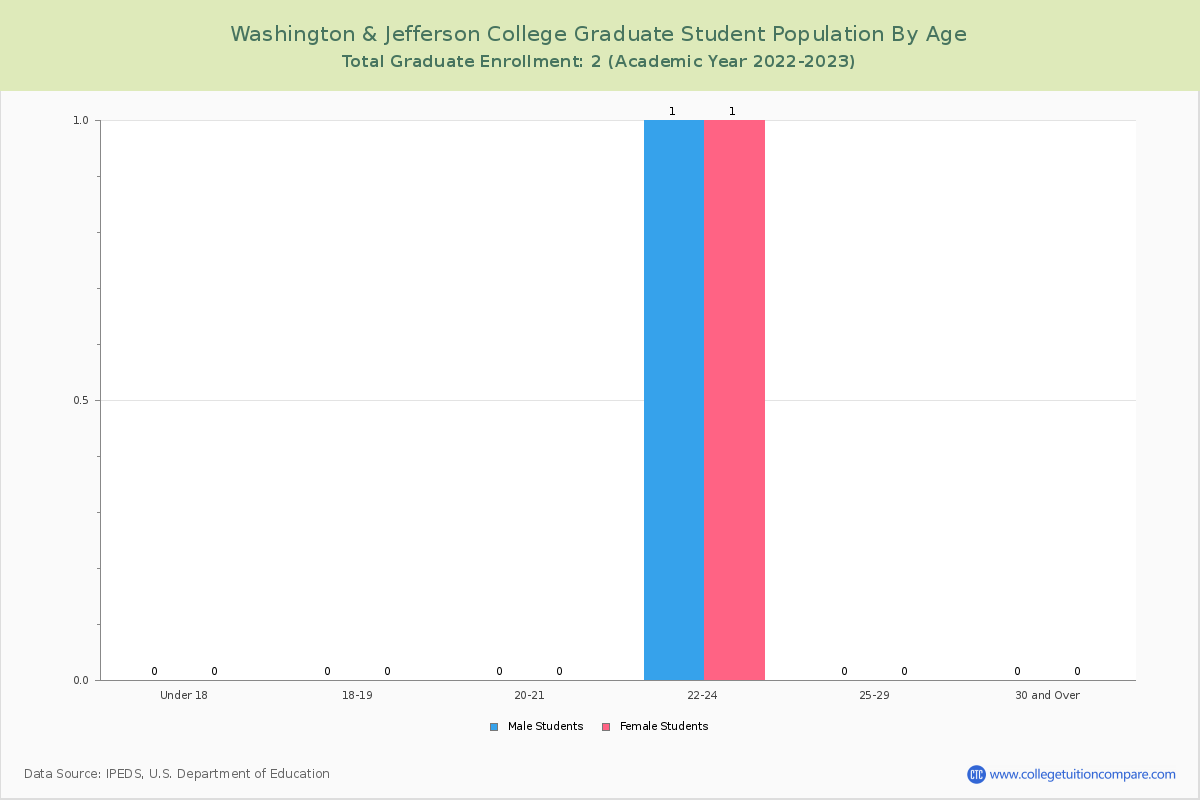
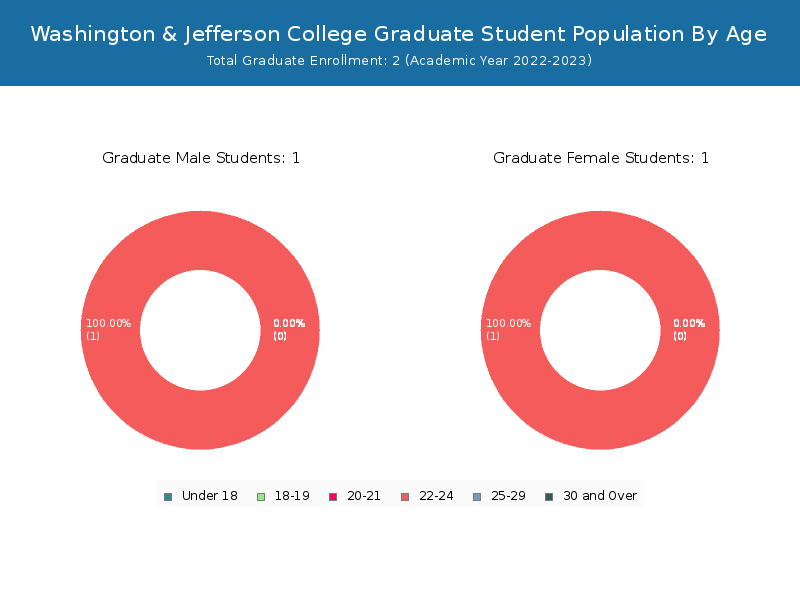
Student Age Distribution
There are 1,145 students under 25 years old, and 6 students over 25 years old out of 1,151 total students.
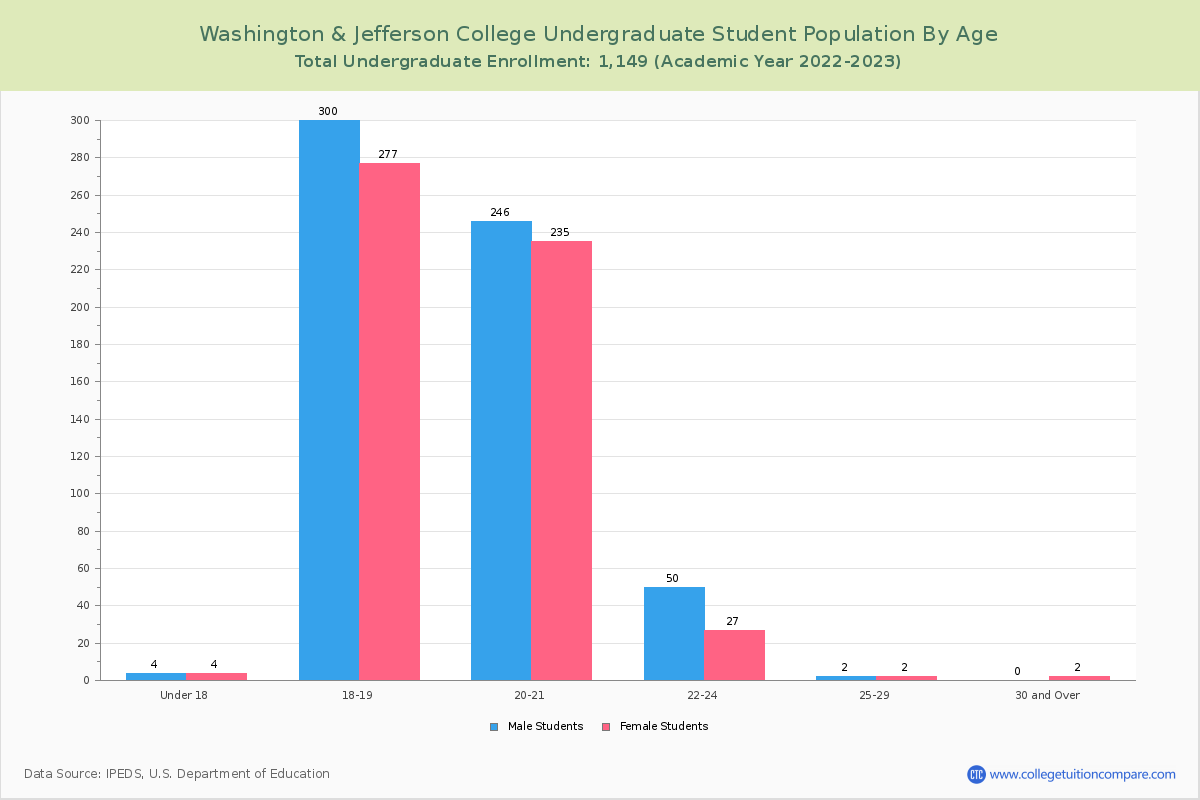
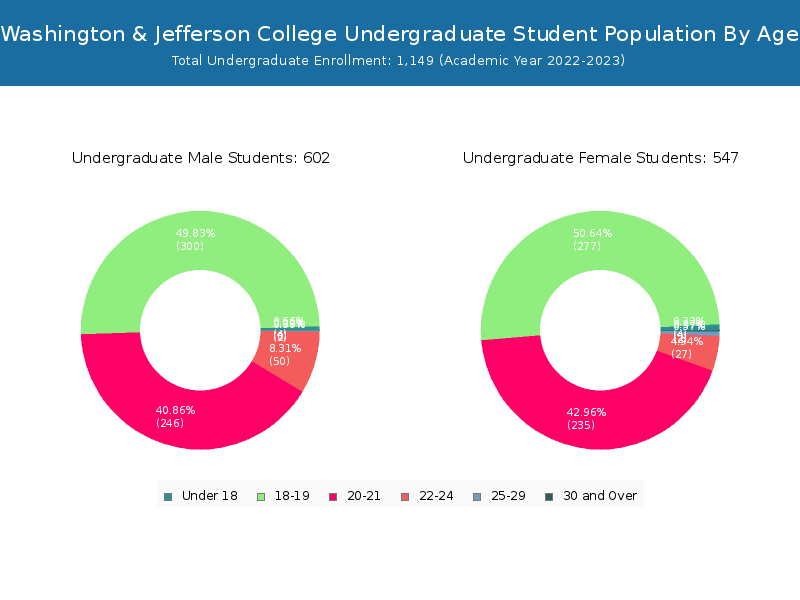
W&J has 1,143 undergraduate students aged under 25 and 6 students aged 25 and over.
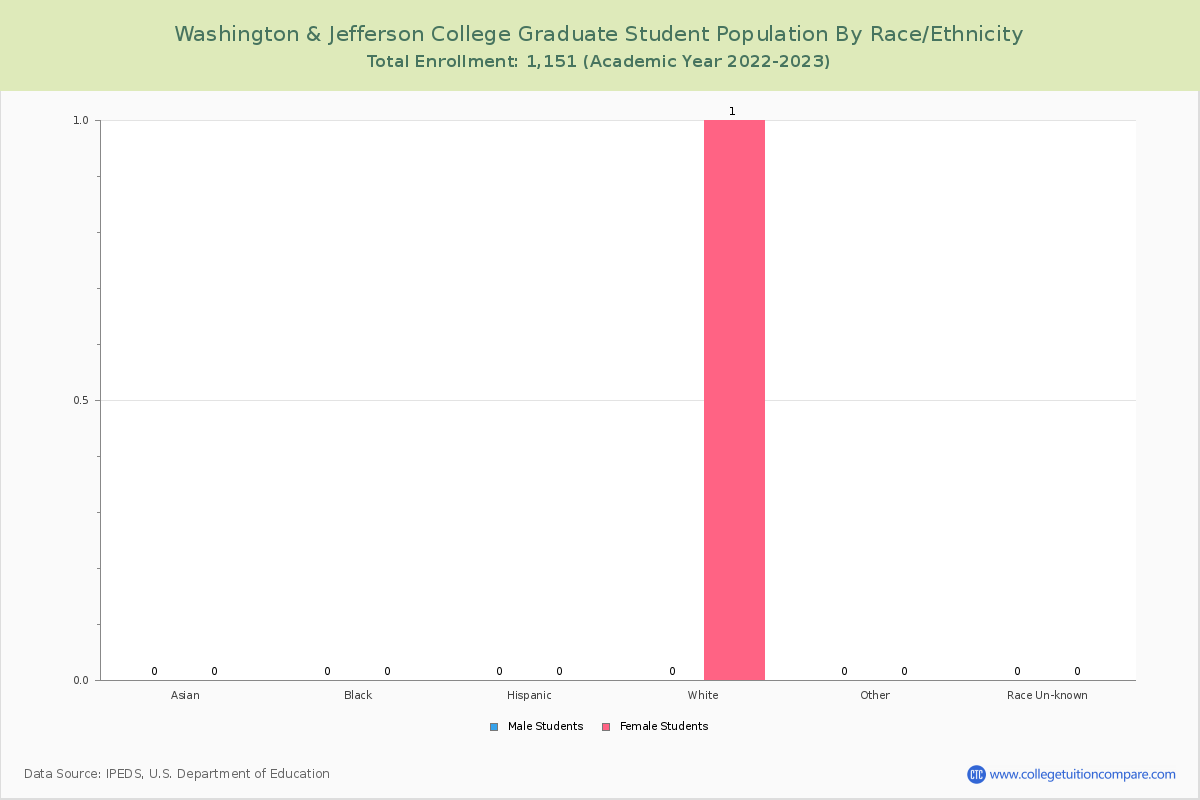
All graduate students at W&J is aged under 25.
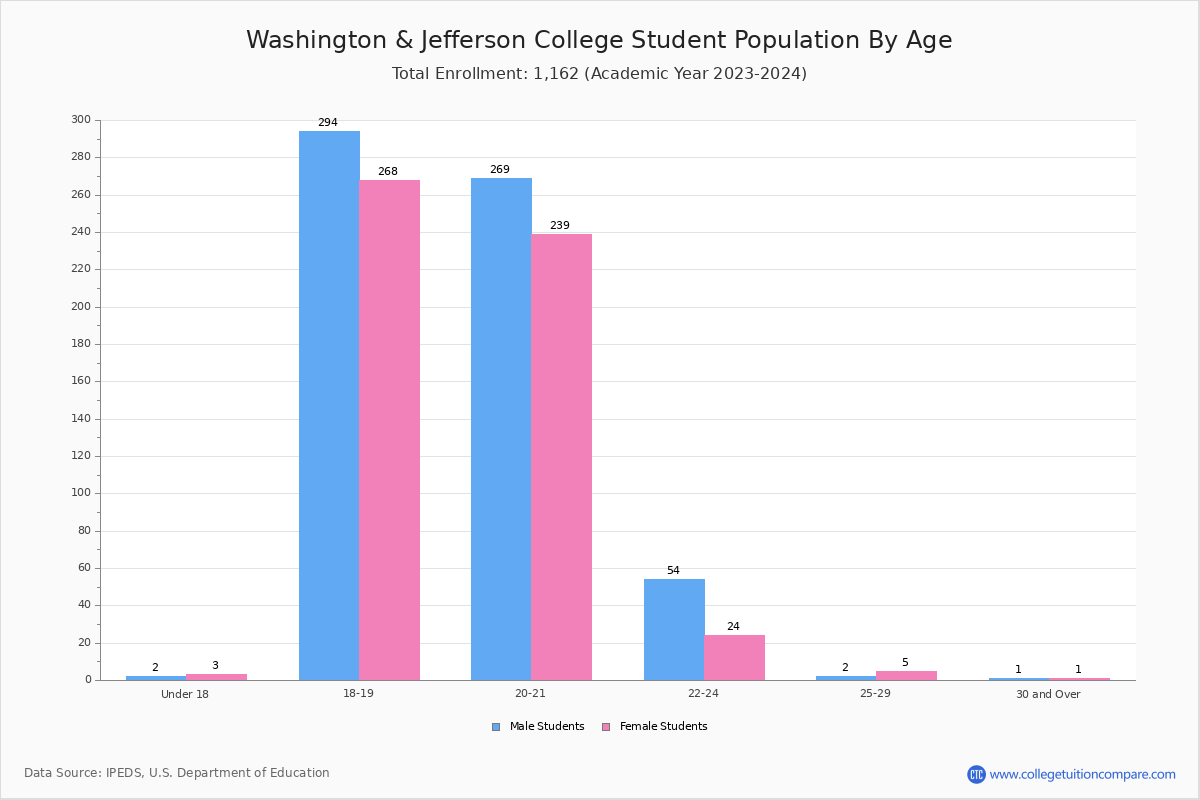
| Age | Total | Men | Women |
|---|---|---|---|
| Under 18 | 8 | 4 | 4 |
| 18-19 | 577 | 277 | 300 |
| 20-21 | 481 | 235 | 246 |
| 22-24 | 79 | 28 | 51 |
| 25-29 | 4 | 2 | 2 |
| 30-34 | 1 | 1 | 0 |
| Age | Total | Men | Women |
|---|---|---|---|
| Under 18 | 8 | 4 | 4 |
| 18-19 | 577 | 277 | 300 |
| 20-21 | 481 | 235 | 246 |
| 22-24 | 77 | 27 | 50 |
| 25-29 | 4 | 2 | 2 |
| 30-34 | 1 | 1 | 0 |
| Age | Total | Men | Women |
|---|
Transfer-in Students (Undergraduate)
Among 1,149 enrolled in undergraduate programs, 24 students have transferred-in from other institutions. The percentage of transfer-in students is 2.09%.
| Number of Students | |
|---|---|
| Regular Full-time | 1,114 |
| Transfer-in Full-time | 24 |