Student Population by Gender
Ursinus College has a total of 1,527 enrolled students for the academic year 2022-2023. All 1,527 students are enrolled into undergraduate programs.
By gender, 793 male and 734 female students (the male-female ratio is 52:48) are attending the school. The gender distribution is based on the 2022-2023 data.
| Undergraduate | |
|---|---|
| Total | 1,527 |
| Men | 793 |
| Women | 734 |
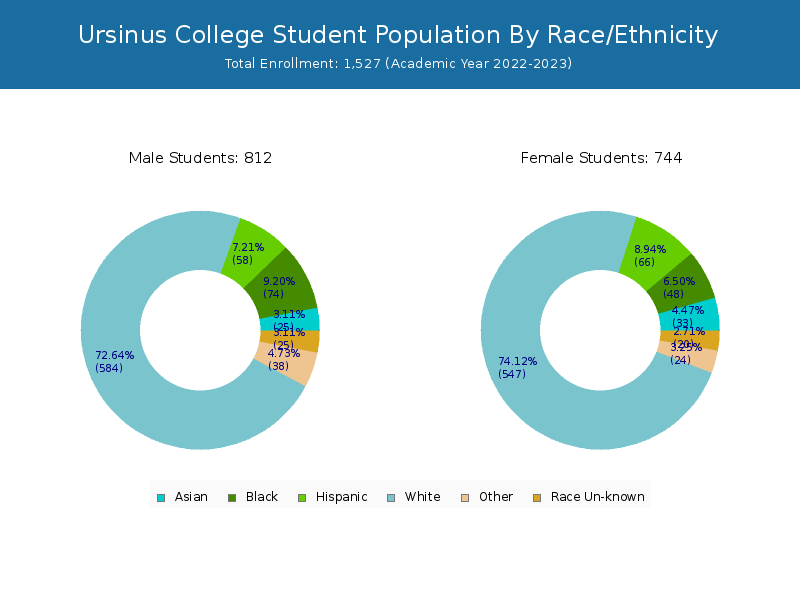
Student Distribution by Race/Ethnicity
By race/ethnicity, 1,140 White, 108 Black, and 54 Asian students out of a total of 1,527 are attending at Ursinus College. Comprehensive enrollment statistic data by race/ethnicity is shown in the next chart (Academic year 2022-2023 data).
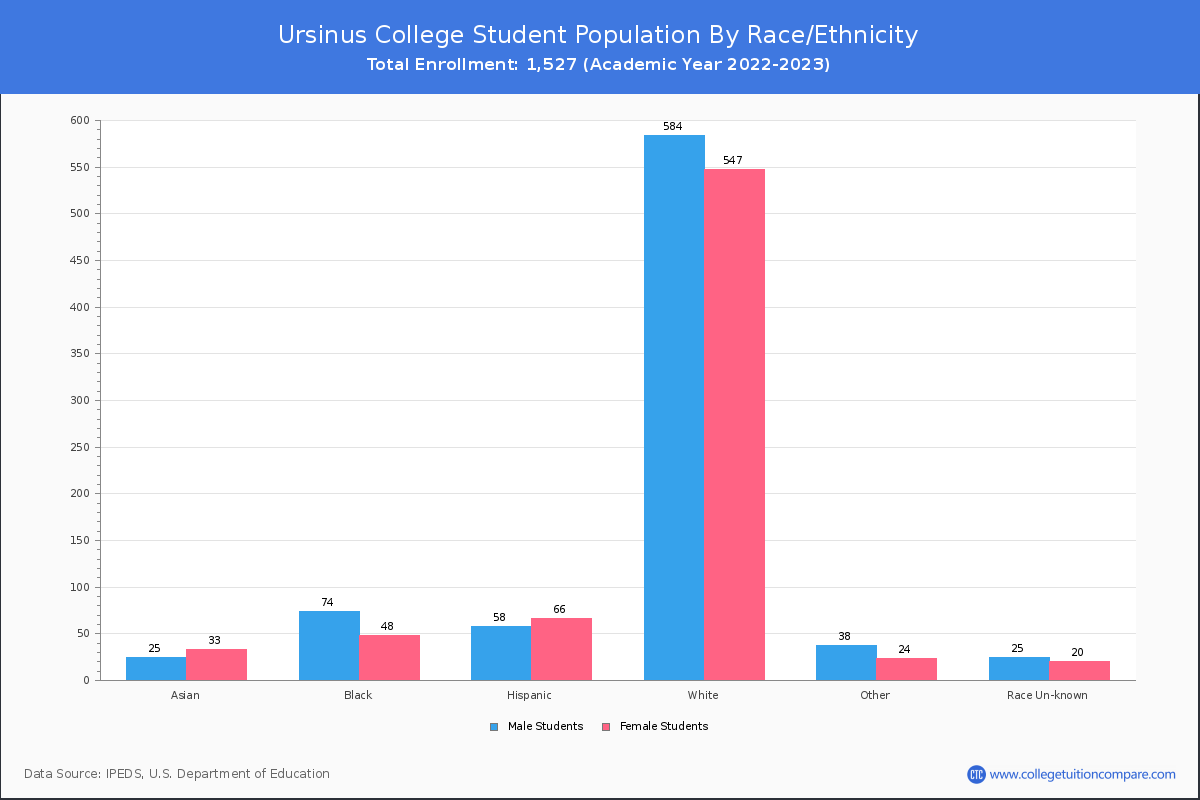
| Race | Total | Men | Women |
|---|---|---|---|
| American Indian or Native American | 3 | 2 | 1 |
| Asian | 54 | 25 | 29 |
| Black | 108 | 67 | 41 |
| Hispanic | 107 | 47 | 60 |
| Native Hawaiian or Other Pacific Islanders | 0 | 0 | 0 |
| White | 1,140 | 586 | 554 |
| Two or more races | 65 | 39 | 26 |
| Race Unknown | 40 | 20 | 20 |
Student Age Distribution
There are 1,515 students under 25 years old, and 12 students over 25 years old out of 1,527 total students.
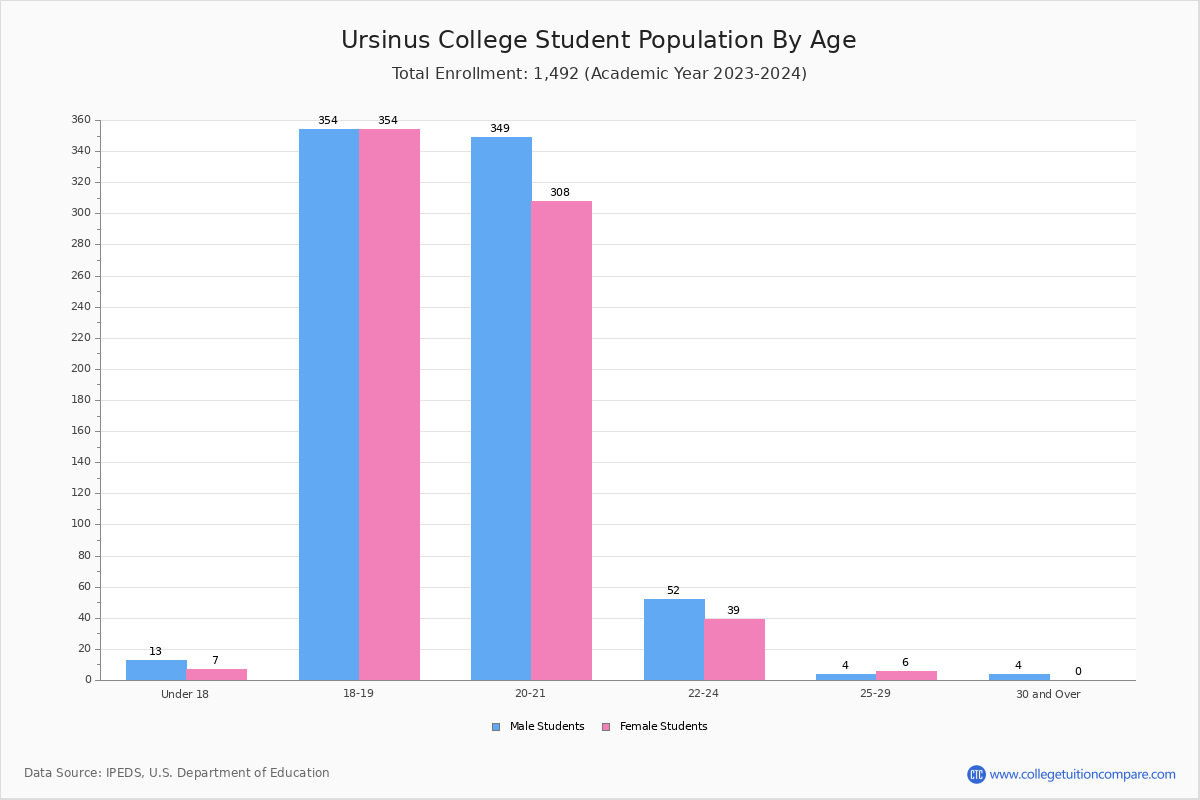
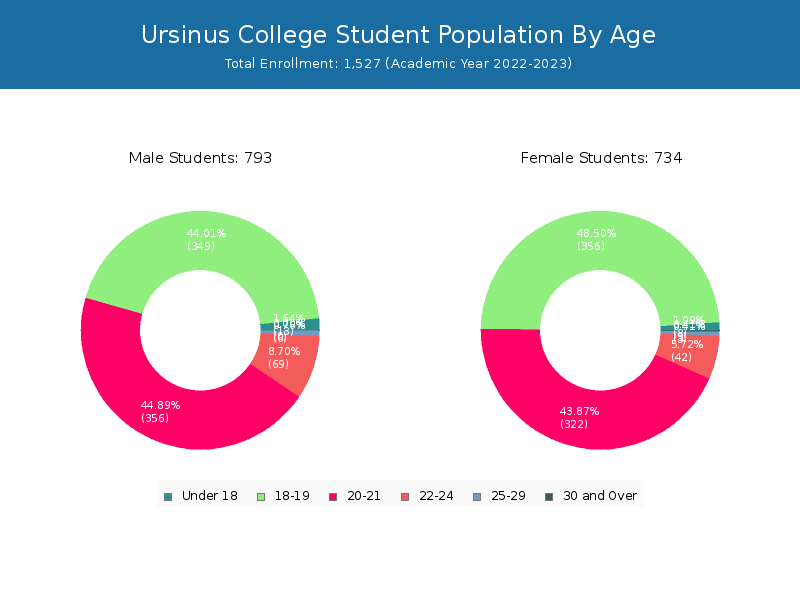
| Age | Total | Men | Women |
|---|---|---|---|
| Under 18 | 21 | 8 | 13 |
| 18-19 | 705 | 356 | 349 |
| 20-21 | 678 | 322 | 356 |
| 22-24 | 111 | 42 | 69 |
| 25-29 | 9 | 3 | 6 |
| 30-34 | 1 | 1 | 0 |
| 35-39 | 1 | 1 | 0 |
Transfer-in Students (Undergraduate)
Among 1,527 enrolled in undergraduate programs, 26 students have transferred-in from other institutions. The percentage of transfer-in students is 1.70%.
| Number of Students | |
|---|---|
| Regular Full-time | 1,476 |
| Transfer-in Full-time | 26 |