Student Population by Gender
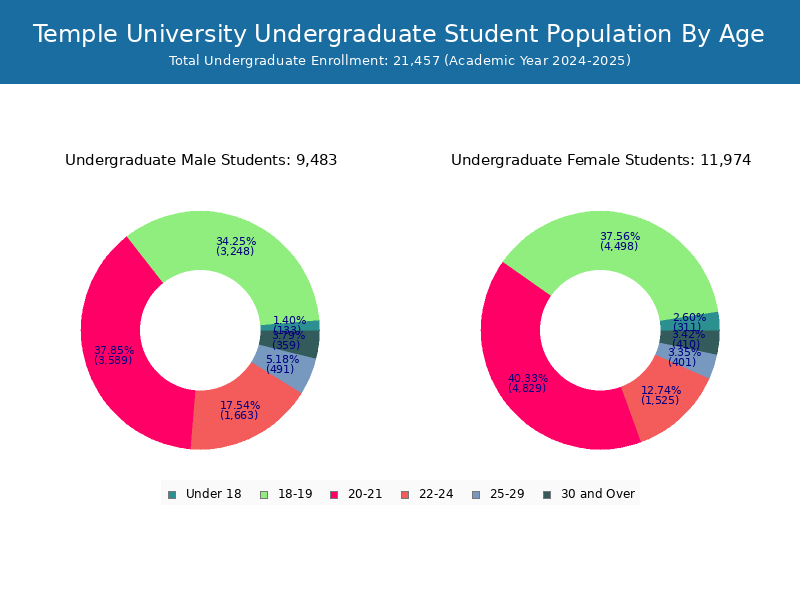
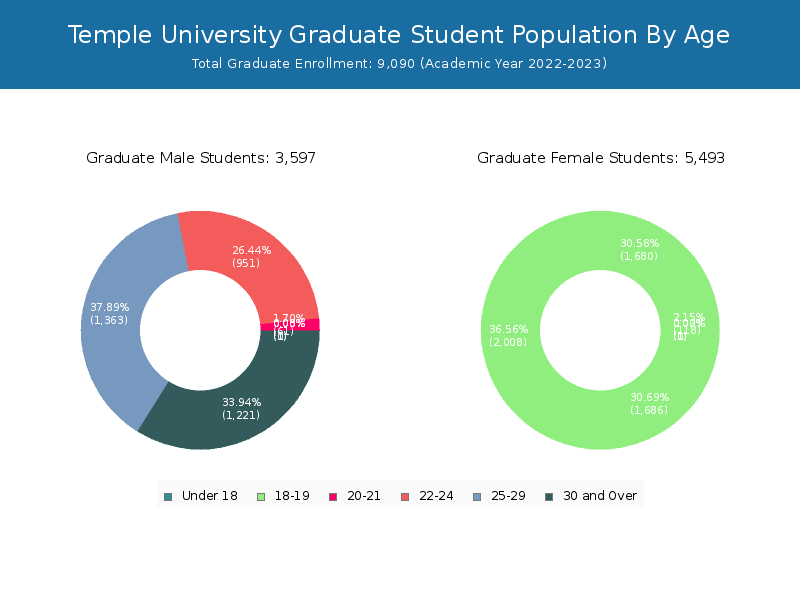
Temple University has a total of 33,196 enrolled students for the academic year 2022-2023. 24,106 students have enrolled in undergraduate programs and 9,090 students joined graduate programs.
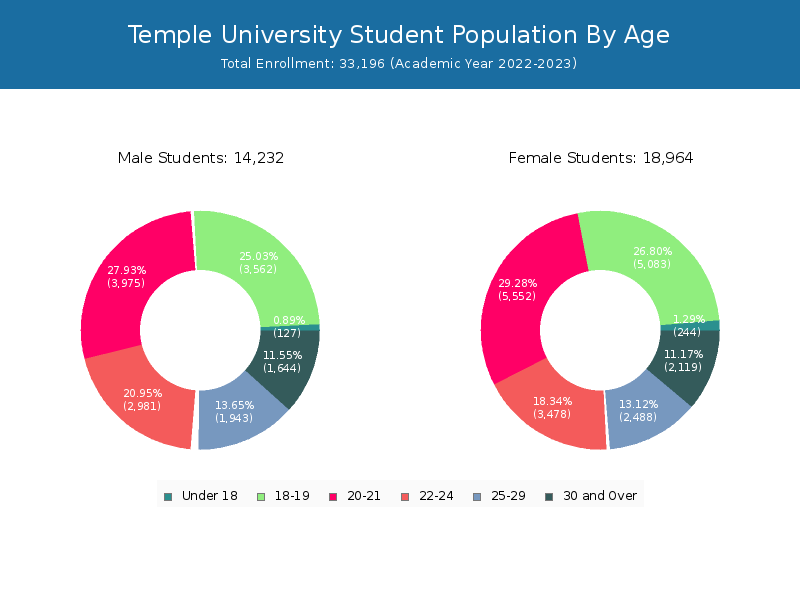
By gender, 14,232 male and 18,964 female students (the male-female ratio is 43:57) are attending the school. The gender distribution is based on the 2022-2023 data.
| Total | Undergraduate | Graduate | |
|---|---|---|---|
| Total | 33,196 | 24,106 | 9,090 |
| Men | 14,232 | 10,635 | 3,597 |
| Women | 18,964 | 13,471 | 5,493 |
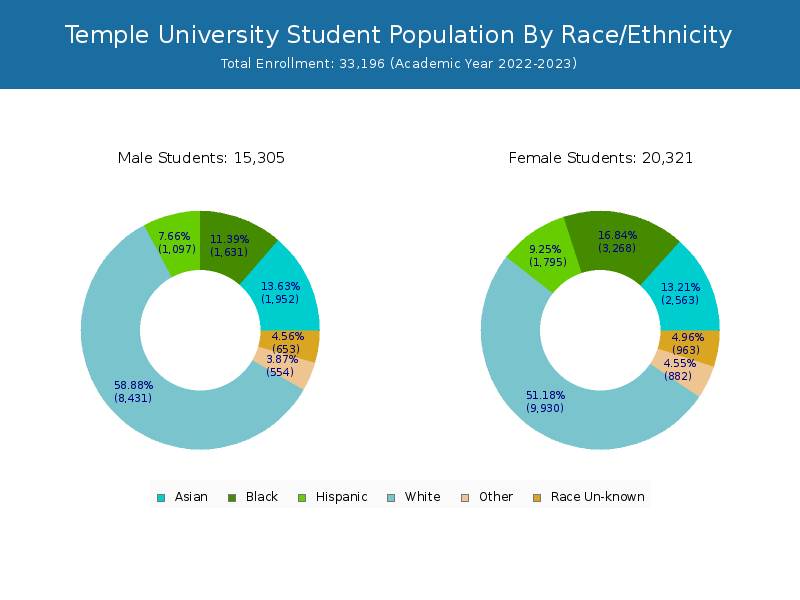
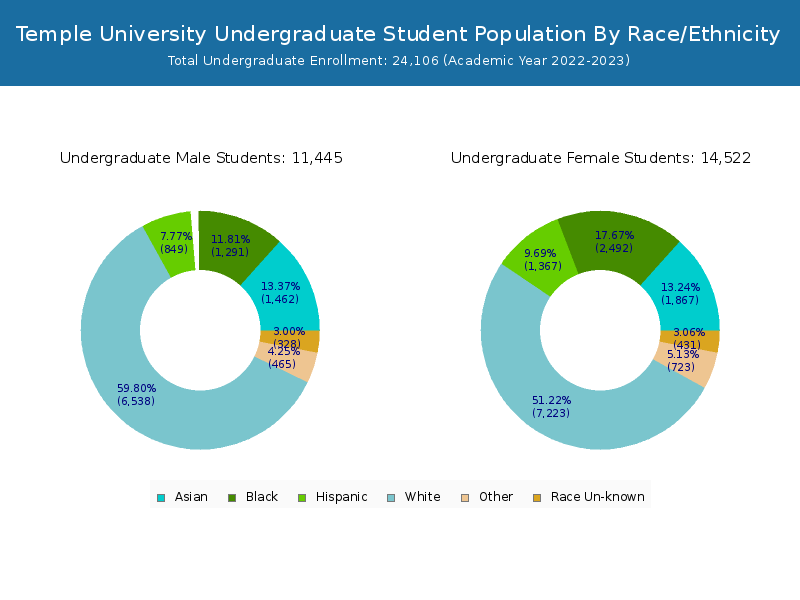
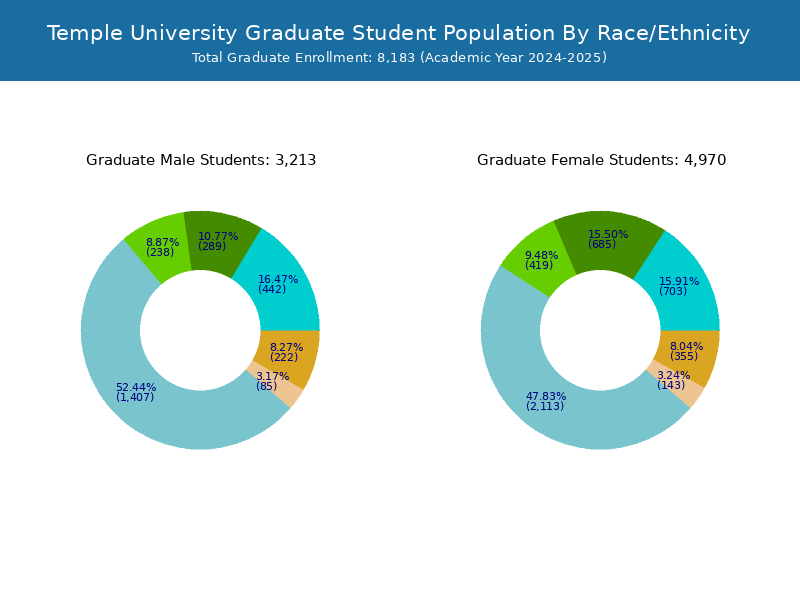
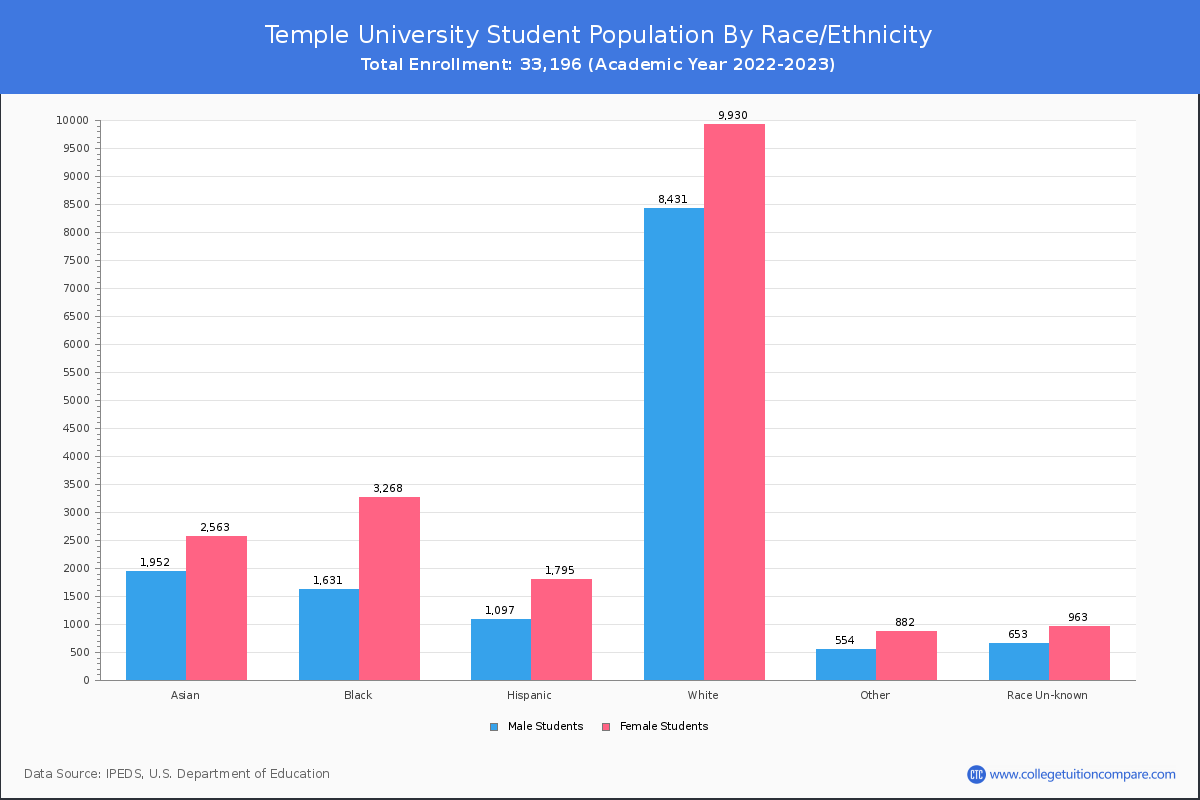
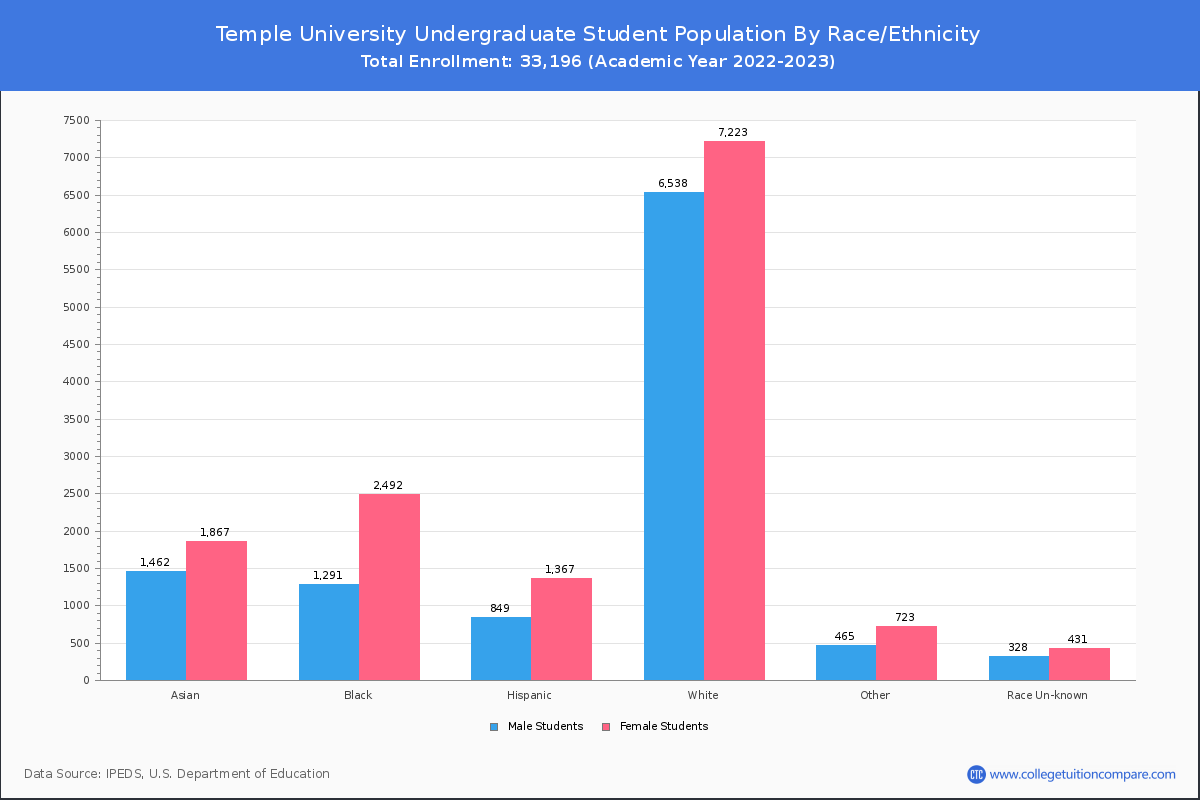
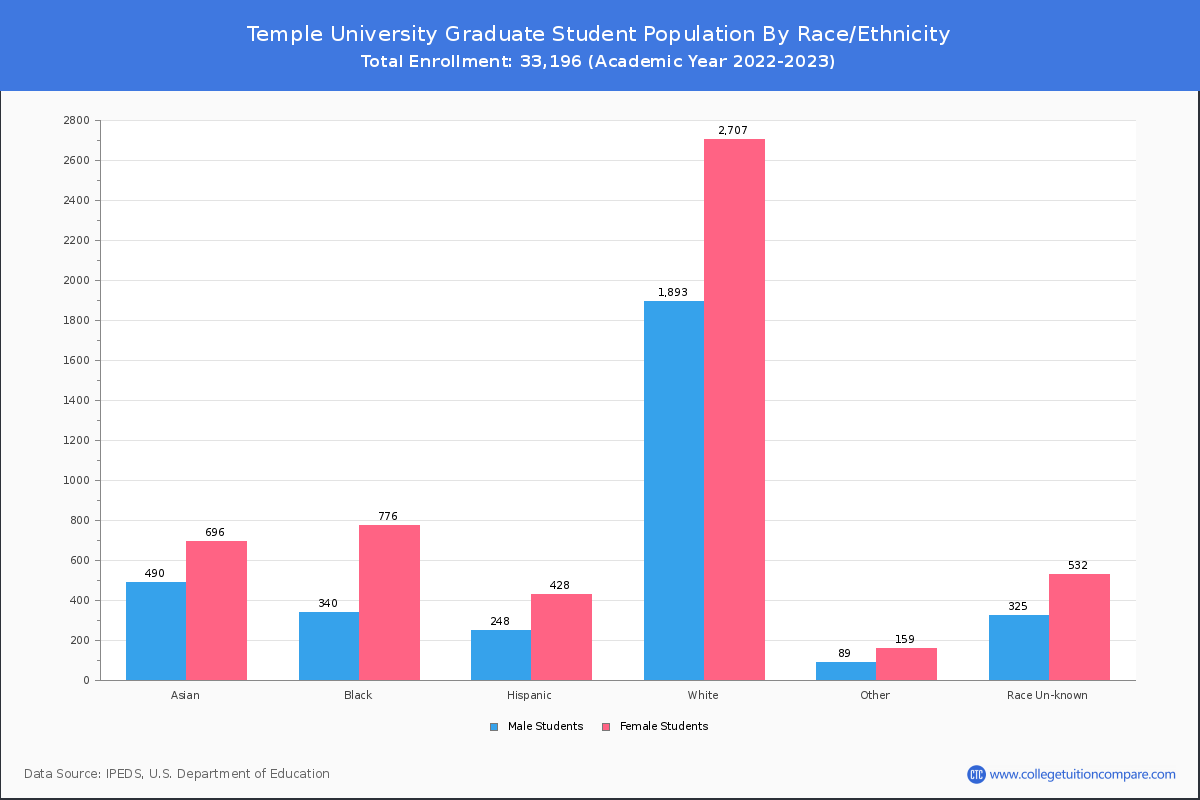
Student Distribution by Race/Ethnicity
By race/ethnicity, 16,107 White, 4,879 Black, and 4,477 Asian students out of a total of 33,196 are attending at Temple University. Comprehensive enrollment statistic data by race/ethnicity is shown in the next chart (Academic year 2022-2023 data).
| Race | Total | Men | Women |
|---|---|---|---|
| American Indian or Native American | 44 | 17 | 27 |
| Asian | 4,477 | 1,924 | 2,553 |
| Black | 4,879 | 1,691 | 3,188 |
| Hispanic | 2,900 | 1,124 | 1,776 |
| Native Hawaiian or Other Pacific Islanders | 19 | 6 | 13 |
| White | 16,107 | 7,385 | 8,722 |
| Two or more races | 1,251 | 470 | 781 |
| Race Unknown | 1,593 | 651 | 942 |
| Race | Total | Men | Women |
|---|---|---|---|
| American Indian or Native American | 37 | 14 | 23 |
| Asian | 3,353 | 1,476 | 1,877 |
| Black | 3,824 | 1,354 | 2,470 |
| Hispanic | 2,203 | 872 | 1,331 |
| Native Hawaiian or Other Pacific Islanders | 15 | 6 | 9 |
| White | 11,951 | 5,731 | 6,220 |
| Two or more races | 1,038 | 394 | 644 |
| Race Unknown | 827 | 343 | 484 |
| Race | Total | Men | Women |
|---|---|---|---|
| American Indian or Native American | 1 | 0 | 1 |
| Asian | 168 | 73 | 95 |
| Black | 228 | 90 | 138 |
| Hispanic | 134 | 65 | 69 |
| Native Hawaiian or Other Pacific Islanders | 1 | 0 | 1 |
| White | 553 | 304 | 249 |
| Two or more races | 43 | 19 | 24 |
| Race Unknown | 58 | 27 | 31 |
Student Age Distribution
By age, Temple has 371 students under 18 years old and 37 students over 65 years old. There are 25,002 students under 25 years old, and 8,194 students over 25 years old out of 33,196 total students.
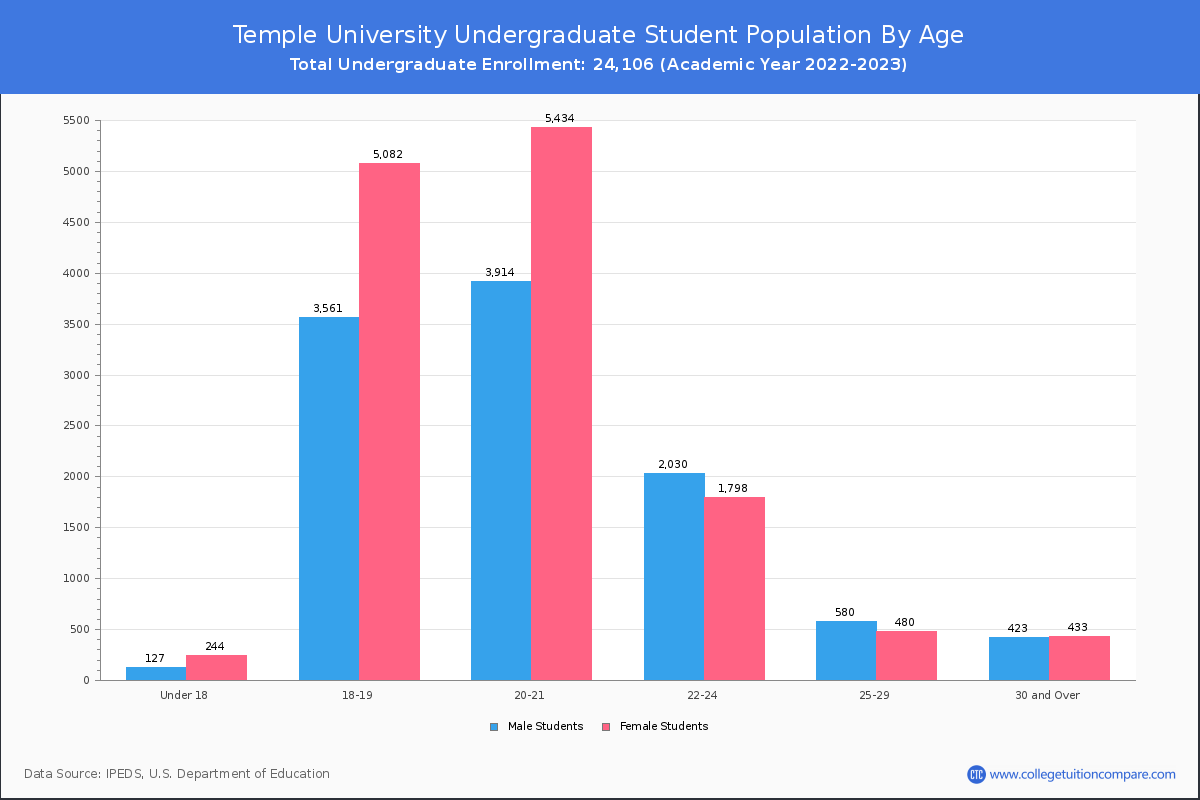
In undergraduate programs, 371 students are younger than 18 and 11 students are older than 65. Temple has 22,190 undergraduate students aged under 25 and 1,916 students aged 25 and over.
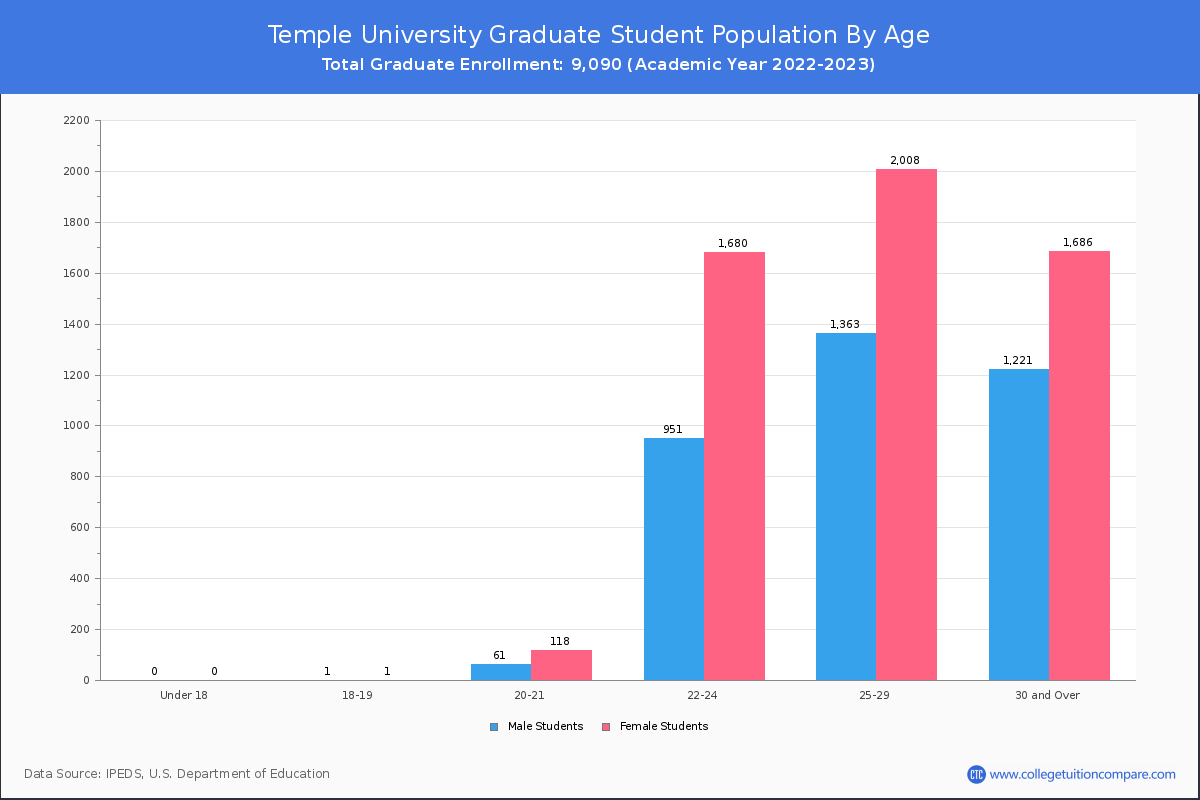
It has 2,812 graduate students aged under 25 and 6,278 students aged 25 and over.
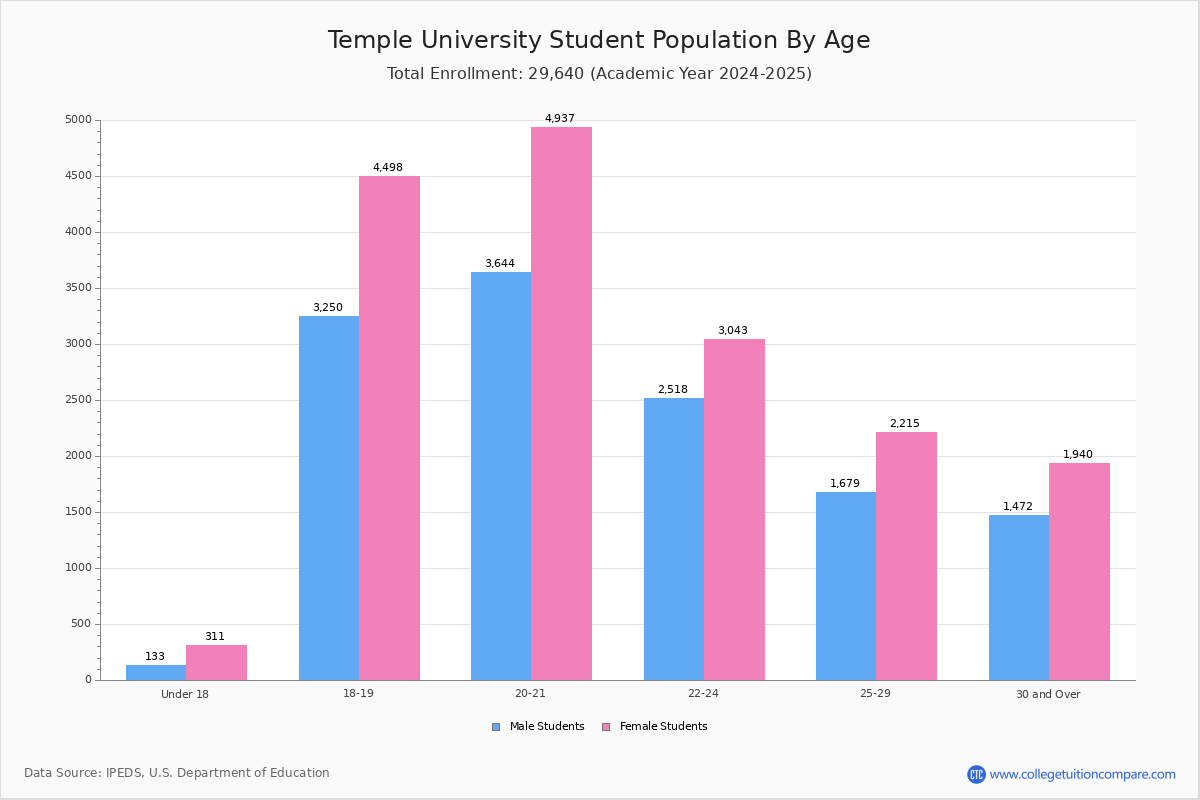
| Age | Total | Men | Women |
|---|---|---|---|
| Under 18 | 371 | 244 | 127 |
| 18-19 | 8,645 | 5,083 | 3,562 |
| 20-21 | 9,527 | 5,552 | 3,975 |
| 22-24 | 6,459 | 3,478 | 2,981 |
| 25-29 | 4,431 | 2,488 | 1,943 |
| 30-34 | 1,721 | 915 | 806 |
| 35-39 | 789 | 442 | 347 |
| 40-49 | 815 | 484 | 331 |
| 50-64 | 401 | 257 | 144 |
| Over 65 | 37 | 21 | 16 |
| Age | Total | Men | Women |
|---|---|---|---|
| Under 18 | 371 | 244 | 127 |
| 18-19 | 8,643 | 5,082 | 3,561 |
| 20-21 | 9,348 | 5,434 | 3,914 |
| 22-24 | 3,828 | 1,798 | 2,030 |
| 25-29 | 1,060 | 480 | 580 |
| 30-34 | 391 | 175 | 216 |
| 35-39 | 161 | 81 | 80 |
| 40-49 | 169 | 94 | 75 |
| 50-64 | 124 | 77 | 47 |
| Over 65 | 11 | 6 | 5 |
| Age | Total | Men | Women |
|---|
Online Student Enrollment
Distance learning, also called online education, is very attractive to students, especially who want to continue education and work in field. At Temple University, 2,612 students are enrolled exclusively in online courses and 13,509 students are enrolled in some online courses.
1,980 students lived in Pennsylvania or jurisdiction in which the school is located are enrolled exclusively in online courses and 632 students live in other State or outside of the United States.
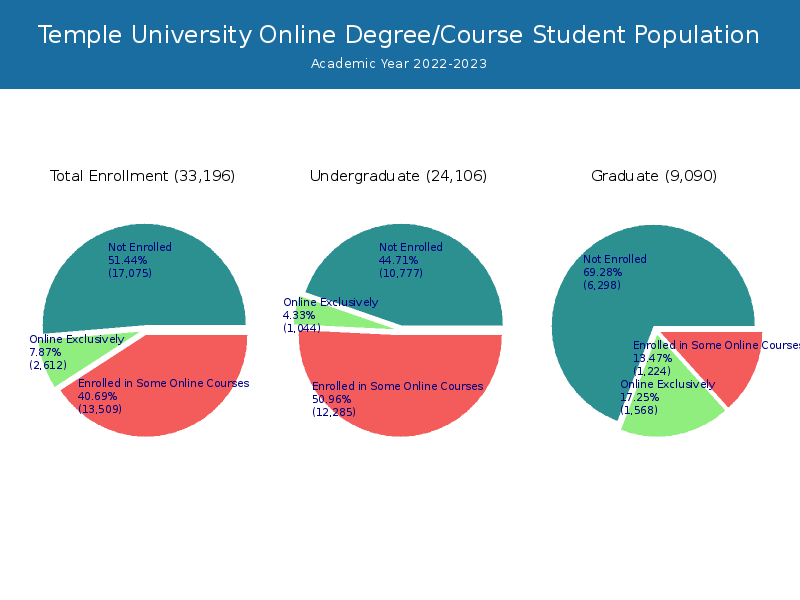
| All Students | Enrolled Exclusively Online Courses | Enrolled in Some Online Courses | |
|---|---|---|---|
| All Students | 33,196 | 2,612 | 13,509 |
| Undergraduate | 24,106 | 1,044 | 12,285 |
| Graduate | 9,090 | 1,568 | 1,224 |
| Pennsylvania Residents | Other States in U.S. | Outside of U.S. | |
|---|---|---|---|
| All Students | 1,980 | 599 | 33 |
| Undergraduate | 896 | 133 | 15 |
| Graduate | 1,084 | 466 | 18 |
Transfer-in Students (Undergraduate)
Among 24,106 enrolled in undergraduate programs, 1,230 students have transferred-in from other institutions. The percentage of transfer-in students is 5.10%.1,134 students have transferred in as full-time status and 96 students transferred in as part-time status.
| Number of Students | |
|---|---|
| Regular Full-time | 20,892 |
| Transfer-in Full-time | 1,134 |
| Regular Part-time | 1,984 |
| Transfer-in Part-time | 96 |