Student Population by Gender
University of Pittsburgh-Greensburg has a total of 1,328 enrolled students for the academic year 2022-2023. All 1,328 students are enrolled into undergraduate programs.
By gender, 556 male and 772 female students (the male-female ratio is 42:58) are attending the school. The gender distribution is based on the 2022-2023 data.
| Undergraduate | |
|---|---|
| Total | 1,328 |
| Men | 556 |
| Women | 772 |
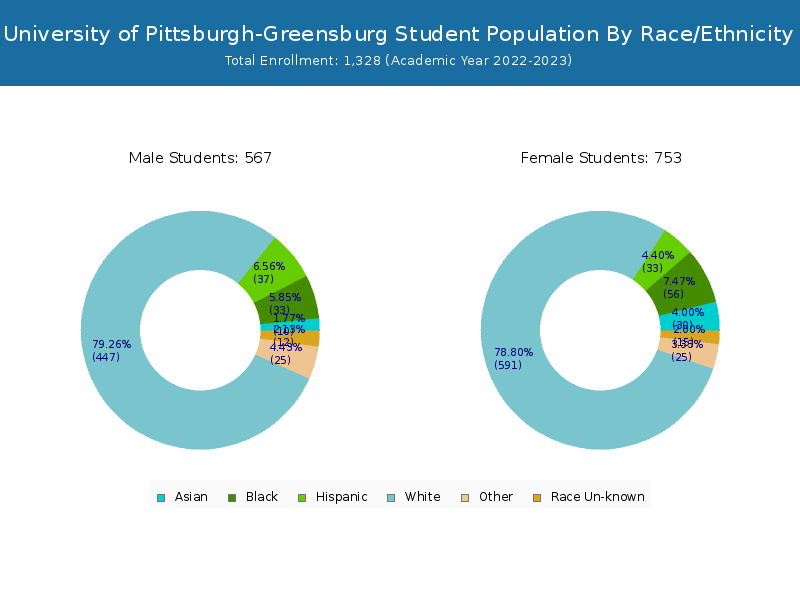
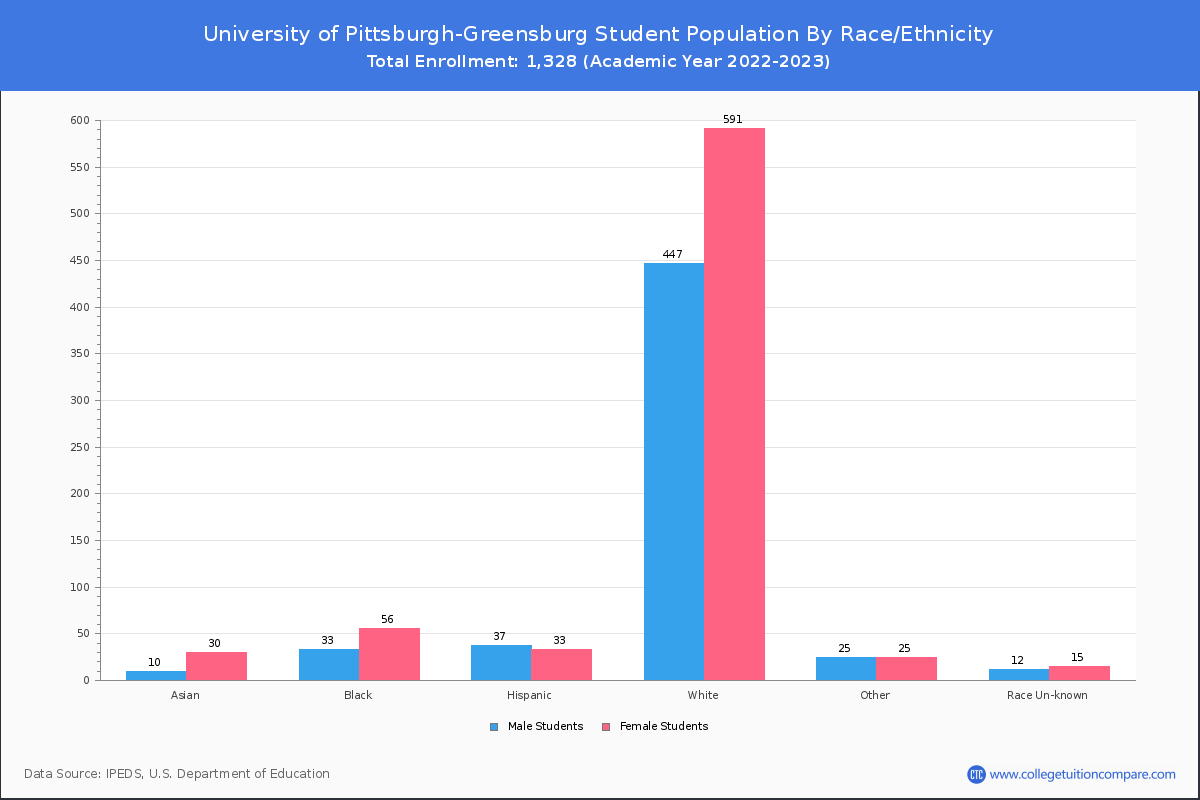
Student Distribution by Race/Ethnicity
By race/ethnicity, 1,011 White, 97 Black, and 56 Asian students out of a total of 1,328 are attending at University of Pittsburgh-Greensburg. Comprehensive enrollment statistic data by race/ethnicity is shown in the next chart (Academic year 2022-2023 data).
| Race | Total | Men | Women |
|---|---|---|---|
| American Indian or Native American | 0 | 0 | 0 |
| Asian | 56 | 25 | 31 |
| Black | 97 | 43 | 54 |
| Hispanic | 66 | 28 | 38 |
| Native Hawaiian or Other Pacific Islanders | 1 | 0 | 1 |
| White | 1,011 | 414 | 597 |
| Two or more races | 51 | 21 | 30 |
| Race Unknown | 30 | 15 | 15 |
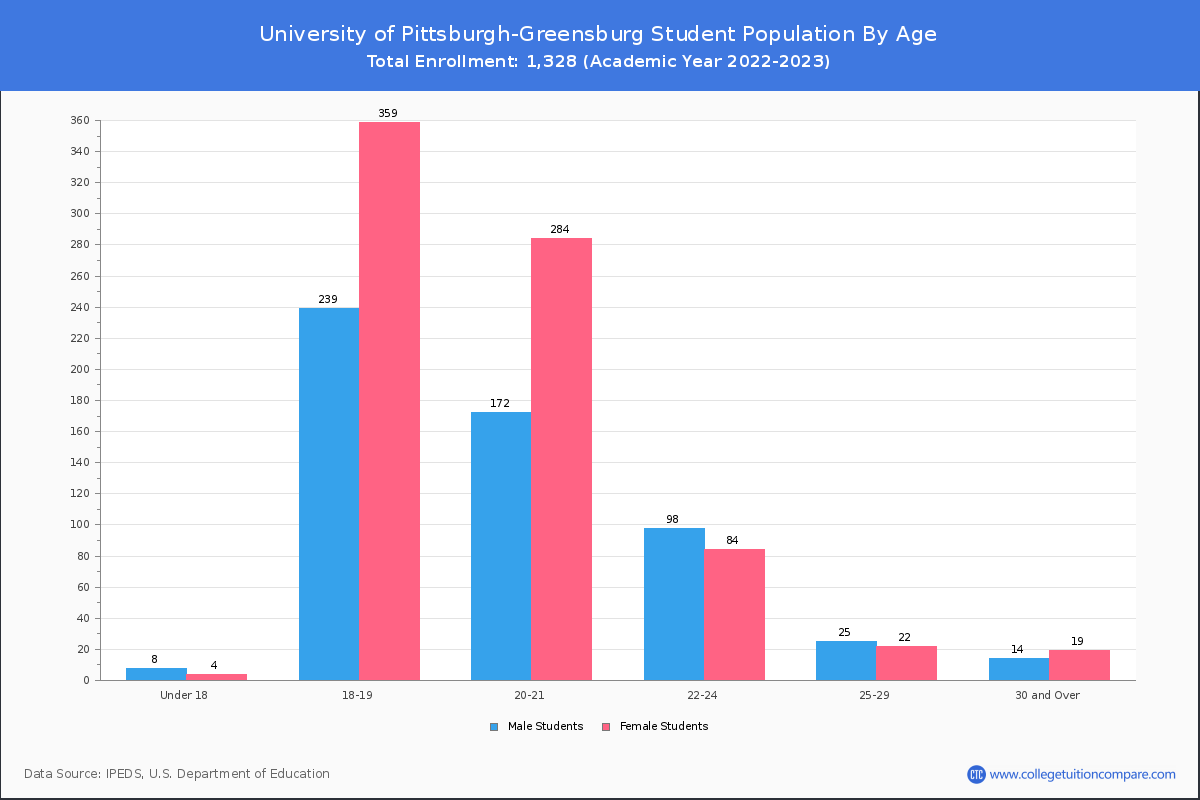
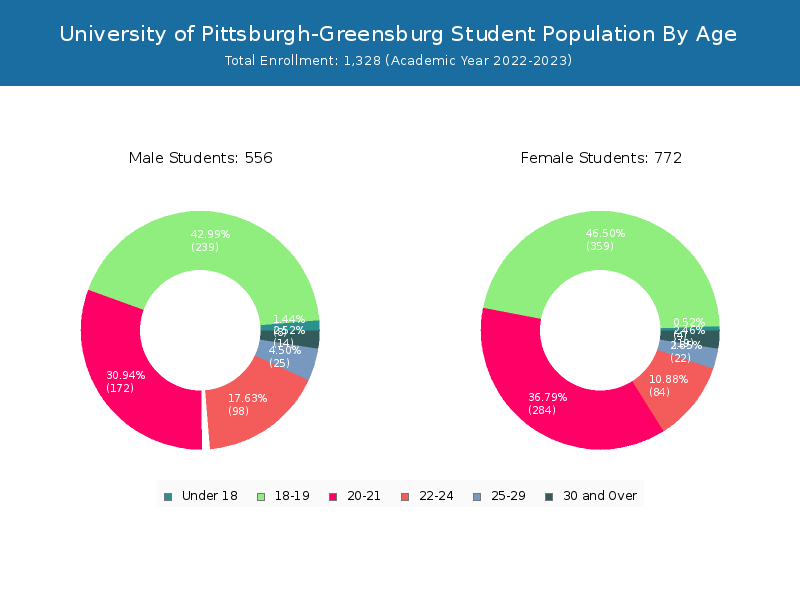
Student Age Distribution
There are 1,248 students under 25 years old, and 80 students over 25 years old out of 1,328 total students.
| Age | Total | Men | Women |
|---|---|---|---|
| Under 18 | 12 | 4 | 8 |
| 18-19 | 598 | 359 | 239 |
| 20-21 | 456 | 284 | 172 |
| 22-24 | 182 | 84 | 98 |
| 25-29 | 47 | 22 | 25 |
| 30-34 | 16 | 11 | 5 |
| 35-39 | 5 | 2 | 3 |
| 40-49 | 12 | 6 | 6 |
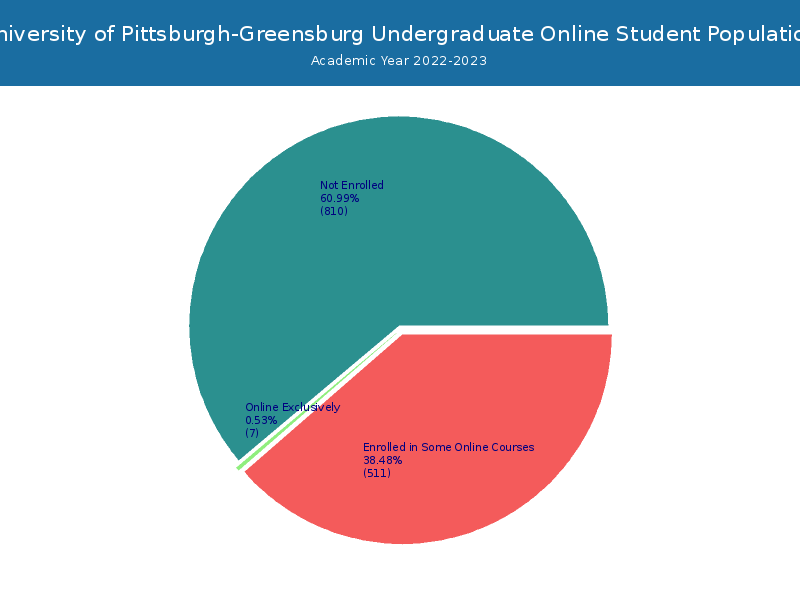
Online Student Enrollment
Distance learning, also called online education, is very attractive to students, especially who want to continue education and work in field. At University of Pittsburgh-Greensburg, 7 students are enrolled exclusively in online courses and 511 students are enrolled in some online courses.
6 students lived in Pennsylvania or jurisdiction in which the school is located are enrolled exclusively in online courses and 1 students live in other State or outside of the United States.
| All Students | Enrolled Exclusively Online Courses | Enrolled in Some Online Courses | |
|---|---|---|---|
| All Students | 1,328 | 7 | 511 |
| Undergraduate | 1,328 | 7 | 511 |
| Pennsylvania Residents | Other States in U.S. | Outside of U.S. | |
|---|---|---|---|
| All Students | 6 | 1 | 0 |
| Undergraduate | 6 | 1 | 0 |
| Graduate | - | - | - |
Transfer-in Students (Undergraduate)
Among 1,328 enrolled in undergraduate programs, 93 students have transferred-in from other institutions. The percentage of transfer-in students is 7.00%.88 students have transferred in as full-time status and 5 students transferred in as part-time status.
| Number of Students | |
|---|---|
| Regular Full-time | 1,180 |
| Transfer-in Full-time | 88 |
| Regular Part-time | 55 |
| Transfer-in Part-time | 5 |