Student Population by Gender
Moravian University has a total of 2,533 enrolled students for the academic year 2022-2023. 1,904 students have enrolled in undergraduate programs and 629 students joined graduate programs.
By gender, 924 male and 1,609 female students (the male-female ratio is 36:64) are attending the school. The gender distribution is based on the 2022-2023 data.
| Total | Undergraduate | Graduate | |
|---|---|---|---|
| Total | 2,533 | 1,904 | 629 |
| Men | 924 | 740 | 184 |
| Women | 1,609 | 1,164 | 445 |
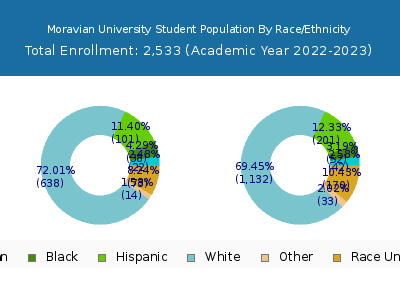
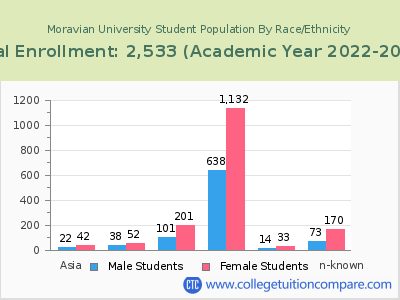
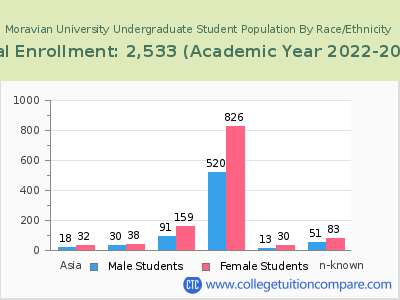
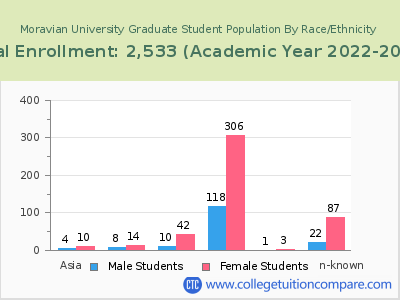
Student Distribution by Race/Ethnicity
| Race | Total | Men | Women |
|---|---|---|---|
| American Indian or Native American | 5 | 1 | 4 |
| Asian | 62 | 21 | 41 |
| Black | 109 | 56 | 53 |
| Hispanic | 333 | 119 | 214 |
| Native Hawaiian or Other Pacific Islanders | 2 | 2 | 0 |
| White | 1,710 | 621 | 1,089 |
| Two or more races | 38 | 10 | 28 |
| Race Unknown | 246 | 84 | 162 |
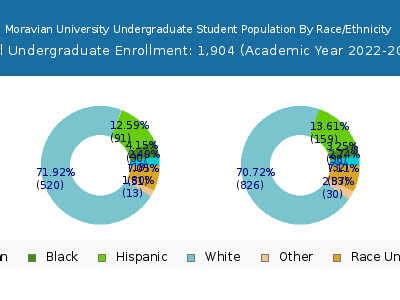
| Race | Total | Men | Women |
|---|---|---|---|
| American Indian or Native American | 5 | 1 | 4 |
| Asian | 50 | 17 | 33 |
| Black | 89 | 48 | 41 |
| Hispanic | 283 | 107 | 176 |
| Native Hawaiian or Other Pacific Islanders | 2 | 2 | 0 |
| White | 1,304 | 498 | 806 |
| Two or more races | 34 | 9 | 25 |
| Race Unknown | 121 | 54 | 67 |
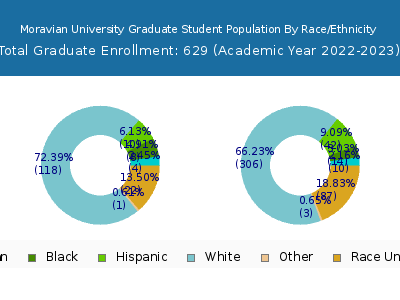
| Race | Total | Men | Women |
|---|---|---|---|
| American Indian or Native American | 0 | 0 | 0 |
| Asian | 0 | 0 | 0 |
| Black | 6 | 5 | 1 |
| Hispanic | 25 | 7 | 18 |
| Native Hawaiian or Other Pacific Islanders | 0 | 0 | 0 |
| White | 65 | 22 | 43 |
| Two or more races | 5 | 1 | 4 |
| Race Unknown | 17 | 8 | 9 |
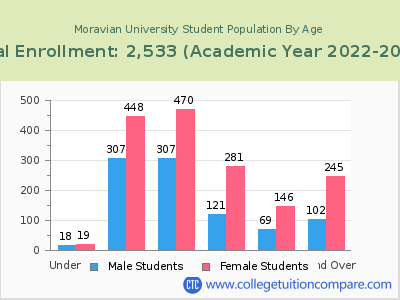
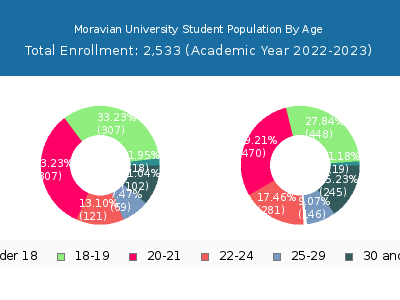
Student Age Distribution
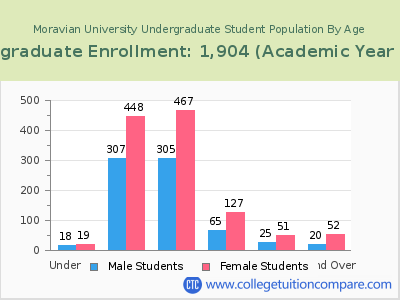
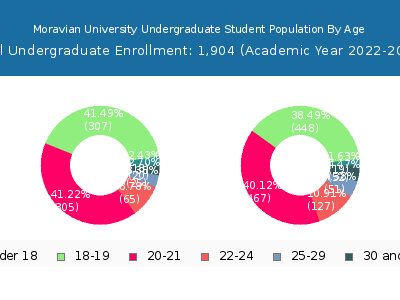
By age, Moravian has 37 students under 18 years old and 9 students over 65 years old. There are 1,971 students under 25 years old, and 562 students over 25 years old out of 2,533 total students.
Moravian has 1,756 undergraduate students aged under 25 and 148 students aged 25 and over.
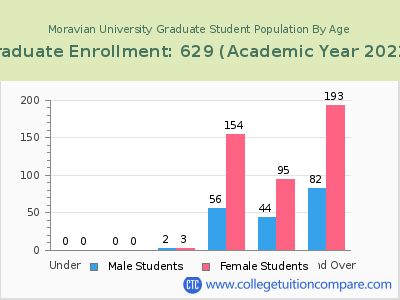
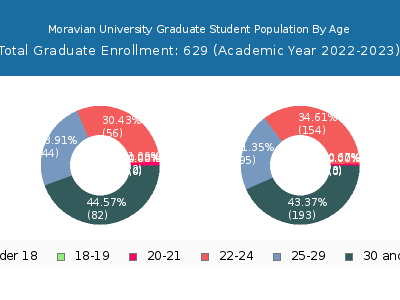
It has 215 graduate students aged under 25 and 414 students aged 25 and over.
| Age | Total | Men | Women |
|---|---|---|---|
| Under 18 | 37 | 19 | 18 |
| 18-19 | 755 | 448 | 307 |
| 20-21 | 777 | 470 | 307 |
| 22-24 | 402 | 281 | 121 |
| 25-29 | 215 | 146 | 69 |
| 30-34 | 103 | 71 | 32 |
| 35-39 | 79 | 54 | 25 |
| 40-49 | 100 | 72 | 28 |
| 50-64 | 56 | 40 | 16 |
| Over 65 | 9 | 8 | 1 |
| Age | Total | Men | Women |
|---|---|---|---|
| Under 18 | 37 | 19 | 18 |
| 18-19 | 755 | 448 | 307 |
| 20-21 | 772 | 467 | 305 |
| 22-24 | 192 | 127 | 65 |
| 25-29 | 76 | 51 | 25 |
| 30-34 | 25 | 15 | 10 |
| 35-39 | 14 | 10 | 4 |
| 40-49 | 24 | 20 | 4 |
| 50-64 | 9 | 7 | 2 |
| Age | Total | Men | Women |
|---|
Online Student Enrollment
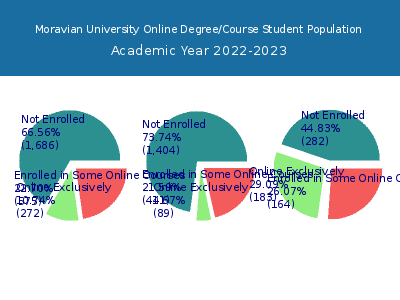
Distance learning, also called online education, is very attractive to students, especially who want to continue education and work in field. At Moravian University, 272 students are enrolled exclusively in online courses and 575 students are enrolled in some online courses.
223 students lived in Pennsylvania or jurisdiction in which the school is located are enrolled exclusively in online courses and 49 students live in other State or outside of the United States.
| All Students | Enrolled Exclusively Online Courses | Enrolled in Some Online Courses | |
|---|---|---|---|
| All Students | 2,533 | 272 | 575 |
| Undergraduate | 1,904 | 89 | 411 |
| Graduate | 629 | 183 | 164 |
| Pennsylvania Residents | Other States in U.S. | Outside of U.S. | |
|---|---|---|---|
| All Students | 223 | 48 | 1 |
| Undergraduate | 82 | 7 | 0 |
| Graduate | 141 | 41 | 1 |
Transfer-in Students (Undergraduate)
Among 1,904 enrolled in undergraduate programs, 119 students have transferred-in from other institutions. The percentage of transfer-in students is 6.25%.98 students have transferred in as full-time status and 21 students transferred in as part-time status.
| Number of Students | |
|---|---|
| Regular Full-time | 1,691 |
| Transfer-in Full-time | 98 |
| Regular Part-time | 94 |
| Transfer-in Part-time | 21 |
