Student Population by Gender
Lafayette College has a total of 2,729 enrolled students for the academic year 2022-2023. All 2,729 students are enrolled into undergraduate programs.
By gender, 1,364 male and 1,365 female students (the male-female ratio is 50:50) are attending the school. The gender distribution is based on the 2022-2023 data.
| Undergraduate | |
|---|---|
| Total | 2,729 |
| Men | 1,364 |
| Women | 1,365 |
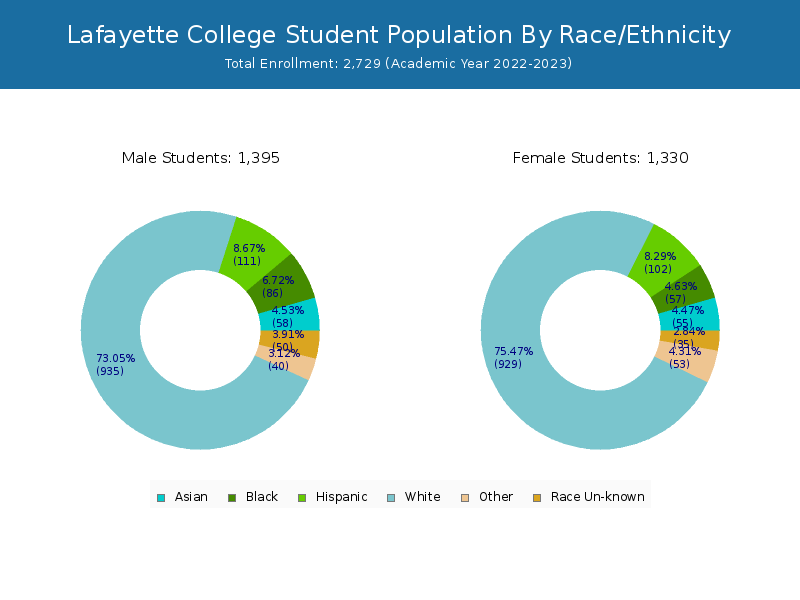
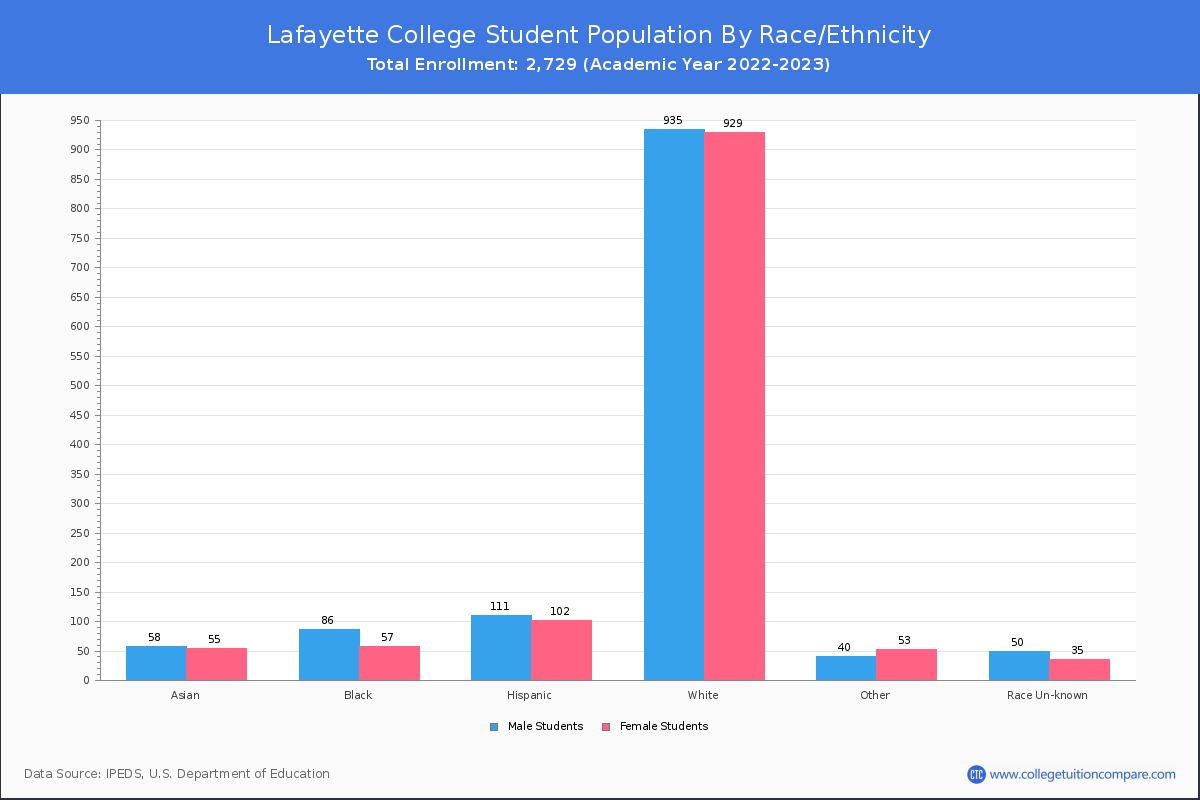
Student Distribution by Race/Ethnicity
By race/ethnicity, 1,846 White, 146 Black, and 113 Asian students out of a total of 2,729 are attending at Lafayette College. Comprehensive enrollment statistic data by race/ethnicity is shown in the next chart (Academic year 2022-2023 data).
| Race | Total | Men | Women |
|---|---|---|---|
| American Indian or Native American | 4 | 2 | 2 |
| Asian | 113 | 51 | 62 |
| Black | 146 | 82 | 64 |
| Hispanic | 224 | 104 | 120 |
| Native Hawaiian or Other Pacific Islanders | 0 | 0 | 0 |
| White | 1,846 | 909 | 937 |
| Two or more races | 118 | 57 | 61 |
| Race Unknown | 68 | 40 | 28 |
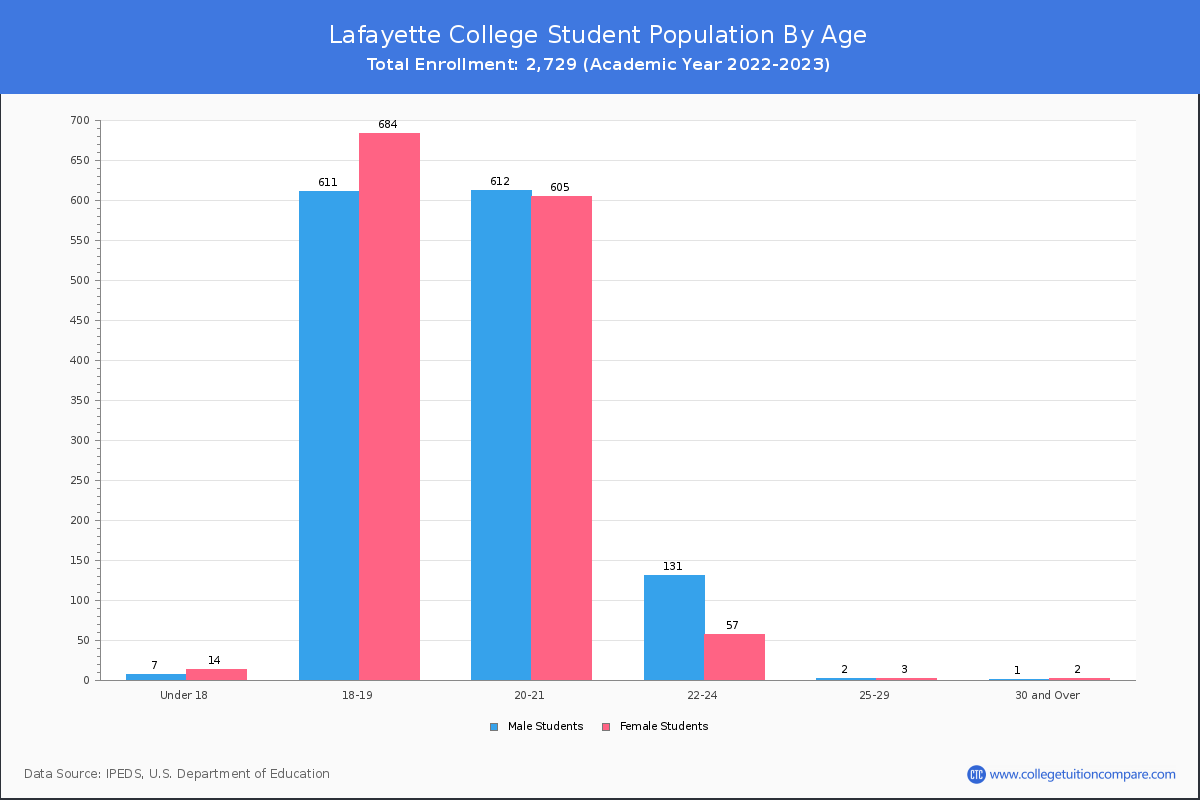
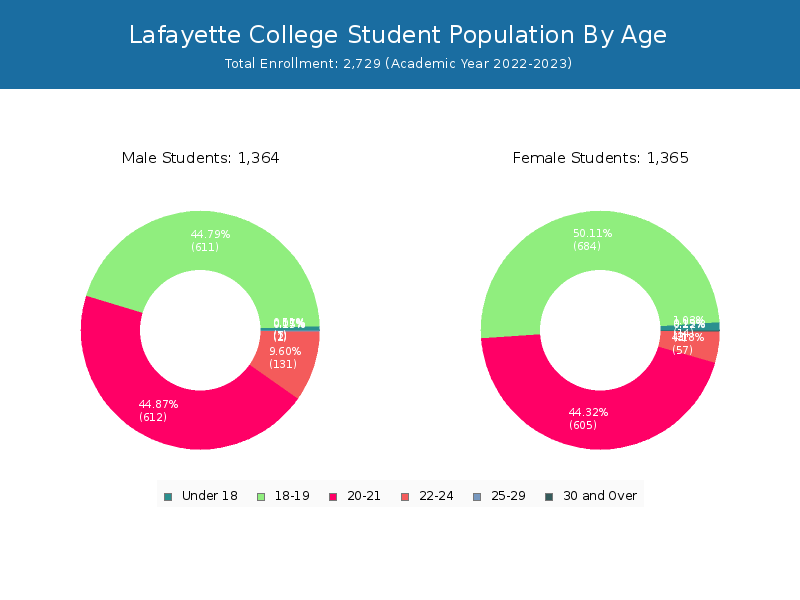
Student Age Distribution
There are 2,721 students under 25 years old, and 8 students over 25 years old out of 2,729 total students.
| Age | Total | Men | Women |
|---|---|---|---|
| Under 18 | 21 | 14 | 7 |
| 18-19 | 1,295 | 684 | 611 |
| 20-21 | 1,217 | 605 | 612 |
| 22-24 | 188 | 57 | 131 |
| 25-29 | 5 | 3 | 2 |
Transfer-in Students (Undergraduate)
Among 2,729 enrolled in undergraduate programs, 19 students have transferred-in from other institutions. The percentage of transfer-in students is 0.70%.
| Number of Students | |
|---|---|
| Regular Full-time | 2,693 |
| Transfer-in Full-time | 19 |