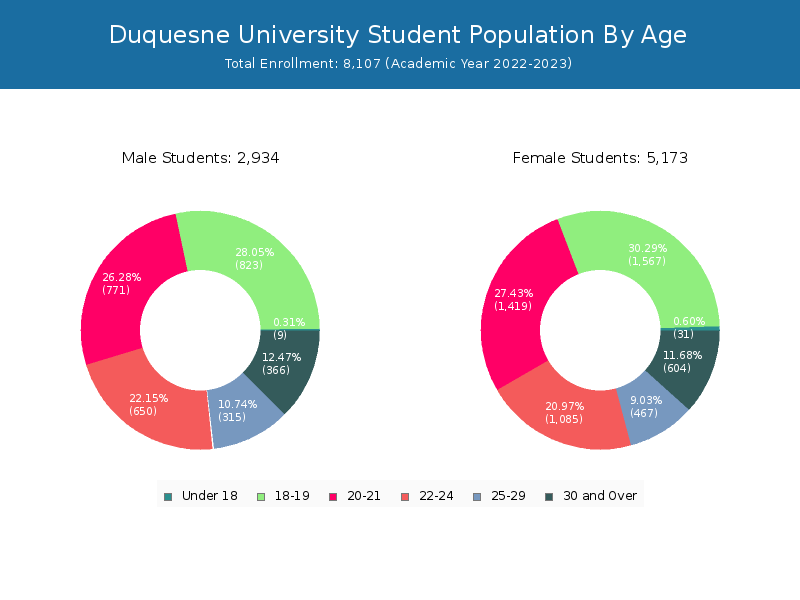
Student Population by Gender
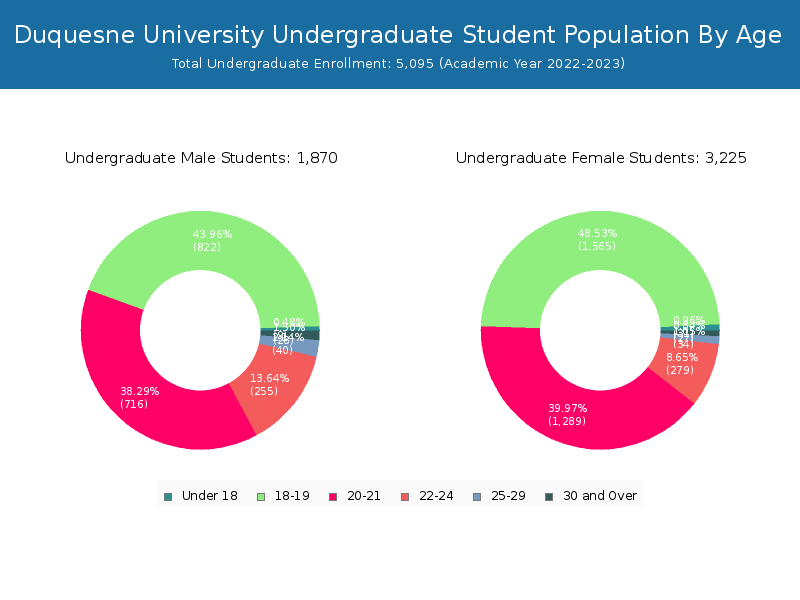
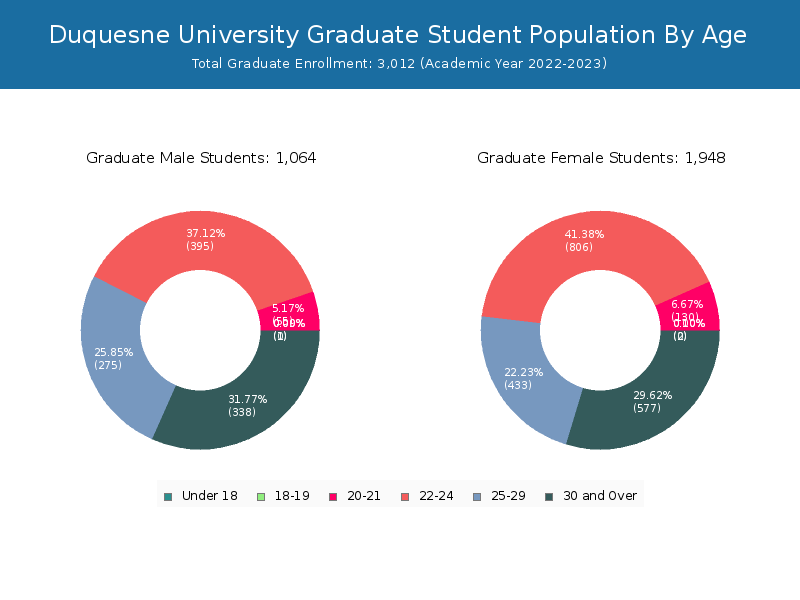
Duquesne University has a total of 8,107 enrolled students for the academic year 2022-2023. 5,095 students have enrolled in undergraduate programs and 3,012 students joined graduate programs.
By gender, 2,934 male and 5,173 female students (the male-female ratio is 36:64) are attending the school. The gender distribution is based on the 2022-2023 data.
| Total | Undergraduate | Graduate | |
|---|---|---|---|
| Total | 8,107 | 5,095 | 3,012 |
| Men | 2,934 | 1,870 | 1,064 |
| Women | 5,173 | 3,225 | 1,948 |
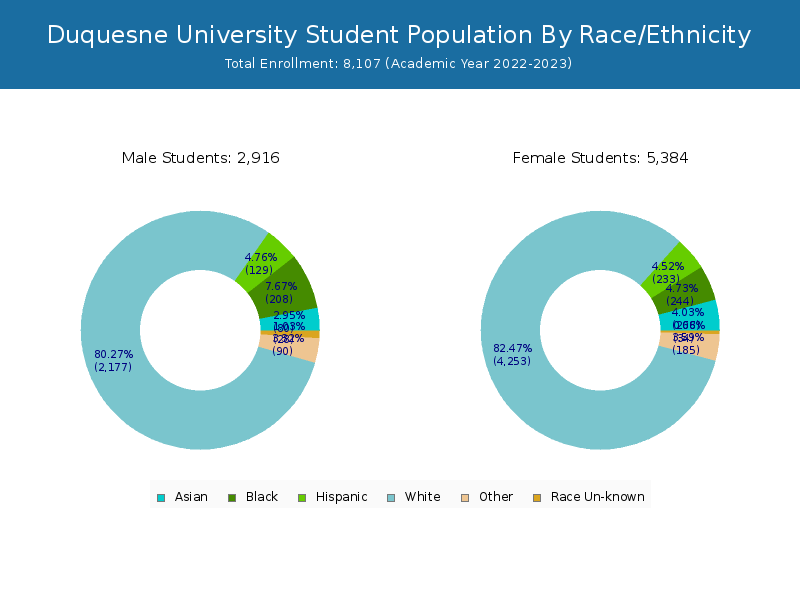
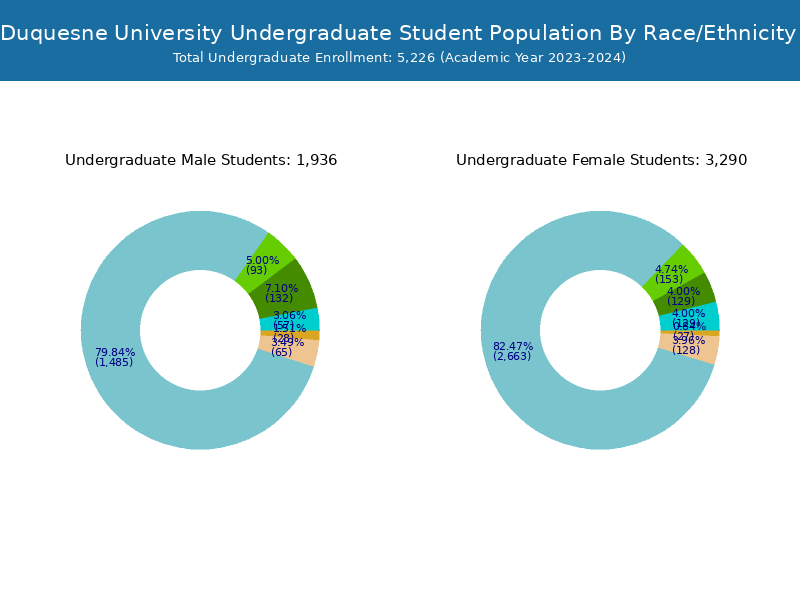
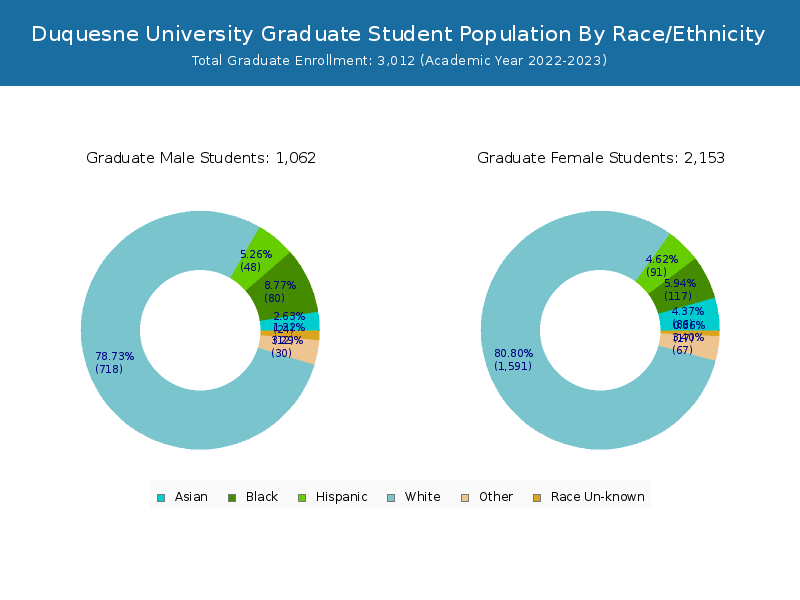
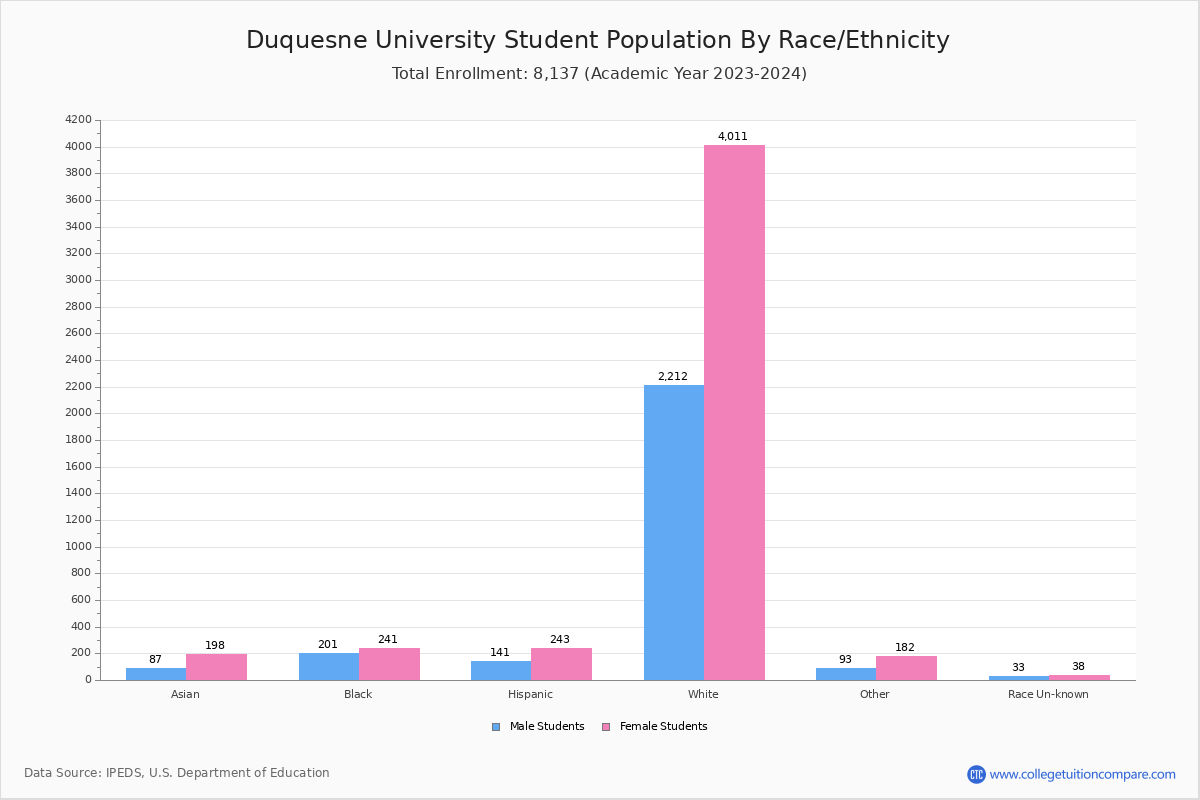
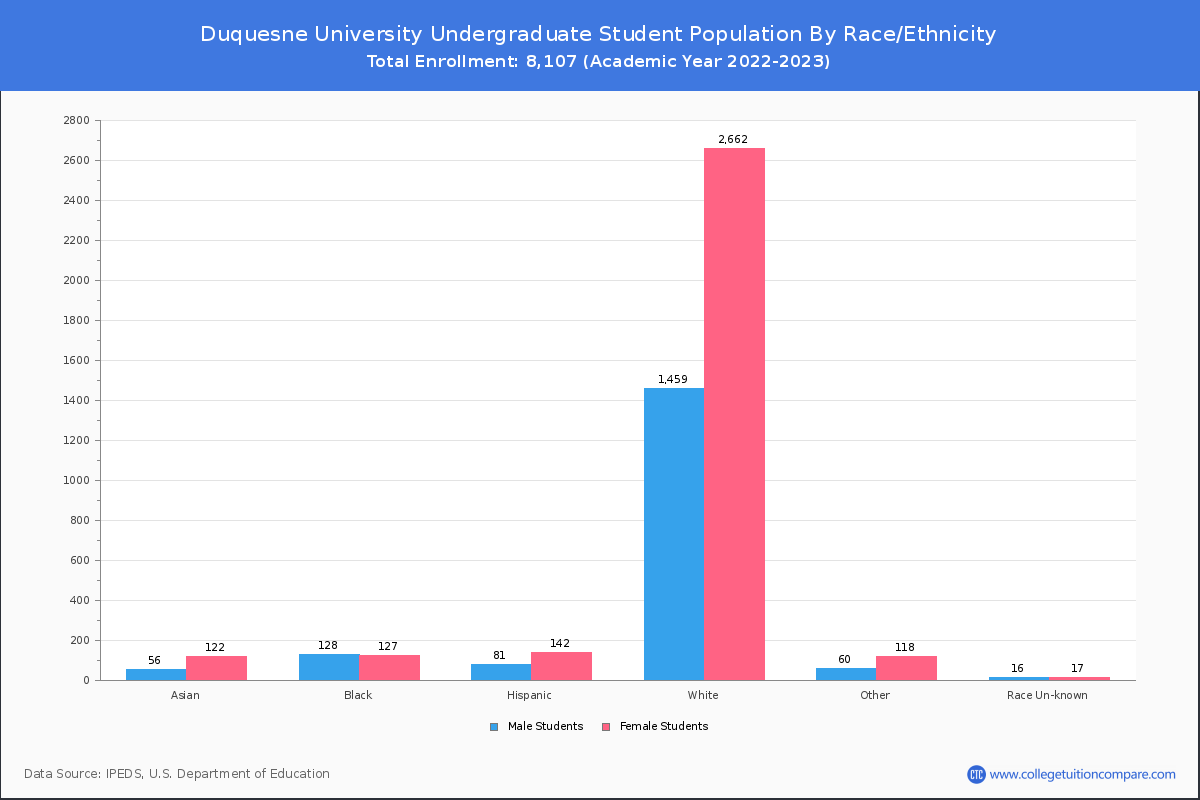
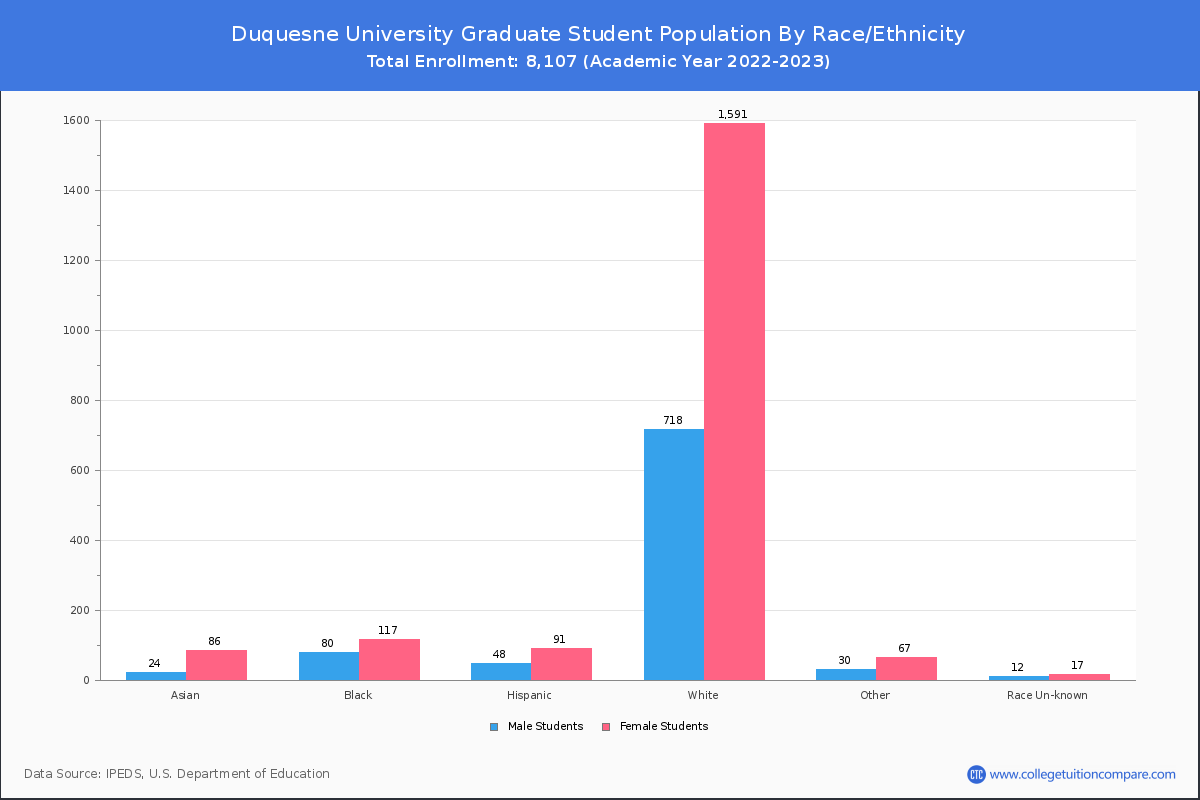
Student Distribution by Race/Ethnicity
By race/ethnicity, 6,210 White, 439 Black, and 276 Asian students out of a total of 8,107 are attending at Duquesne University. Comprehensive enrollment statistic data by race/ethnicity is shown in the next chart (Academic year 2022-2023 data).
| Race | Total | Men | Women |
|---|---|---|---|
| American Indian or Native American | 8 | 1 | 7 |
| Asian | 276 | 80 | 196 |
| Black | 439 | 201 | 238 |
| Hispanic | 362 | 140 | 222 |
| Native Hawaiian or Other Pacific Islanders | 5 | 0 | 5 |
| White | 6,210 | 2,148 | 4,062 |
| Two or more races | 263 | 92 | 171 |
| Race Unknown | 69 | 32 | 37 |
| Race | Total | Men | Women |
|---|---|---|---|
| American Indian or Native American | 7 | 1 | 6 |
| Asian | 184 | 57 | 127 |
| Black | 246 | 127 | 119 |
| Hispanic | 235 | 93 | 142 |
| Native Hawaiian or Other Pacific Islanders | 4 | 0 | 4 |
| White | 4,080 | 1,437 | 2,643 |
| Two or more races | 176 | 67 | 109 |
| Race Unknown | 46 | 23 | 23 |
| Race | Total | Men | Women |
|---|---|---|---|
| American Indian or Native American | 1 | 1 | 0 |
| Asian | 10 | 5 | 5 |
| Black | 23 | 15 | 8 |
| Hispanic | 11 | 3 | 8 |
| Native Hawaiian or Other Pacific Islanders | 0 | 0 | 0 |
| White | 148 | 62 | 86 |
| Two or more races | 7 | 3 | 4 |
| Race Unknown | 7 | 3 | 4 |
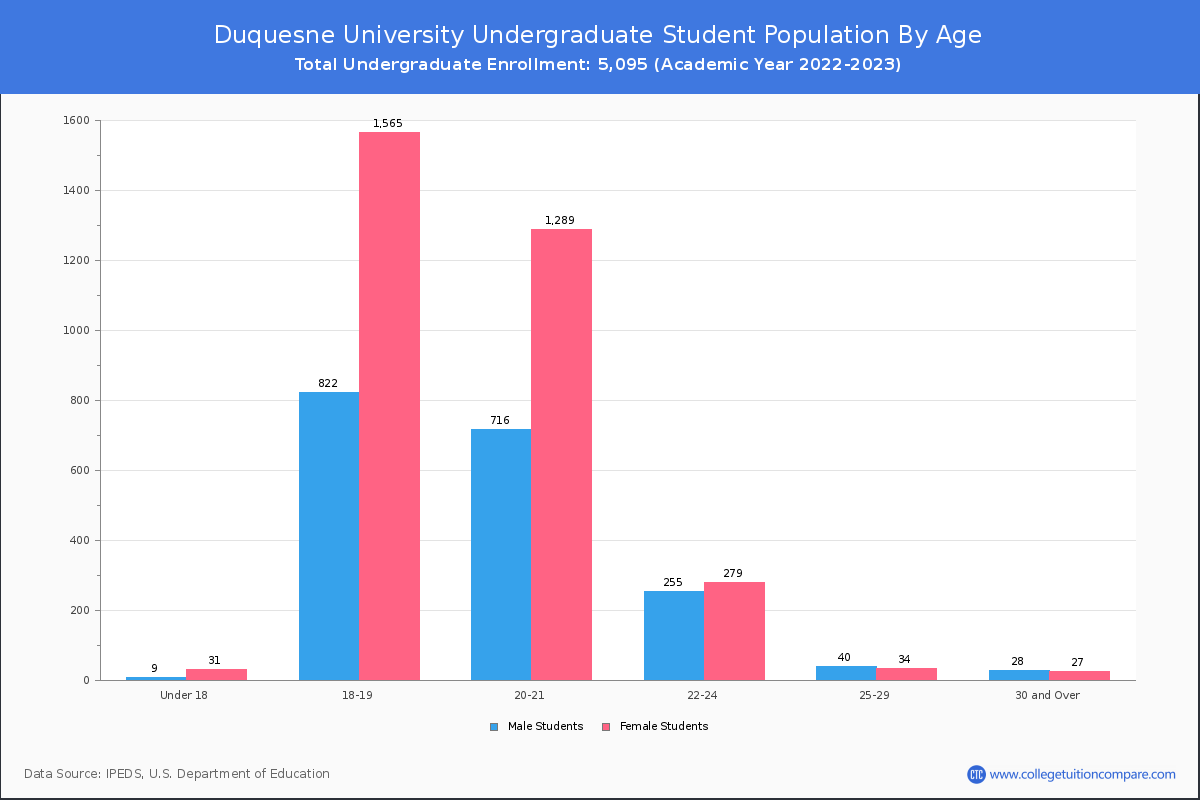
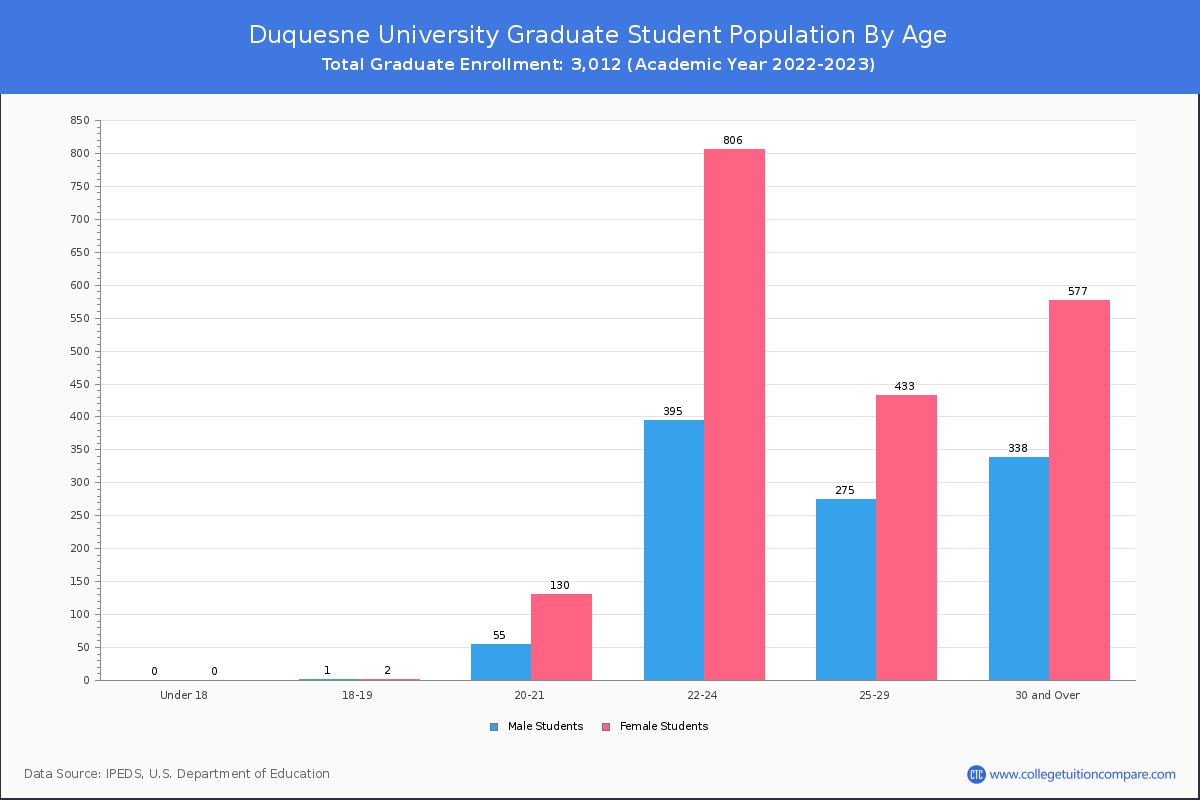
Student Age Distribution
By age, Duquesne has 40 students under 18 years old and 7 students over 65 years old. There are 6,355 students under 25 years old, and 1,752 students over 25 years old out of 8,107 total students.
In undergraduate programs, 40 students are younger than 18 and 1 students are older than 65. Duquesne has 4,966 undergraduate students aged under 25 and 129 students aged 25 and over.
It has 1,389 graduate students aged under 25 and 1,623 students aged 25 and over.
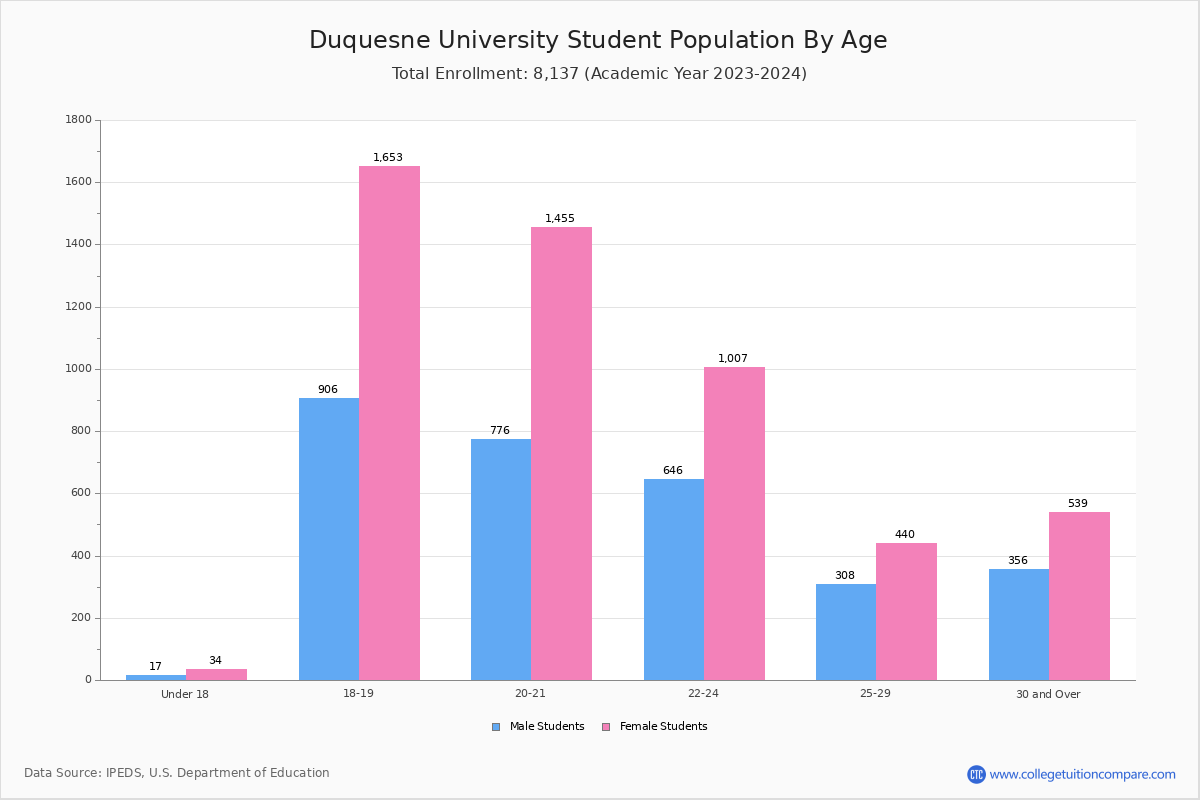
| Age | Total | Men | Women |
|---|---|---|---|
| Under 18 | 40 | 31 | 9 |
| 18-19 | 2,390 | 1,567 | 823 |
| 20-21 | 2,190 | 1,419 | 771 |
| 22-24 | 1,735 | 1,085 | 650 |
| 25-29 | 782 | 467 | 315 |
| 30-34 | 370 | 216 | 154 |
| 35-39 | 237 | 144 | 93 |
| 40-49 | 248 | 164 | 84 |
| 50-64 | 108 | 76 | 32 |
| Over 65 | 7 | 4 | 3 |
| Age | Total | Men | Women |
|---|---|---|---|
| Under 18 | 40 | 31 | 9 |
| 18-19 | 2,387 | 1,565 | 822 |
| 20-21 | 2,005 | 1,289 | 716 |
| 22-24 | 534 | 279 | 255 |
| 25-29 | 74 | 34 | 40 |
| 30-34 | 25 | 13 | 12 |
| 35-39 | 13 | 6 | 7 |
| 40-49 | 11 | 4 | 7 |
| 50-64 | 5 | 4 | 1 |
| Over 65 | 1 | 0 | 1 |
| Age | Total | Men | Women |
|---|
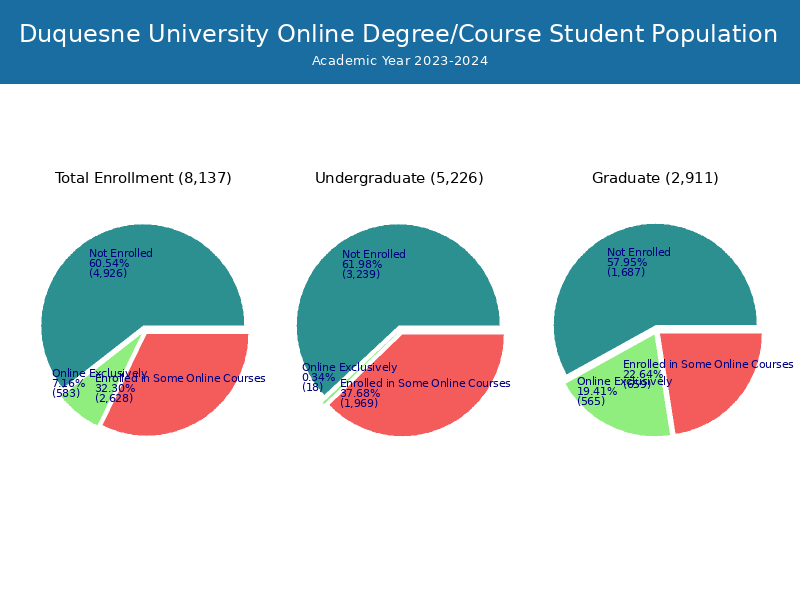
Online Student Enrollment
Distance learning, also called online education, is very attractive to students, especially who want to continue education and work in field. At Duquesne University, 659 students are enrolled exclusively in online courses and 2,408 students are enrolled in some online courses.
429 students lived in Pennsylvania or jurisdiction in which the school is located are enrolled exclusively in online courses and 230 students live in other State or outside of the United States.
| All Students | Enrolled Exclusively Online Courses | Enrolled in Some Online Courses | |
|---|---|---|---|
| All Students | 8,107 | 659 | 2,408 |
| Undergraduate | 5,095 | 21 | 1,791 |
| Graduate | 3,012 | 638 | 617 |
| Pennsylvania Residents | Other States in U.S. | Outside of U.S. | |
|---|---|---|---|
| All Students | 429 | 220 | 10 |
| Undergraduate | 15 | 6 | 0 |
| Graduate | 414 | 214 | 10 |
Transfer-in Students (Undergraduate)
Among 5,095 enrolled in undergraduate programs, 212 students have transferred-in from other institutions. The percentage of transfer-in students is 4.16%.
| Number of Students | |
|---|---|
| Regular Full-time | 4,804 |
| Transfer-in Full-time | 212 |