Student Population by Gender
Chatham University has a total of 2,387 enrolled students for the academic year 2022-2023. 1,499 students have enrolled in undergraduate programs and 888 students joined graduate programs.
By gender, 589 male and 1,798 female students (the male-female ratio is 25:75) are attending the school. The gender distribution is based on the 2022-2023 data.
| Total | Undergraduate | Graduate | |
|---|---|---|---|
| Total | 2,387 | 1,499 | 888 |
| Men | 589 | 415 | 174 |
| Women | 1,798 | 1,084 | 714 |
Student Distribution by Race/Ethnicity
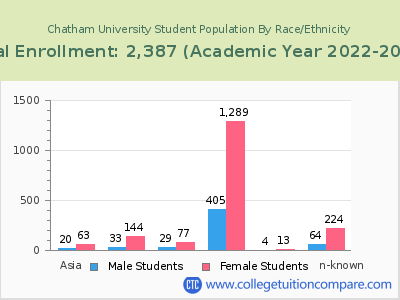
| Race | Total | Men | Women |
|---|---|---|---|
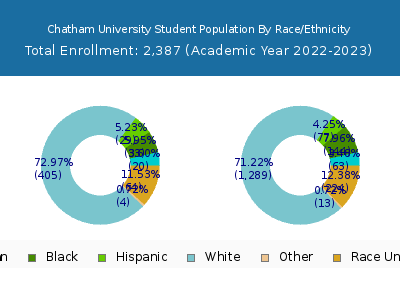
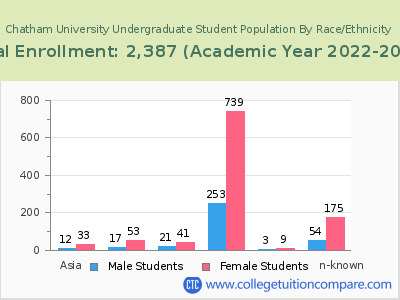
| American Indian or Native American | 5 | 1 | 4 |
| Asian | 98 | 24 | 74 |
| Black | 170 | 42 | 128 |
| Hispanic | 115 | 39 | 76 |
| Native Hawaiian or Other Pacific Islanders | 0 | 0 | 0 |
| White | 1,600 | 378 | 1,222 |
| Two or more races | 4 | 0 | 4 |
| Race Unknown | 320 | 73 | 247 |
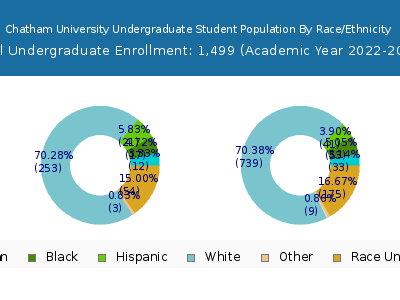
| Race | Total | Men | Women |
|---|---|---|---|
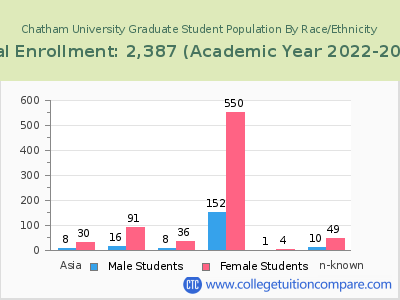
| American Indian or Native American | 2 | 0 | 2 |
| Asian | 48 | 16 | 32 |
| Black | 77 | 24 | 53 |
| Hispanic | 69 | 30 | 39 |
| Native Hawaiian or Other Pacific Islanders | 0 | 0 | 0 |
| White | 960 | 257 | 703 |
| Two or more races | 3 | 0 | 3 |
| Race Unknown | 287 | 63 | 224 |
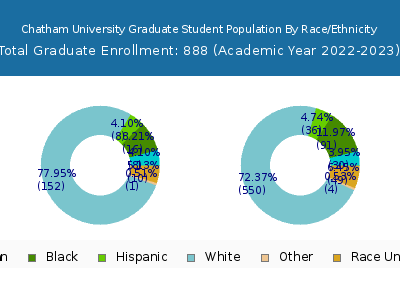
| Race | Total | Men | Women |
|---|---|---|---|
| American Indian or Native American | 0 | 0 | 0 |
| Asian | 0 | 0 | 0 |
| Black | 5 | 4 | 1 |
| Hispanic | 5 | 4 | 1 |
| Native Hawaiian or Other Pacific Islanders | 0 | 0 | 0 |
| White | 52 | 16 | 36 |
| Two or more races | 0 | 0 | 0 |
| Race Unknown | 6 | 5 | 1 |
Student Age Distribution
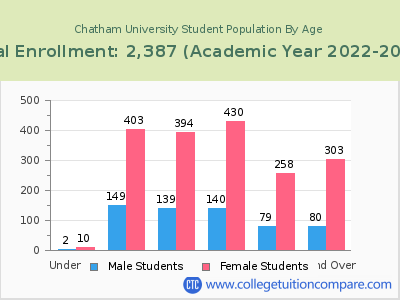
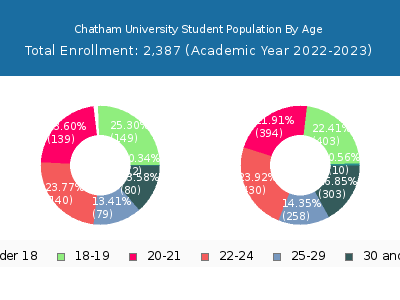
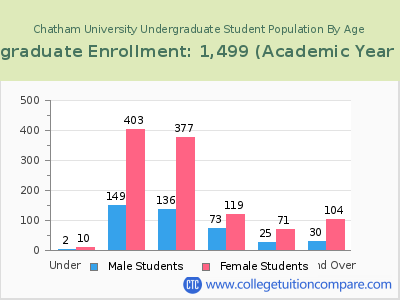
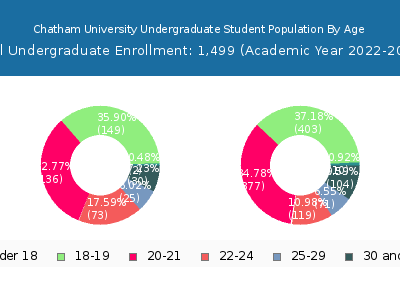
By age, Chatham has 12 students under 18 years old and 1 students over 65 years old. There are 1,667 students under 25 years old, and 720 students over 25 years old out of 2,387 total students.
Chatham has 1,269 undergraduate students aged under 25 and 230 students aged 25 and over.
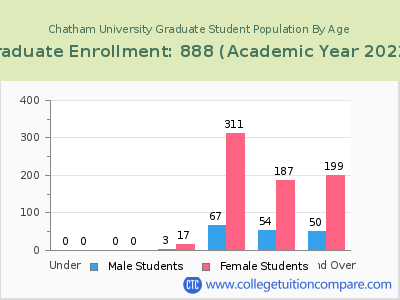
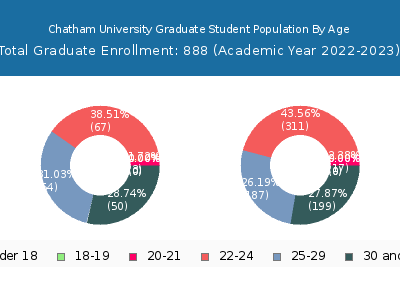
It has 398 graduate students aged under 25 and 490 students aged 25 and over.
| Age | Total | Men | Women |
|---|---|---|---|
| Under 18 | 12 | 10 | 2 |
| 18-19 | 552 | 403 | 149 |
| 20-21 | 533 | 394 | 139 |
| 22-24 | 570 | 430 | 140 |
| 25-29 | 337 | 258 | 79 |
| 30-34 | 127 | 97 | 30 |
| 35-39 | 88 | 67 | 21 |
| 40-49 | 109 | 91 | 18 |
| 50-64 | 58 | 48 | 10 |
| Over 65 | 1 | 0 | 1 |
| Age | Total | Men | Women |
|---|---|---|---|
| Under 18 | 12 | 10 | 2 |
| 18-19 | 552 | 403 | 149 |
| 20-21 | 513 | 377 | 136 |
| 22-24 | 192 | 119 | 73 |
| 25-29 | 96 | 71 | 25 |
| 30-34 | 59 | 44 | 15 |
| 35-39 | 34 | 29 | 5 |
| 40-49 | 33 | 26 | 7 |
| 50-64 | 8 | 5 | 3 |
| Age | Total | Men | Women |
|---|
Online Student Enrollment
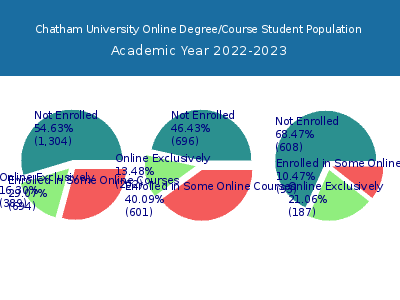
Distance learning, also called online education, is very attractive to students, especially who want to continue education and work in field. At Chatham University, 389 students are enrolled exclusively in online courses and 694 students are enrolled in some online courses.
262 students lived in Pennsylvania or jurisdiction in which the school is located are enrolled exclusively in online courses and 127 students live in other State or outside of the United States.
| All Students | Enrolled Exclusively Online Courses | Enrolled in Some Online Courses | |
|---|---|---|---|
| All Students | 2,387 | 389 | 694 |
| Undergraduate | 1,499 | 202 | 601 |
| Graduate | 888 | 187 | 93 |
| Pennsylvania Residents | Other States in U.S. | Outside of U.S. | |
|---|---|---|---|
| All Students | 262 | 127 | 0 |
| Undergraduate | 191 | 11 | 0 |
| Graduate | 71 | 116 | 0 |
Transfer-in Students (Undergraduate)
Among 1,499 enrolled in undergraduate programs, 68 students have transferred-in from other institutions. The percentage of transfer-in students is 4.54%.63 students have transferred in as full-time status and 5 students transferred in as part-time status.
| Number of Students | |
|---|---|
| Regular Full-time | 1,129 |
| Transfer-in Full-time | 63 |
| Regular Part-time | 302 |
| Transfer-in Part-time | 5 |
