Student Population by Gender
Oregon State University has a total of 34,292 enrolled students for the academic year 2022-2023. 28,905 students have enrolled in undergraduate programs and 5,387 students joined graduate programs.
By gender, 17,323 male and 16,969 female students (the male-female ratio is 51:49) are attending the school. The gender distribution is based on the 2022-2023 data.
| Total | Undergraduate | Graduate | |
|---|---|---|---|
| Total | 34,292 | 28,905 | 5,387 |
| Men | 17,323 | 14,816 | 2,507 |
| Women | 16,969 | 14,089 | 2,880 |
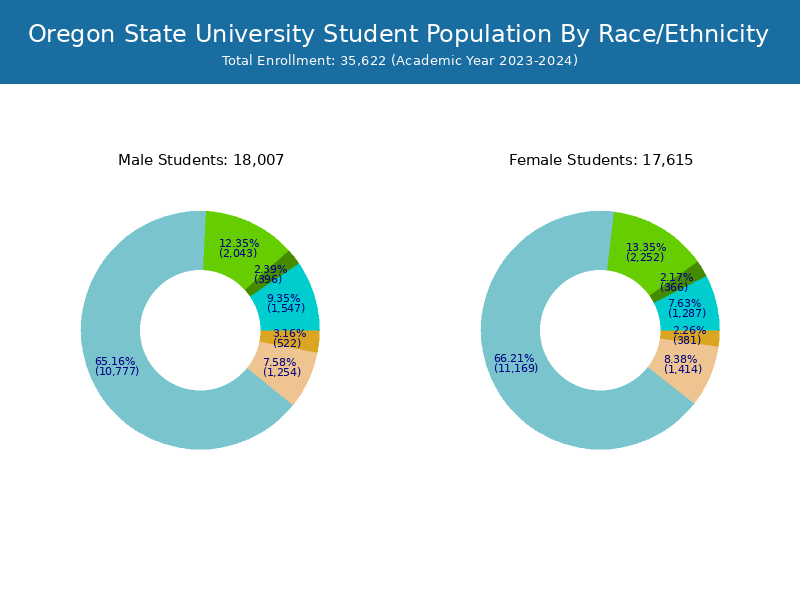
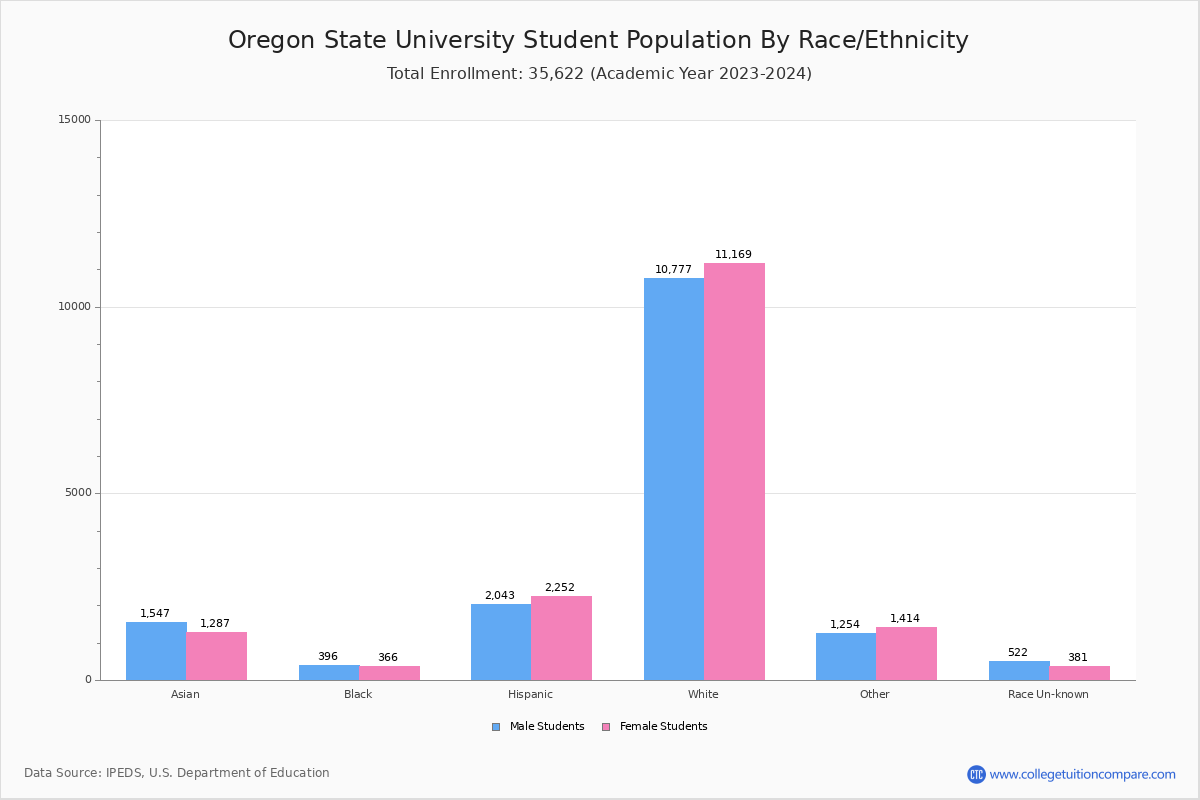
Student Distribution by Race/Ethnicity
By race/ethnicity, 21,065 White, 616 Black, and 2,810 Asian students out of a total of 34,292 are attending at Oregon State University. Comprehensive enrollment statistic data by race/ethnicity is shown in the next chart (Academic year 2022-2023 data).
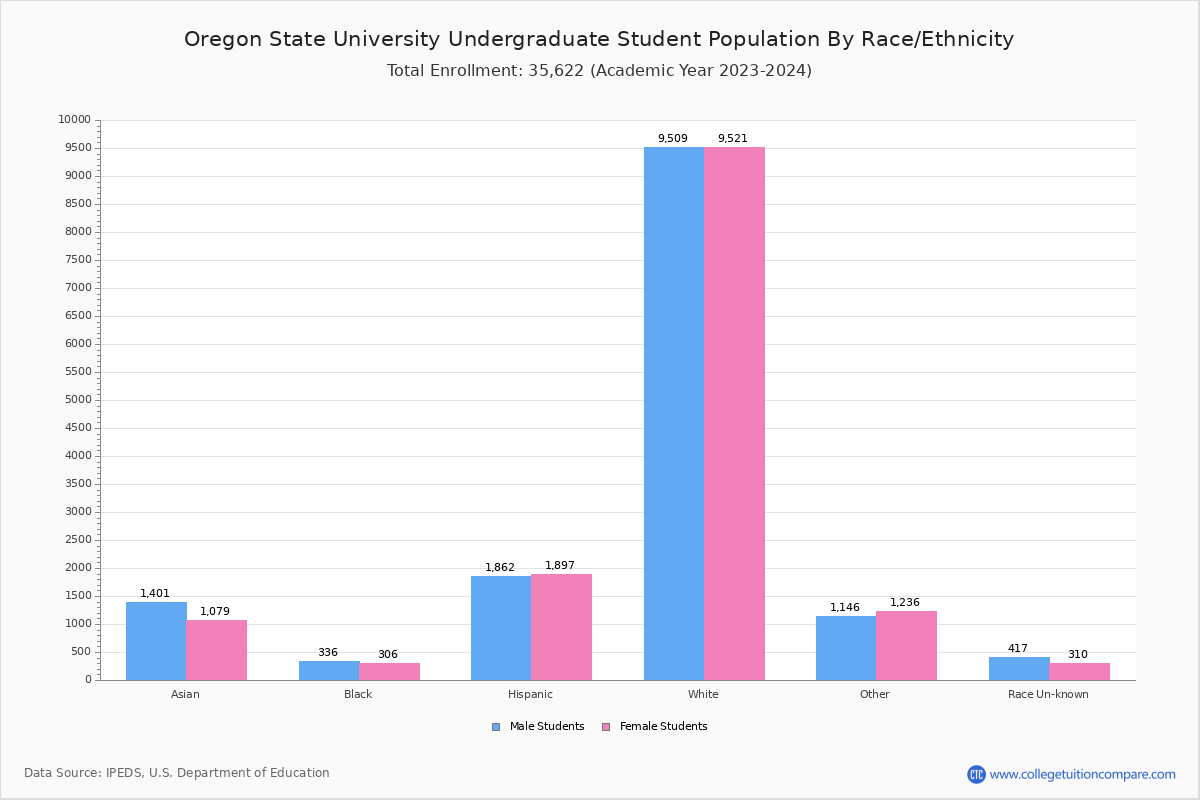
| Race | Total | Men | Women |
|---|---|---|---|
| American Indian or Native American | 186 | 79 | 107 |
| Asian | 2,810 | 1,526 | 1,284 |
| Black | 616 | 325 | 291 |
| Hispanic | 4,049 | 1,937 | 2,112 |
| Native Hawaiian or Other Pacific Islanders | 96 | 48 | 48 |
| White | 21,065 | 10,297 | 10,768 |
| Two or more races | 2,273 | 1,069 | 1,204 |
| Race Unknown | 859 | 476 | 383 |
| Race | Total | Men | Women |
|---|---|---|---|
| American Indian or Native American | 162 | 73 | 89 |
| Asian | 2,454 | 1,407 | 1,047 |
| Black | 512 | 269 | 243 |
| Hispanic | 3,534 | 1,752 | 1,782 |
| Native Hawaiian or Other Pacific Islanders | 85 | 46 | 39 |
| White | 18,229 | 9,085 | 9,144 |
| Two or more races | 2,041 | 974 | 1,067 |
| Race Unknown | 695 | 391 | 304 |
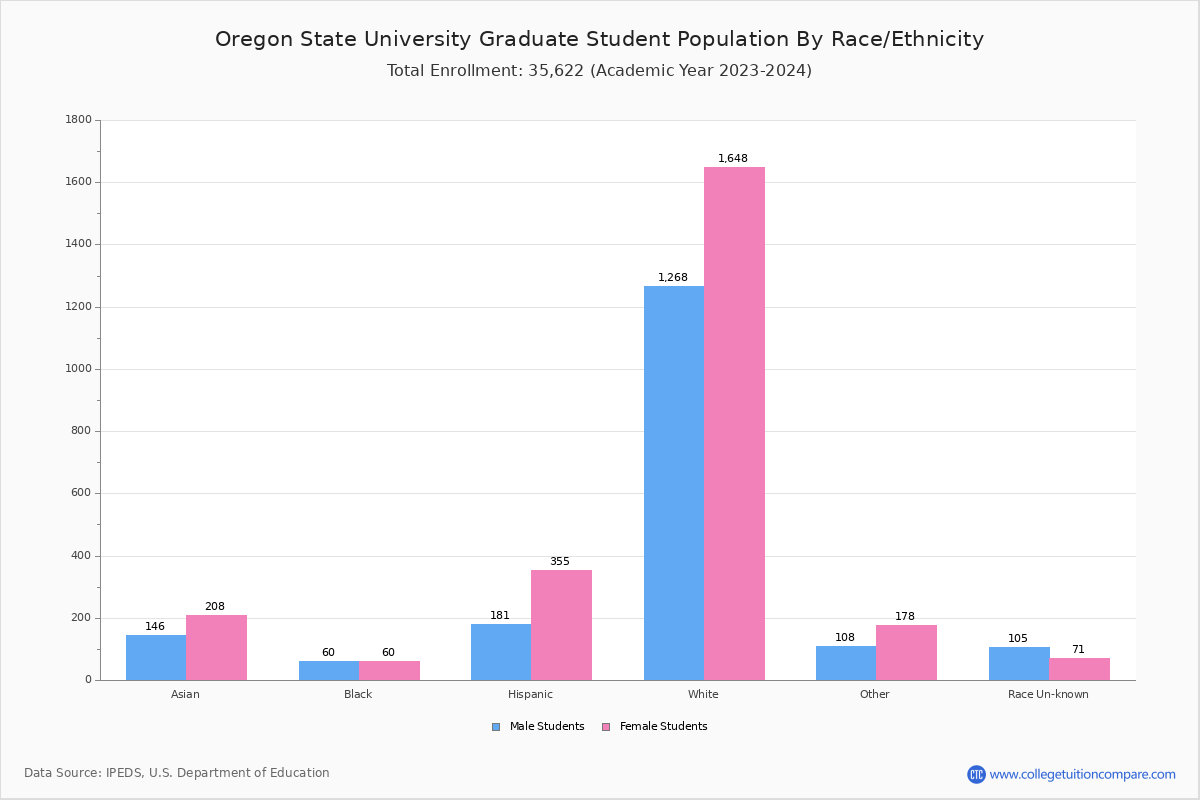
| Race | Total | Men | Women |
|---|---|---|---|
| American Indian or Native American | 21 | 7 | 14 |
| Asian | 117 | 72 | 45 |
| Black | 67 | 35 | 32 |
| Hispanic | 394 | 191 | 203 |
| Native Hawaiian or Other Pacific Islanders | 6 | 4 | 2 |
| White | 1,694 | 744 | 950 |
| Two or more races | 172 | 75 | 97 |
| Race Unknown | 40 | 17 | 23 |
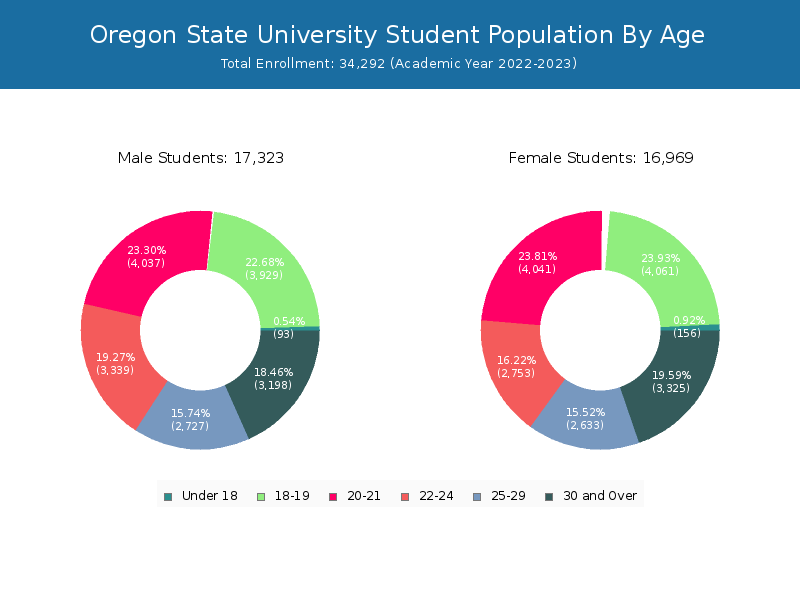
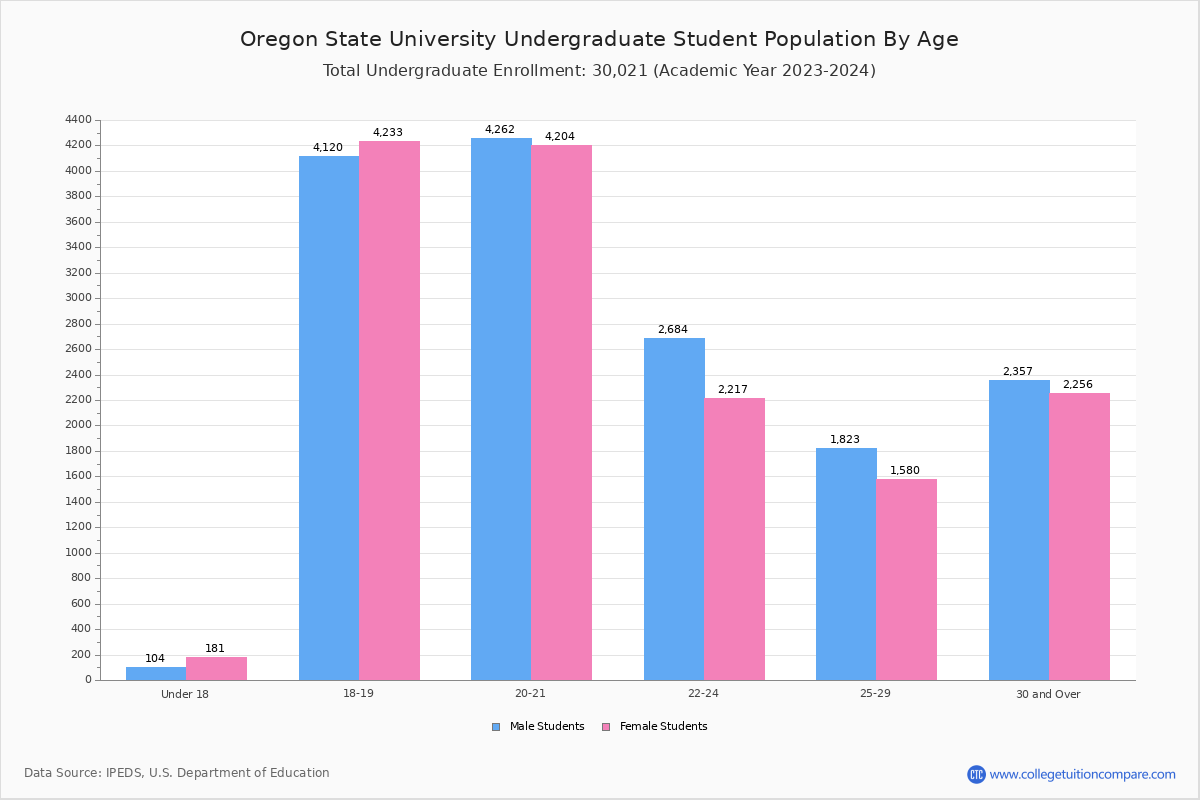
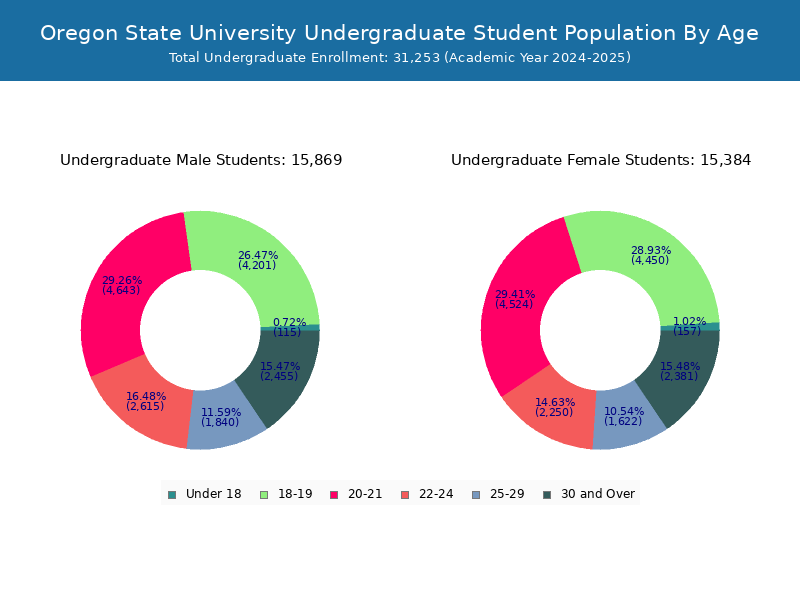
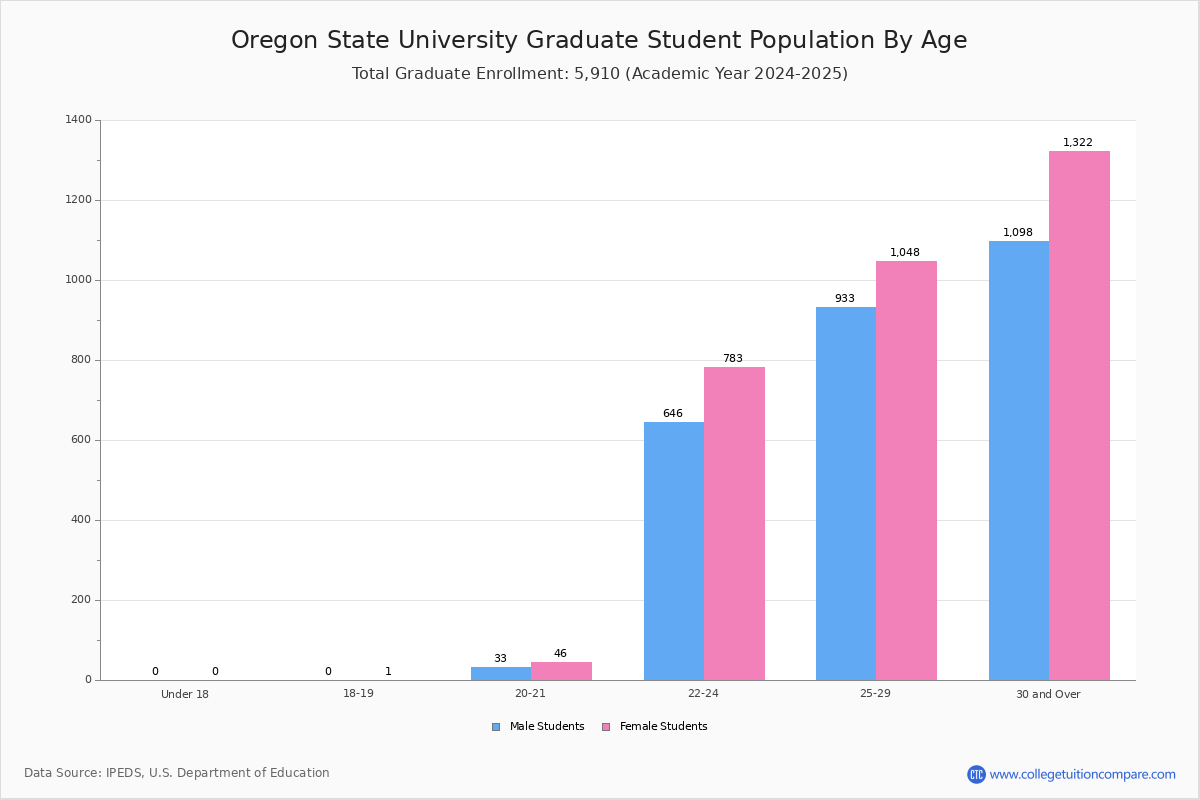
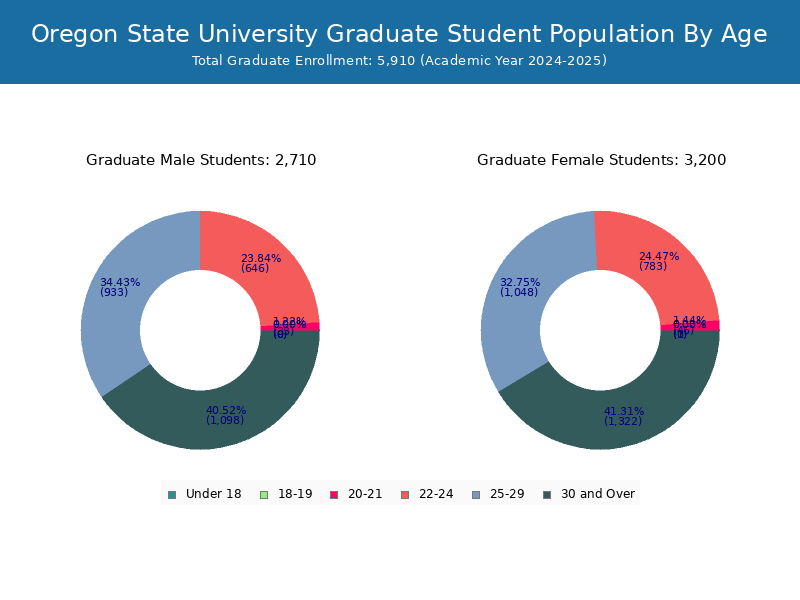
Student Age Distribution
By age, Oregon State has 249 students under 18 years old and 66 students over 65 years old. There are 22,409 students under 25 years old, and 11,883 students over 25 years old out of 34,292 total students.
In undergraduate programs, 249 students are younger than 18 and 19 students are older than 65. Oregon State has 21,032 undergraduate students aged under 25 and 7,873 students aged 25 and over.
It has 1,377 graduate students aged under 25 and 4,010 students aged 25 and over.
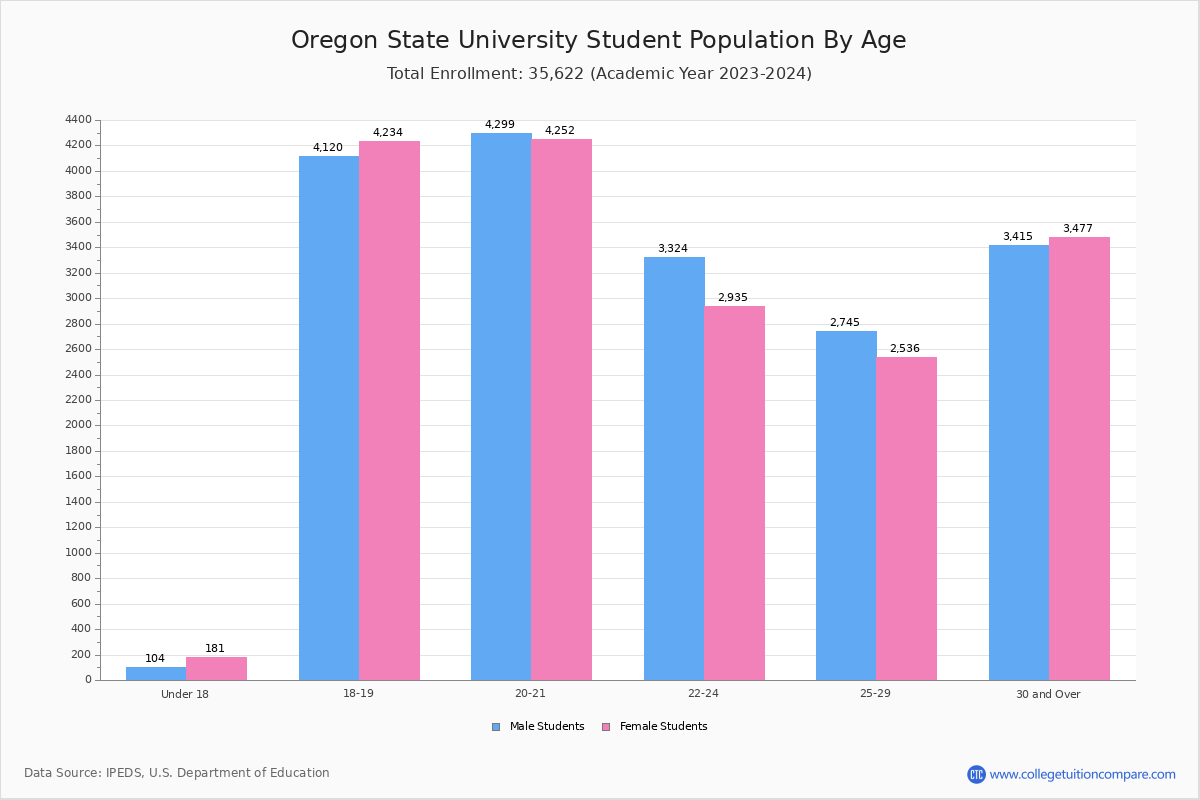
| Age | Total | Men | Women |
|---|---|---|---|
| Under 18 | 249 | 156 | 93 |
| 18-19 | 7,990 | 4,061 | 3,929 |
| 20-21 | 8,078 | 4,041 | 4,037 |
| 22-24 | 6,092 | 2,753 | 3,339 |
| 25-29 | 5,360 | 2,633 | 2,727 |
| 30-34 | 3,121 | 1,479 | 1,642 |
| 35-39 | 1,531 | 766 | 765 |
| 40-49 | 1,338 | 760 | 578 |
| 50-64 | 467 | 287 | 180 |
| Over 65 | 66 | 33 | 33 |
| Age | Total | Men | Women |
|---|---|---|---|
| Under 18 | 249 | 156 | 93 |
| 18-19 | 7,987 | 4,060 | 3,927 |
| 20-21 | 7,986 | 3,983 | 4,003 |
| 22-24 | 4,810 | 2,057 | 2,753 |
| 25-29 | 3,422 | 1,627 | 1,795 |
| 30-34 | 2,173 | 988 | 1,185 |
| 35-39 | 1,055 | 523 | 532 |
| 40-49 | 908 | 506 | 402 |
| 50-64 | 296 | 180 | 116 |
| Over 65 | 19 | 9 | 10 |
| Age | Total | Men | Women |
|---|
Online Student Enrollment
Distance learning, also called online education, is very attractive to students, especially who want to continue education and work in field. At Oregon State University, 11,727 students are enrolled exclusively in online courses and 7,624 students are enrolled in some online courses.
3,973 students lived in Oregon or jurisdiction in which the school is located are enrolled exclusively in online courses and 7,754 students live in other State or outside of the United States.
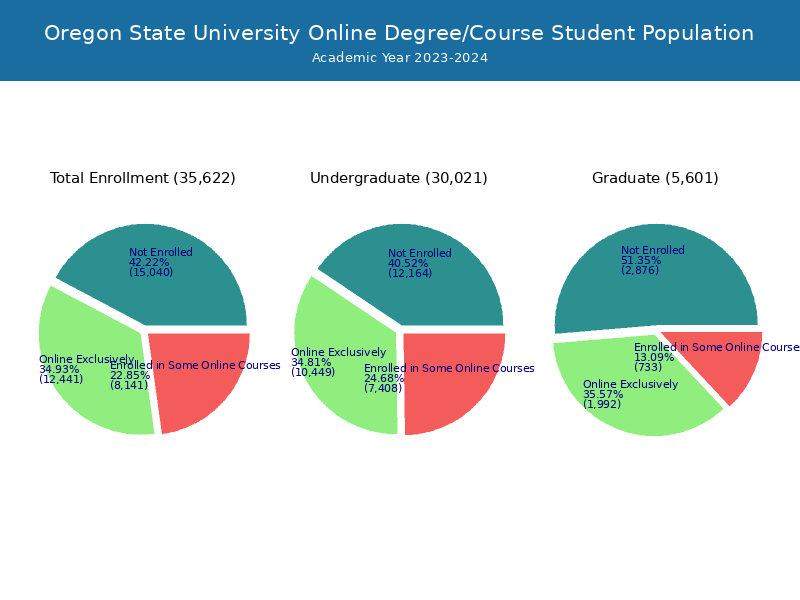
| All Students | Enrolled Exclusively Online Courses | Enrolled in Some Online Courses | |
|---|---|---|---|
| All Students | 34,292 | 11,727 | 7,624 |
| Undergraduate | 28,905 | 9,911 | 7,058 |
| Graduate | 5,387 | 1,816 | 566 |
| Oregon Residents | Other States in U.S. | Outside of U.S. | |
|---|---|---|---|
| All Students | 3,973 | 7,407 | 347 |
| Undergraduate | 3,144 | 6,458 | 309 |
| Graduate | 829 | 949 | 38 |
Transfer-in Students (Undergraduate)
Among 28,905 enrolled in undergraduate programs, 2,578 students have transferred-in from other institutions. The percentage of transfer-in students is 8.92%.1,692 students have transferred in as full-time status and 886 students transferred in as part-time status.
| Number of Students | |
|---|---|
| Regular Full-time | 18,153 |
| Transfer-in Full-time | 1,692 |
| Regular Part-time | 8,174 |
| Transfer-in Part-time | 886 |