Student Population by Gender
Rogers State University has a total of 3,155 enrolled students for the academic year 2022-2023. 3,046 students have enrolled in undergraduate programs and 109 students joined graduate programs.
By gender, 1,237 male and 1,918 female students (the male-female ratio is 39:61) are attending the school. The gender distribution is based on the 2022-2023 data.
| Total | Undergraduate | Graduate | |
|---|---|---|---|
| Total | 3,155 | 3,046 | 109 |
| Men | 1,237 | 1,199 | 38 |
| Women | 1,918 | 1,847 | 71 |
Student Distribution by Race/Ethnicity
| Race | Total | Men | Women |
|---|---|---|---|
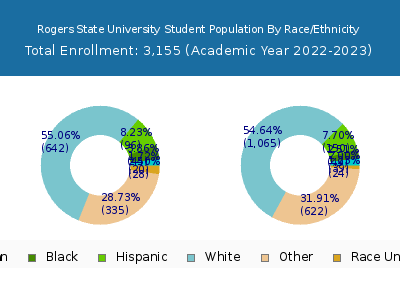
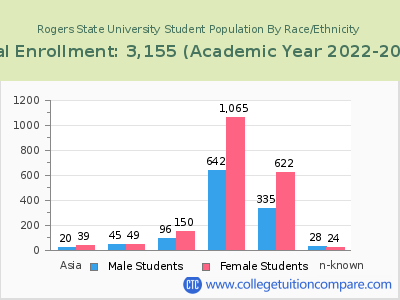
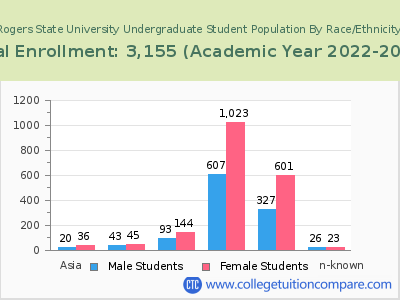
| American Indian or Native American | 587 | 196 | 391 |
| Asian | 63 | 23 | 40 |
| Black | 122 | 55 | 67 |
| Hispanic | 233 | 89 | 144 |
| Native Hawaiian or Other Pacific Islanders | 2 | 0 | 2 |
| White | 1,636 | 653 | 983 |
| Two or more races | 386 | 146 | 240 |
| Race Unknown | 51 | 30 | 21 |
| Race | Total | Men | Women |
|---|---|---|---|
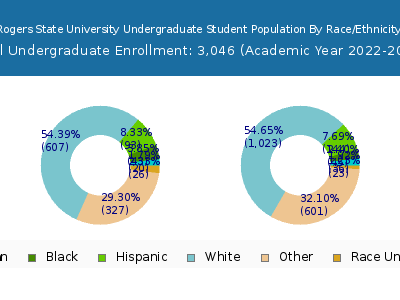
| American Indian or Native American | 572 | 192 | 380 |
| Asian | 61 | 22 | 39 |
| Black | 118 | 53 | 65 |
| Hispanic | 225 | 86 | 139 |
| Native Hawaiian or Other Pacific Islanders | 2 | 0 | 2 |
| White | 1,570 | 628 | 942 |
| Two or more races | 375 | 145 | 230 |
| Race Unknown | 50 | 30 | 20 |
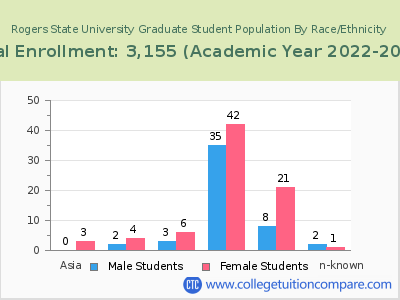
| Race | Total | Men | Women |
|---|---|---|---|
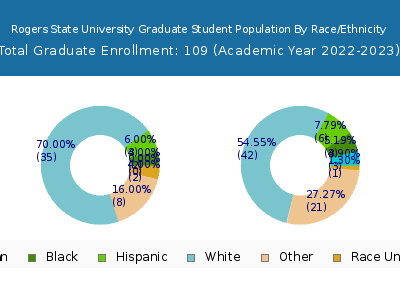
| American Indian or Native American | 42 | 11 | 31 |
| Asian | 7 | 0 | 7 |
| Black | 31 | 12 | 19 |
| Hispanic | 25 | 7 | 18 |
| Native Hawaiian or Other Pacific Islanders | 0 | 0 | 0 |
| White | 139 | 47 | 92 |
| Two or more races | 21 | 7 | 14 |
| Race Unknown | 4 | 2 | 2 |
Student Age Distribution
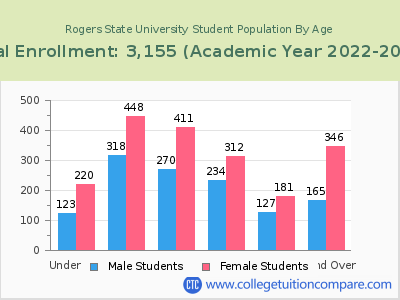
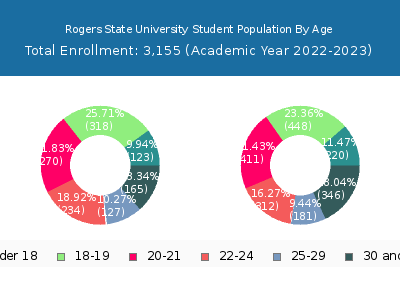
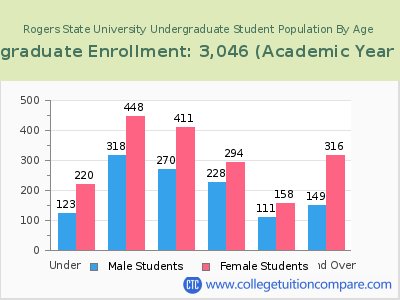
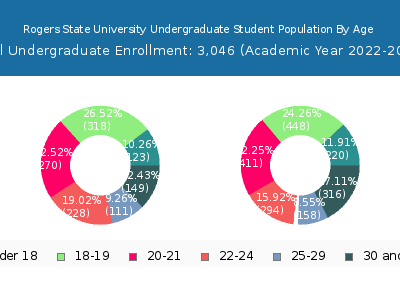
By age, RSU has 343 students under 18 years old and 3 students over 65 years old. There are 2,336 students under 25 years old, and 819 students over 25 years old out of 3,155 total students.
In undergraduate programs, 343 students are younger than 18 and 3 students are older than 65. RSU has 2,312 undergraduate students aged under 25 and 734 students aged 25 and over.
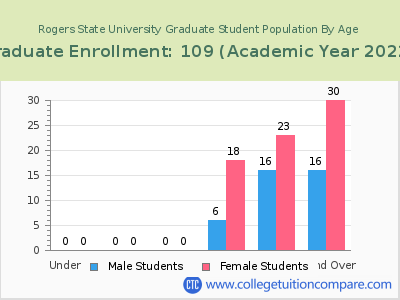
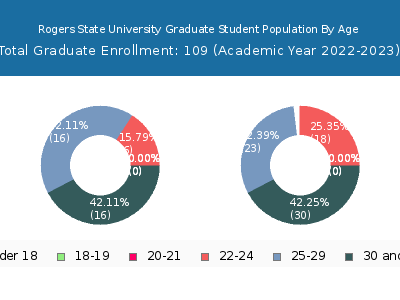
It has 24 graduate students aged under 25 and 85 students aged 25 and over.
| Age | Total | Men | Women |
|---|---|---|---|
| Under 18 | 343 | 220 | 123 |
| 18-19 | 766 | 448 | 318 |
| 20-21 | 681 | 411 | 270 |
| 22-24 | 546 | 312 | 234 |
| 25-29 | 308 | 181 | 127 |
| 30-34 | 191 | 132 | 59 |
| 35-39 | 140 | 95 | 45 |
| 40-49 | 126 | 90 | 36 |
| 50-64 | 51 | 28 | 23 |
| Over 65 | 3 | 1 | 2 |
| Age | Total | Men | Women |
|---|---|---|---|
| Under 18 | 343 | 220 | 123 |
| 18-19 | 766 | 448 | 318 |
| 20-21 | 681 | 411 | 270 |
| 22-24 | 522 | 294 | 228 |
| 25-29 | 269 | 158 | 111 |
| 30-34 | 178 | 122 | 56 |
| 35-39 | 126 | 86 | 40 |
| 40-49 | 114 | 84 | 30 |
| 50-64 | 44 | 23 | 21 |
| Over 65 | 3 | 1 | 2 |
| Age | Total | Men | Women |
|---|
Online Student Enrollment
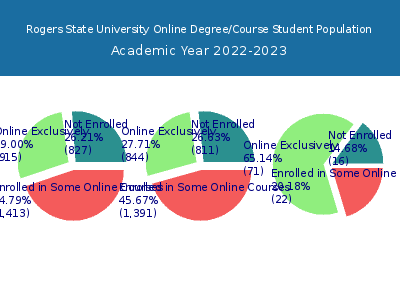
Distance learning, also called online education, is very attractive to students, especially who want to continue education and work in field. At Rogers State University, 915 students are enrolled exclusively in online courses and 1,413 students are enrolled in some online courses.
874 students lived in Oklahoma or jurisdiction in which the school is located are enrolled exclusively in online courses and 41 students live in other State or outside of the United States.
| All Students | Enrolled Exclusively Online Courses | Enrolled in Some Online Courses | |
|---|---|---|---|
| All Students | 3,155 | 915 | 1,413 |
| Undergraduate | 3,046 | 844 | 1,391 |
| Graduate | 109 | 71 | 22 |
| Oklahoma Residents | Other States in U.S. | Outside of U.S. | |
|---|---|---|---|
| All Students | 874 | 41 | 0 |
| Undergraduate | 812 | 32 | 0 |
| Graduate | 62 | 9 | 0 |
Transfer-in Students (Undergraduate)
Among 3,046 enrolled in undergraduate programs, 270 students have transferred-in from other institutions. The percentage of transfer-in students is 8.86%.197 students have transferred in as full-time status and 73 students transferred in as part-time status.
| Number of Students | |
|---|---|
| Regular Full-time | 1,719 |
| Transfer-in Full-time | 197 |
| Regular Part-time | 1,057 |
| Transfer-in Part-time | 73 |
