Student Population by Gender
East Central University has a total of 3,376 enrolled students for the academic year 2022-2023. 2,730 students have enrolled in undergraduate programs and 646 students joined graduate programs.
By gender, 1,285 male and 2,091 female students (the male-female ratio is 38:62) are attending the school. The gender distribution is based on the 2022-2023 data.
| Total | Undergraduate | Graduate | |
|---|---|---|---|
| Total | 3,376 | 2,730 | 646 |
| Men | 1,285 | 1,095 | 190 |
| Women | 2,091 | 1,635 | 456 |
Student Distribution by Race/Ethnicity
| Race | Total | Men | Women |
|---|---|---|---|
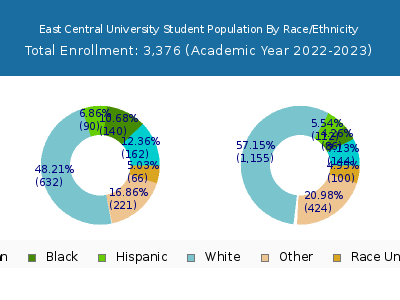
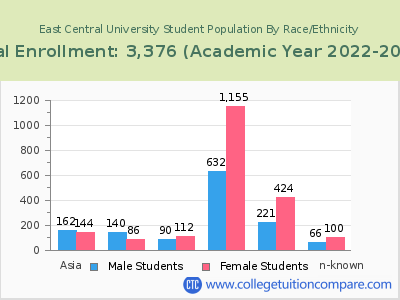
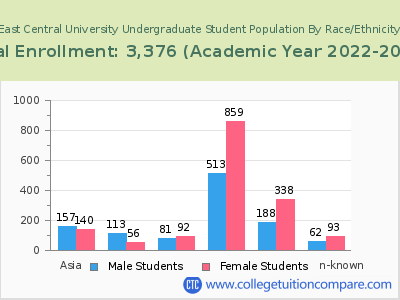
| American Indian or Native American | 604 | 200 | 404 |
| Asian | 186 | 93 | 93 |
| Black | 265 | 176 | 89 |
| Hispanic | 236 | 89 | 147 |
| Native Hawaiian or Other Pacific Islanders | 13 | 8 | 5 |
| White | 1,772 | 600 | 1,172 |
| Two or more races | 90 | 27 | 63 |
| Race Unknown | 128 | 54 | 74 |
| Race | Total | Men | Women |
|---|---|---|---|
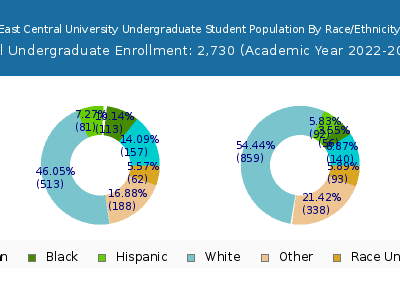
| American Indian or Native American | 510 | 180 | 330 |
| Asian | 180 | 90 | 90 |
| Black | 212 | 141 | 71 |
| Hispanic | 209 | 80 | 129 |
| Native Hawaiian or Other Pacific Islanders | 12 | 7 | 5 |
| White | 1,358 | 495 | 863 |
| Two or more races | 63 | 21 | 42 |
| Race Unknown | 119 | 51 | 68 |
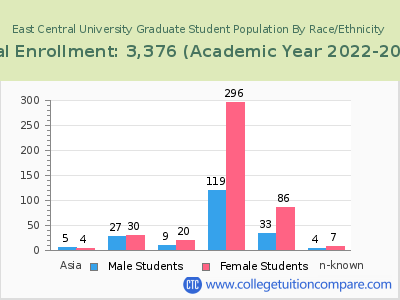
| Race | Total | Men | Women |
|---|---|---|---|
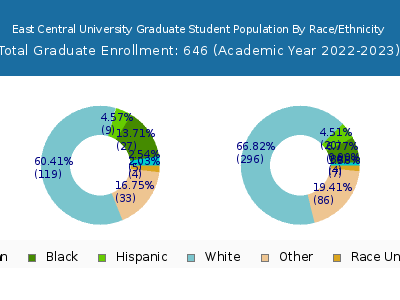
| American Indian or Native American | 166 | 41 | 125 |
| Asian | 6 | 1 | 5 |
| Black | 75 | 46 | 29 |
| Hispanic | 82 | 25 | 57 |
| Native Hawaiian or Other Pacific Islanders | 8 | 6 | 2 |
| White | 426 | 136 | 290 |
| Two or more races | 22 | 6 | 16 |
| Race Unknown | 31 | 17 | 14 |
Student Age Distribution
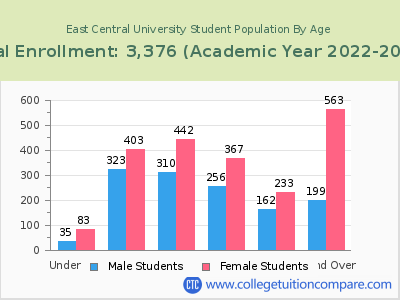
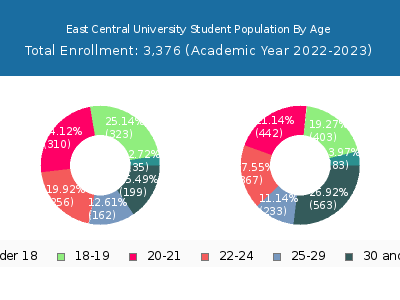
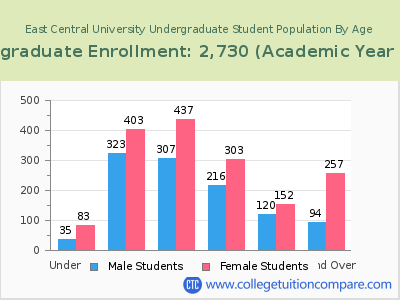
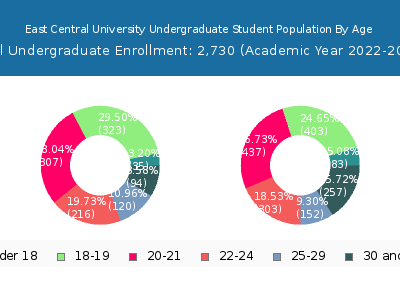
By age, ECU has 118 students under 18 years old and 3 students over 65 years old. There are 2,219 students under 25 years old, and 1,157 students over 25 years old out of 3,376 total students.
In undergraduate programs, 118 students are younger than 18 and 3 students are older than 65. ECU has 2,107 undergraduate students aged under 25 and 623 students aged 25 and over.
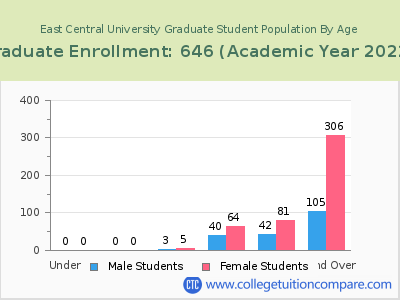
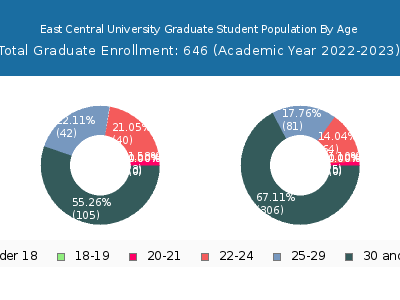
It has 112 graduate students aged under 25 and 534 students aged 25 and over.
| Age | Total | Men | Women |
|---|---|---|---|
| Under 18 | 118 | 83 | 35 |
| 18-19 | 726 | 403 | 323 |
| 20-21 | 752 | 442 | 310 |
| 22-24 | 623 | 367 | 256 |
| 25-29 | 395 | 233 | 162 |
| 30-34 | 213 | 148 | 65 |
| 35-39 | 171 | 132 | 39 |
| 40-49 | 261 | 194 | 67 |
| 50-64 | 114 | 88 | 26 |
| Over 65 | 3 | 1 | 2 |
| Age | Total | Men | Women |
|---|---|---|---|
| Under 18 | 118 | 83 | 35 |
| 18-19 | 726 | 403 | 323 |
| 20-21 | 744 | 437 | 307 |
| 22-24 | 519 | 303 | 216 |
| 25-29 | 272 | 152 | 120 |
| 30-34 | 118 | 84 | 34 |
| 35-39 | 80 | 60 | 20 |
| 40-49 | 103 | 73 | 30 |
| 50-64 | 47 | 39 | 8 |
| Over 65 | 3 | 1 | 2 |
| Age | Total | Men | Women |
|---|
Online Student Enrollment
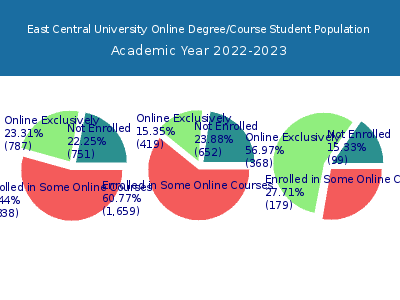
Distance learning, also called online education, is very attractive to students, especially who want to continue education and work in field. At East Central University, 787 students are enrolled exclusively in online courses and 1,838 students are enrolled in some online courses.
678 students lived in Oklahoma or jurisdiction in which the school is located are enrolled exclusively in online courses and 109 students live in other State or outside of the United States.
| All Students | Enrolled Exclusively Online Courses | Enrolled in Some Online Courses | |
|---|---|---|---|
| All Students | 3,376 | 787 | 1,838 |
| Undergraduate | 2,730 | 419 | 1,659 |
| Graduate | 646 | 368 | 179 |
| Oklahoma Residents | Other States in U.S. | Outside of U.S. | |
|---|---|---|---|
| All Students | 678 | 107 | 2 |
| Undergraduate | 368 | 49 | 2 |
| Graduate | 310 | 58 | 0 |
Transfer-in Students (Undergraduate)
Among 2,730 enrolled in undergraduate programs, 816 students have transferred-in from other institutions. The percentage of transfer-in students is 29.89%.629 students have transferred in as full-time status and 187 students transferred in as part-time status.
| Number of Students | |
|---|---|
| Regular Full-time | 1,608 |
| Transfer-in Full-time | 629 |
| Regular Part-time | 306 |
| Transfer-in Part-time | 187 |
