Student Population by Gender
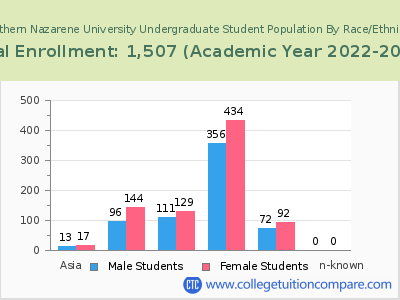
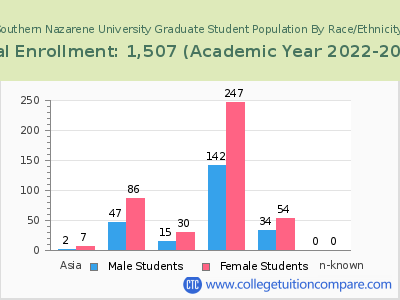
Southern Nazarene University has a total of 1,507 enrolled students for the academic year 2022-2023. 912 students have enrolled in undergraduate programs and 595 students joined graduate programs.
By gender, 688 male and 819 female students (the male-female ratio is 46:54) are attending the school. The gender distribution is based on the 2022-2023 data.
| Total | Undergraduate | Graduate | |
|---|---|---|---|
| Total | 1,507 | 912 | 595 |
| Men | 688 | 458 | 230 |
| Women | 819 | 454 | 365 |
Student Distribution by Race/Ethnicity
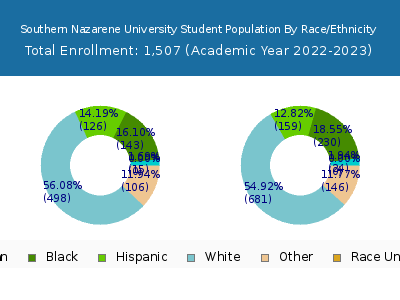
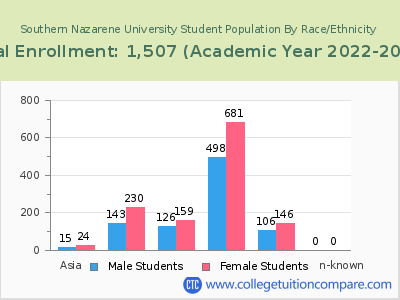
| Race | Total | Men | Women |
|---|---|---|---|
| American Indian or Native American | 59 | 25 | 34 |
| Asian | 23 | 11 | 12 |
| Black | 203 | 108 | 95 |
| Hispanic | 256 | 121 | 135 |
| Native Hawaiian or Other Pacific Islanders | 3 | 1 | 2 |
| White | 797 | 341 | 456 |
| Two or more races | 118 | 49 | 69 |
| Race Unknown | 0 | 0 | 0 |
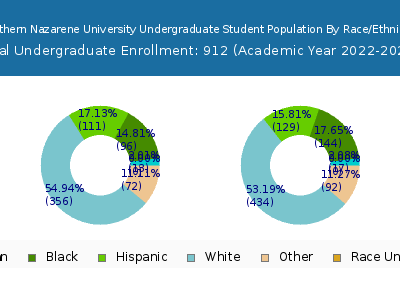
| Race | Total | Men | Women |
|---|---|---|---|
| American Indian or Native American | 23 | 7 | 16 |
| Asian | 15 | 6 | 9 |
| Black | 89 | 61 | 28 |
| Hispanic | 202 | 103 | 99 |
| Native Hawaiian or Other Pacific Islanders | 2 | 1 | 1 |
| White | 460 | 221 | 239 |
| Two or more races | 89 | 38 | 51 |
| Race Unknown | 0 | 0 | 0 |
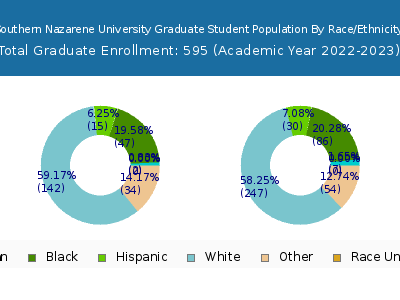
| Race | Total | Men | Women |
|---|---|---|---|
| American Indian or Native American | 3 | 0 | 3 |
| Asian | 1 | 1 | 0 |
| Black | 12 | 9 | 3 |
| Hispanic | 8 | 5 | 3 |
| Native Hawaiian or Other Pacific Islanders | 0 | 0 | 0 |
| White | 27 | 13 | 14 |
| Two or more races | 6 | 2 | 4 |
| Race Unknown | 0 | 0 | 0 |
Student Age Distribution
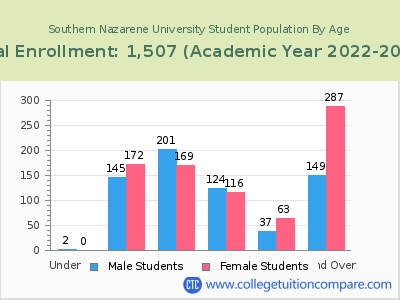
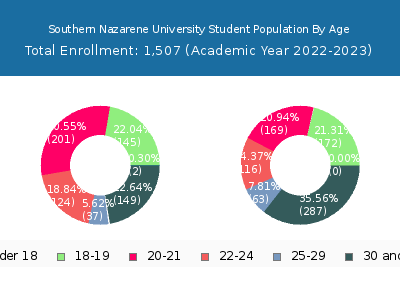
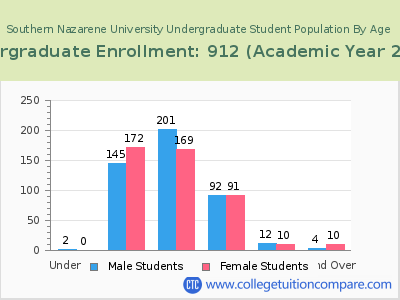
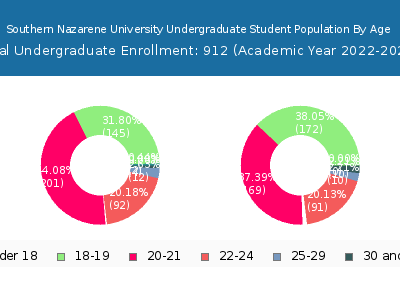
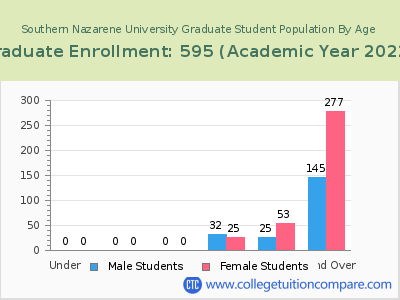
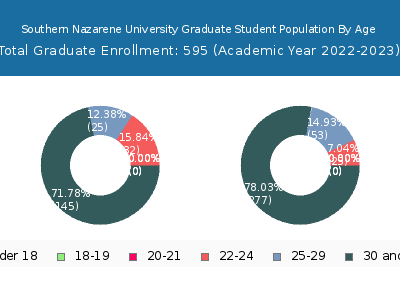
By age, SNU has 2 students under 18 years old and 6 students over 65 years old. There are 929 students under 25 years old, and 536 students over 25 years old out of 1,507 total students.
SNU has 872 undergraduate students aged under 25 and 36 students aged 25 and over.
It has 57 graduate students aged under 25 and 500 students aged 25 and over.
| Age | Total | Men | Women |
|---|---|---|---|
| Under 18 | 2 | 0 | 2 |
| 18-19 | 317 | 172 | 145 |
| 20-21 | 370 | 169 | 201 |
| 22-24 | 240 | 116 | 124 |
| 25-29 | 100 | 63 | 37 |
| 30-34 | 86 | 51 | 35 |
| 35-39 | 117 | 82 | 35 |
| 40-49 | 131 | 88 | 43 |
| 50-64 | 96 | 62 | 34 |
| Over 65 | 6 | 4 | 2 |
| Age | Total | Men | Women |
|---|---|---|---|
| Under 18 | 2 | 0 | 2 |
| 18-19 | 317 | 172 | 145 |
| 20-21 | 370 | 169 | 201 |
| 22-24 | 183 | 91 | 92 |
| 25-29 | 22 | 10 | 12 |
| 30-34 | 7 | 3 | 4 |
| 35-39 | 2 | 2 | 0 |
| 40-49 | 4 | 4 | 0 |
| 50-64 | 1 | 1 | 0 |
| Age | Total | Men | Women |
|---|
Online Student Enrollment
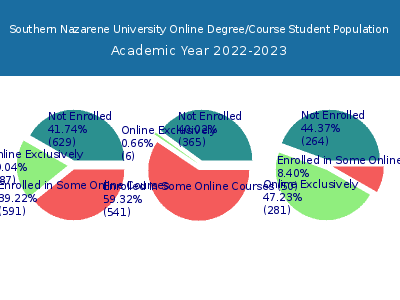
Distance learning, also called online education, is very attractive to students, especially who want to continue education and work in field. At Southern Nazarene University, 287 students are enrolled exclusively in online courses and 591 students are enrolled in some online courses.
265 students lived in Oklahoma or jurisdiction in which the school is located are enrolled exclusively in online courses and 22 students live in other State or outside of the United States.
| All Students | Enrolled Exclusively Online Courses | Enrolled in Some Online Courses | |
|---|---|---|---|
| All Students | 1,507 | 287 | 591 |
| Undergraduate | 912 | 6 | 541 |
| Graduate | 595 | 281 | 50 |
| Oklahoma Residents | Other States in U.S. | Outside of U.S. | |
|---|---|---|---|
| All Students | 265 | 21 | 1 |
| Undergraduate | 5 | - | 1 |
| Graduate | 260 | 21 | 0 |
Transfer-in Students (Undergraduate)
Among 912 enrolled in undergraduate programs, 66 students have transferred-in from other institutions. The percentage of transfer-in students is 7.24%.63 students have transferred in as full-time status and 3 students transferred in as part-time status.
| Number of Students | |
|---|---|
| Regular Full-time | 824 |
| Transfer-in Full-time | 63 |
| Regular Part-time | 22 |
| Transfer-in Part-time | 3 |
