Student Population by Gender
Lourdes University has a total of 1,136 enrolled students for the academic year 2022-2023. 953 students have enrolled in undergraduate programs and 183 students joined graduate programs.
By gender, 457 male and 679 female students (the male-female ratio is 40:60) are attending the school. The gender distribution is based on the 2022-2023 data.
| Total | Undergraduate | Graduate | |
|---|---|---|---|
| Total | 1,136 | 953 | 183 |
| Men | 457 | 396 | 61 |
| Women | 679 | 557 | 122 |
Student Distribution by Race/Ethnicity
| Race | Total | Men | Women |
|---|---|---|---|
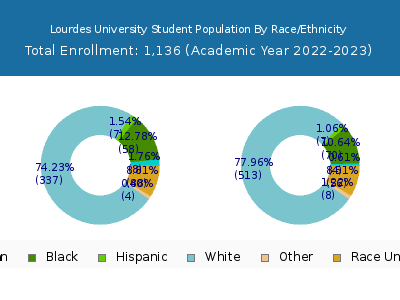
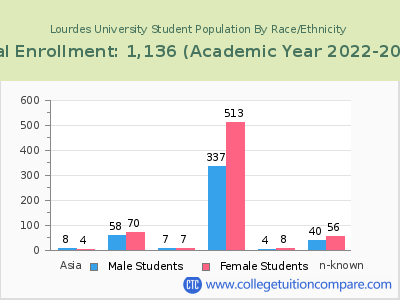
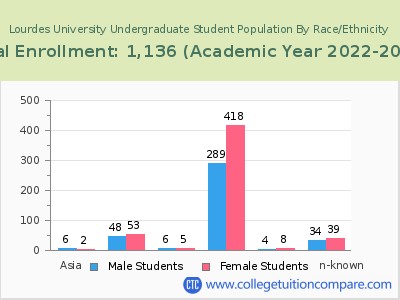
| American Indian or Native American | 7 | 2 | 5 |
| Asian | 18 | 12 | 6 |
| Black | 141 | 58 | 83 |
| Hispanic | 35 | 14 | 21 |
| Native Hawaiian or Other Pacific Islanders | 3 | 1 | 2 |
| White | 875 | 343 | 532 |
| Two or more races | 0 | 0 | 0 |
| Race Unknown | 57 | 27 | 30 |
| Race | Total | Men | Women |
|---|---|---|---|
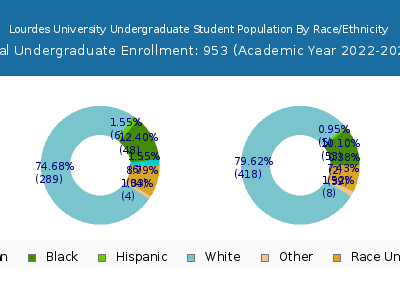
| American Indian or Native American | 7 | 2 | 5 |
| Asian | 12 | 11 | 1 |
| Black | 125 | 54 | 71 |
| Hispanic | 32 | 13 | 19 |
| Native Hawaiian or Other Pacific Islanders | 3 | 1 | 2 |
| White | 738 | 293 | 445 |
| Two or more races | 0 | 0 | 0 |
| Race Unknown | 36 | 22 | 14 |
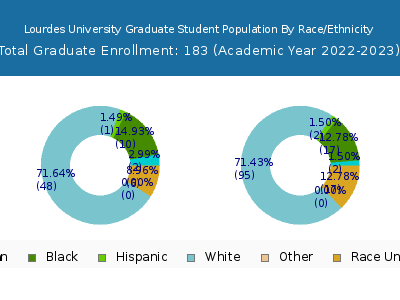
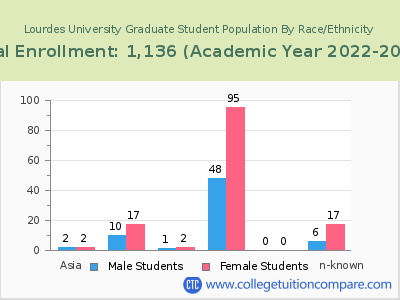
| Race | Total | Men | Women |
|---|---|---|---|
| American Indian or Native American | 0 | 0 | 0 |
| Asian | 2 | 2 | 0 |
| Black | 11 | 6 | 5 |
| Hispanic | 3 | 1 | 2 |
| Native Hawaiian or Other Pacific Islanders | 0 | 0 | 0 |
| White | 36 | 18 | 18 |
| Two or more races | 0 | 0 | 0 |
| Race Unknown | 4 | 4 | 0 |
Student Age Distribution
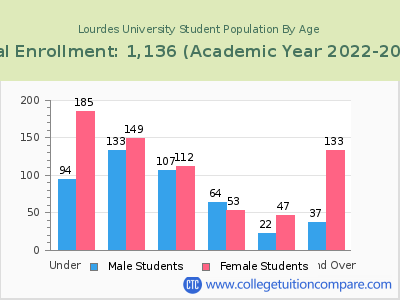
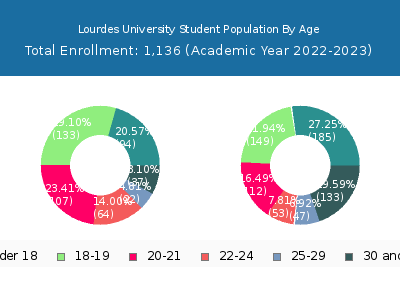
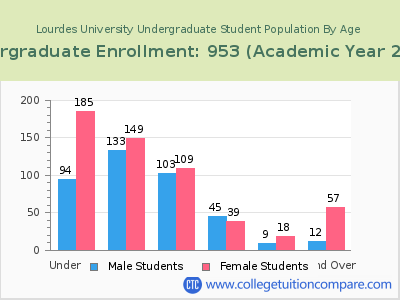
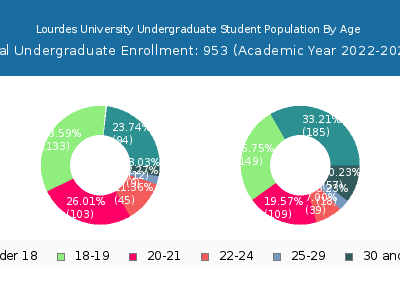
By age, Lourdes has 279 students under 18 years old and 3 students over 65 years old. There are 897 students under 25 years old, and 239 students over 25 years old out of 1,136 total students.
In undergraduate programs, 279 students are younger than 18 and 3 students are older than 65. Lourdes has 857 undergraduate students aged under 25 and 96 students aged 25 and over.
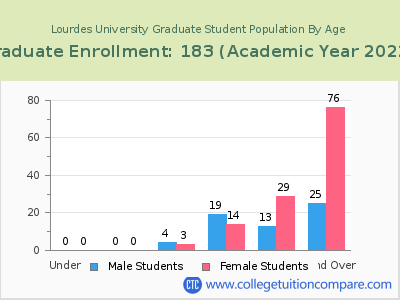
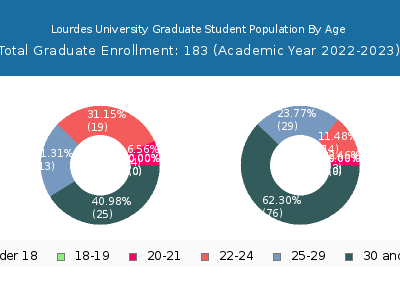
It has 40 graduate students aged under 25 and 143 students aged 25 and over.
| Age | Total | Men | Women |
|---|---|---|---|
| Under 18 | 279 | 185 | 94 |
| 18-19 | 282 | 149 | 133 |
| 20-21 | 219 | 112 | 107 |
| 22-24 | 117 | 53 | 64 |
| 25-29 | 69 | 47 | 22 |
| 30-34 | 51 | 42 | 9 |
| 35-39 | 35 | 23 | 12 |
| 40-49 | 60 | 51 | 9 |
| 50-64 | 21 | 16 | 5 |
| Over 65 | 3 | 1 | 2 |
| Age | Total | Men | Women |
|---|---|---|---|
| Under 18 | 279 | 185 | 94 |
| 18-19 | 282 | 149 | 133 |
| 20-21 | 212 | 109 | 103 |
| 22-24 | 84 | 39 | 45 |
| 25-29 | 27 | 18 | 9 |
| 30-34 | 21 | 18 | 3 |
| 35-39 | 11 | 7 | 4 |
| 40-49 | 25 | 22 | 3 |
| 50-64 | 9 | 9 | 0 |
| Over 65 | 3 | 1 | 2 |
| Age | Total | Men | Women |
|---|
Online Student Enrollment
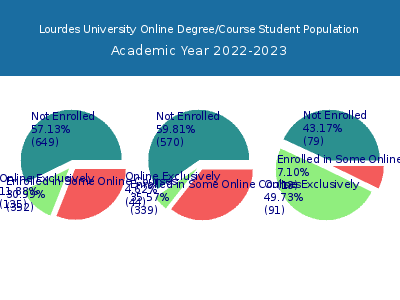
Distance learning, also called online education, is very attractive to students, especially who want to continue education and work in field. At Lourdes University, 135 students are enrolled exclusively in online courses and 352 students are enrolled in some online courses.
87 students lived in Ohio or jurisdiction in which the school is located are enrolled exclusively in online courses and 48 students live in other State or outside of the United States.
| All Students | Enrolled Exclusively Online Courses | Enrolled in Some Online Courses | |
|---|---|---|---|
| All Students | 1,136 | 135 | 352 |
| Undergraduate | 953 | 44 | 339 |
| Graduate | 183 | 91 | 13 |
| Ohio Residents | Other States in U.S. | Outside of U.S. | |
|---|---|---|---|
| All Students | 87 | 47 | 1 |
| Undergraduate | 34 | 10 | 0 |
| Graduate | 53 | 37 | 1 |
Transfer-in Students (Undergraduate)
Among 953 enrolled in undergraduate programs, 56 students have transferred-in from other institutions. The percentage of transfer-in students is 5.88%.51 students have transferred in as full-time status and 5 students transferred in as part-time status.
| Number of Students | |
|---|---|
| Regular Full-time | 642 |
| Transfer-in Full-time | 51 |
| Regular Part-time | 255 |
| Transfer-in Part-time | 5 |
