Student Population by Gender
Denison University has a total of 2,416 enrolled students for the academic year 2022-2023. All 2,416 students are enrolled into undergraduate programs.
By gender, 1,154 male and 1,262 female students (the male-female ratio is 48:52) are attending the school. The gender distribution is based on the 2022-2023 data.
| Undergraduate | |
|---|---|
| Total | 2,416 |
| Men | 1,154 |
| Women | 1,262 |
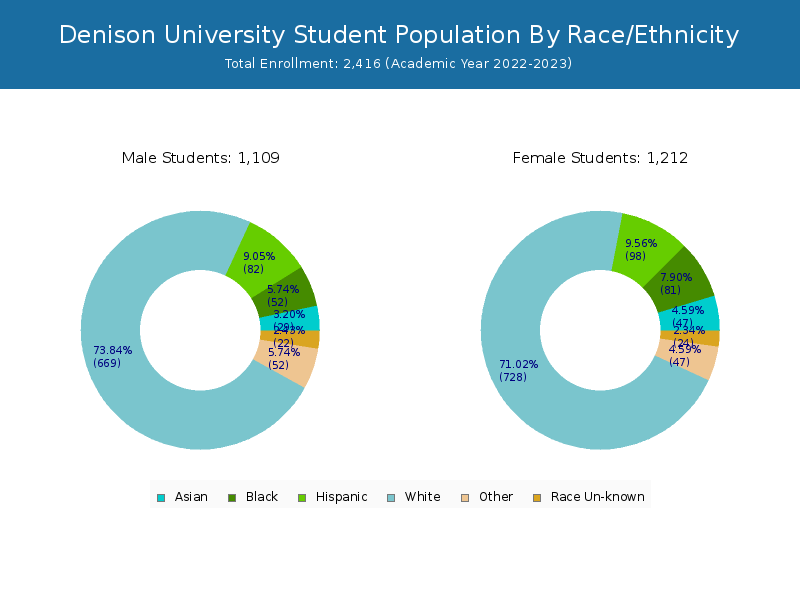
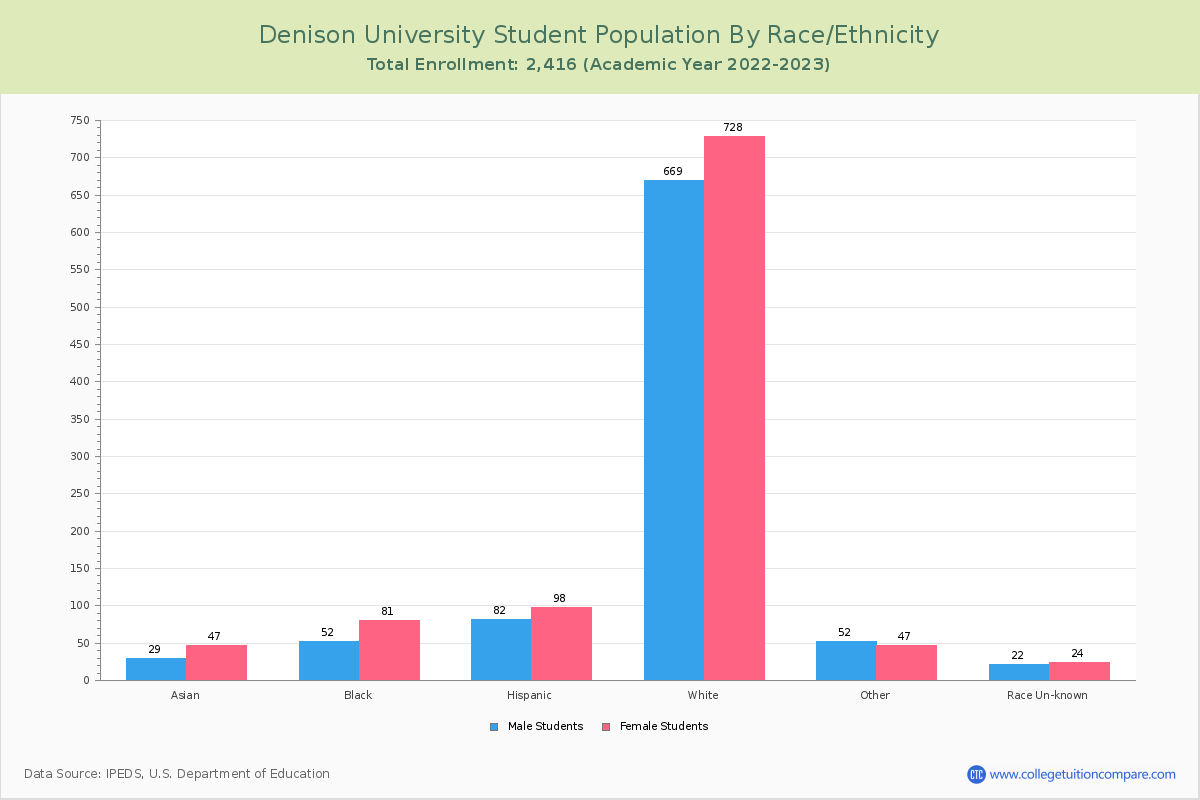
Student Distribution by Race/Ethnicity
By race/ethnicity, 1,472 White, 137 Black, and 81 Asian students out of a total of 2,416 are attending at Denison University. Comprehensive enrollment statistic data by race/ethnicity is shown in the next chart (Academic year 2022-2023 data).
| Race | Total | Men | Women |
|---|---|---|---|
| American Indian or Native American | 0 | 0 | 0 |
| Asian | 81 | 30 | 51 |
| Black | 137 | 54 | 83 |
| Hispanic | 170 | 72 | 98 |
| Native Hawaiian or Other Pacific Islanders | 1 | 1 | 0 |
| White | 1,472 | 709 | 763 |
| Two or more races | 97 | 48 | 49 |
| Race Unknown | 49 | 24 | 25 |
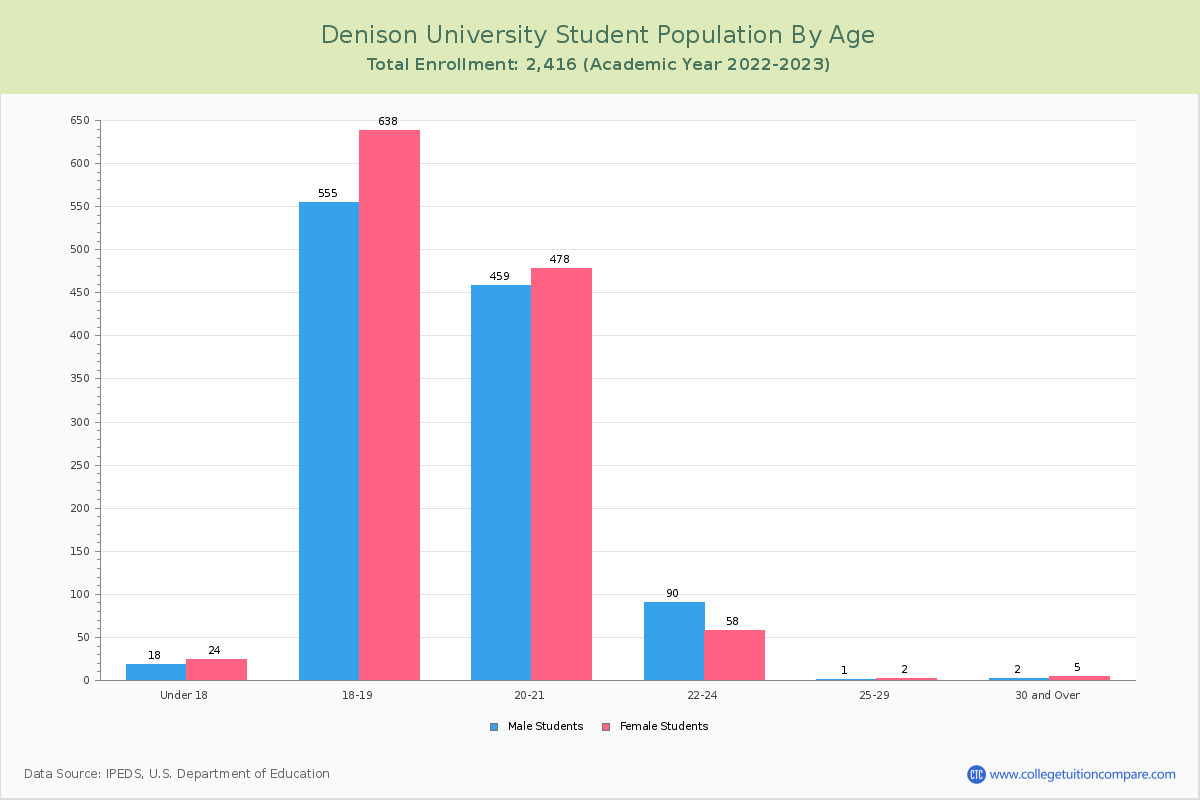
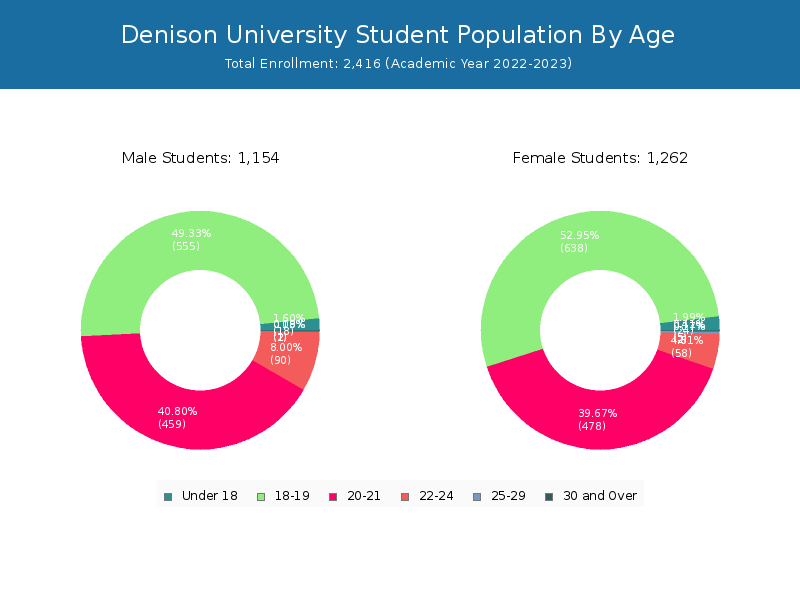
Student Age Distribution
By age, DU has 42 students under 18 years old and 2 students over 65 years old. There are 2,320 students under 25 years old, and 10 students over 25 years old out of 2,416 total students.
| Age | Total | Men | Women |
|---|---|---|---|
| Under 18 | 42 | 24 | 18 |
| 18-19 | 1,193 | 638 | 555 |
| 20-21 | 937 | 478 | 459 |
| 22-24 | 148 | 58 | 90 |
| 25-29 | 3 | 2 | 1 |
| 30-34 | 1 | 0 | 1 |
Transfer-in Students (Undergraduate)
Among 2,416 enrolled in undergraduate programs, 23 students have transferred-in from other institutions. The percentage of transfer-in students is 0.95%.
| Number of Students | |
|---|---|
| Regular Full-time | 2,377 |
| Transfer-in Full-time | 23 |