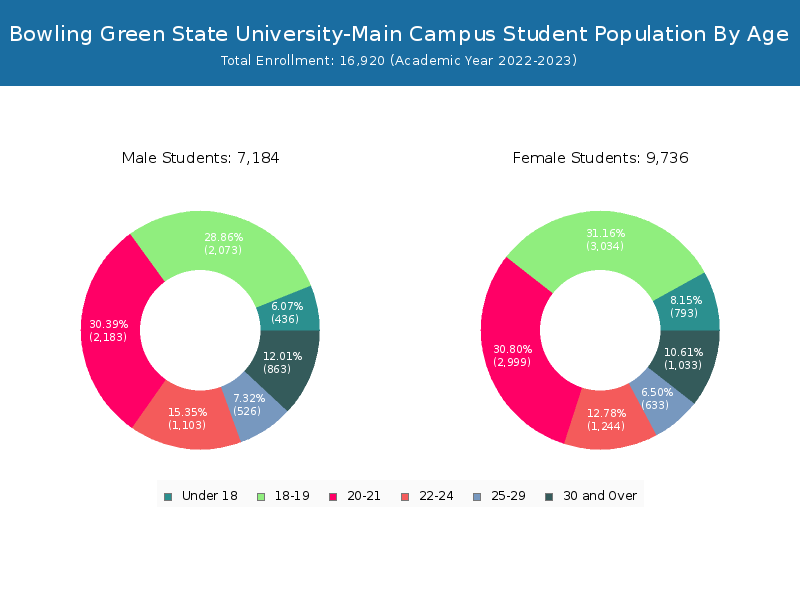
Student Population by Gender
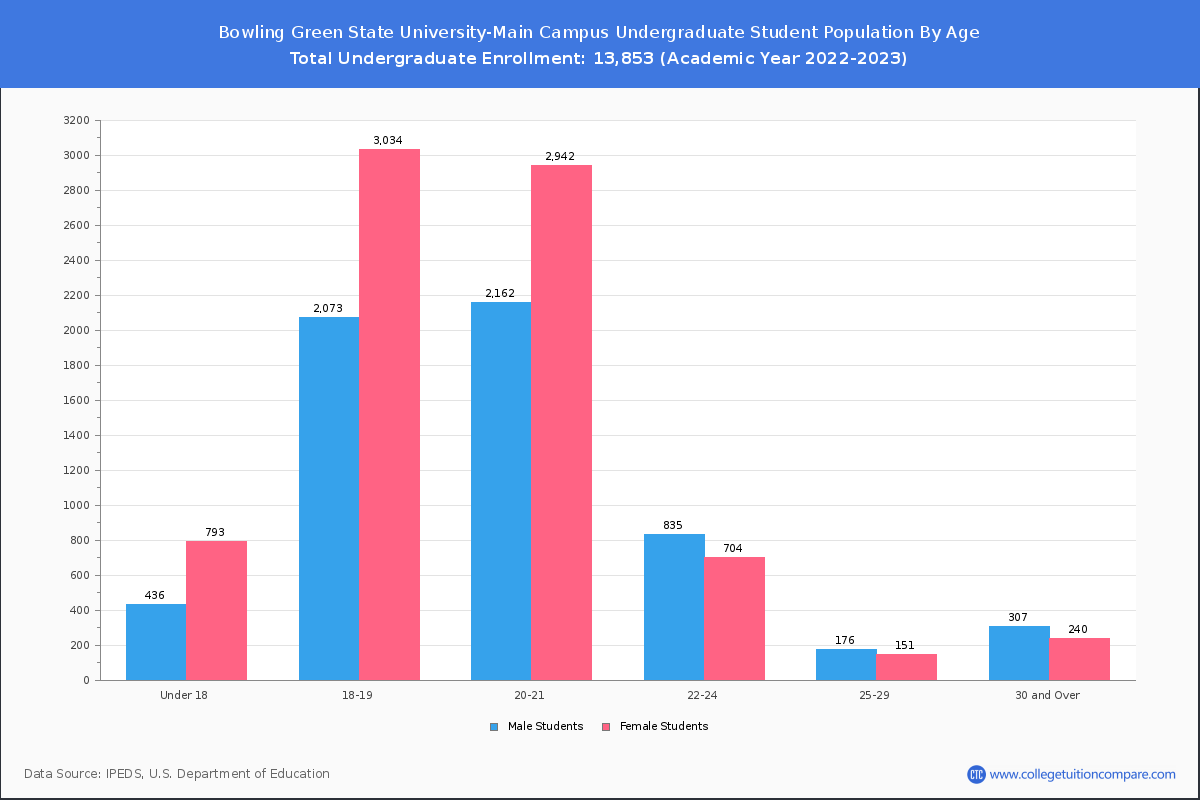
Bowling Green State University-Main Campus has a total of 16,920 enrolled students for the academic year 2022-2023. 13,853 students have enrolled in undergraduate programs and 3,067 students joined graduate programs.
By gender, 7,184 male and 9,736 female students (the male-female ratio is 42:58) are attending the school. The gender distribution is based on the 2022-2023 data.
| Total | Undergraduate | Graduate | |
|---|---|---|---|
| Total | 16,920 | 13,853 | 3,067 |
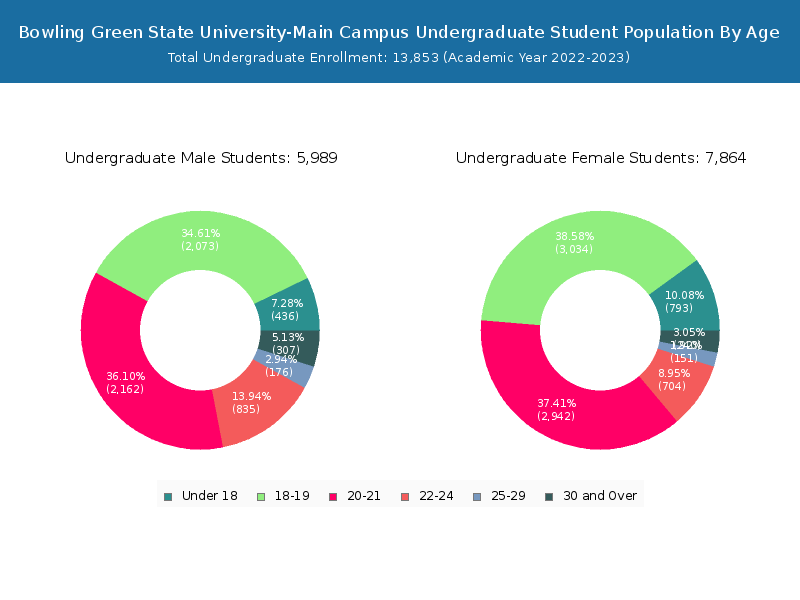
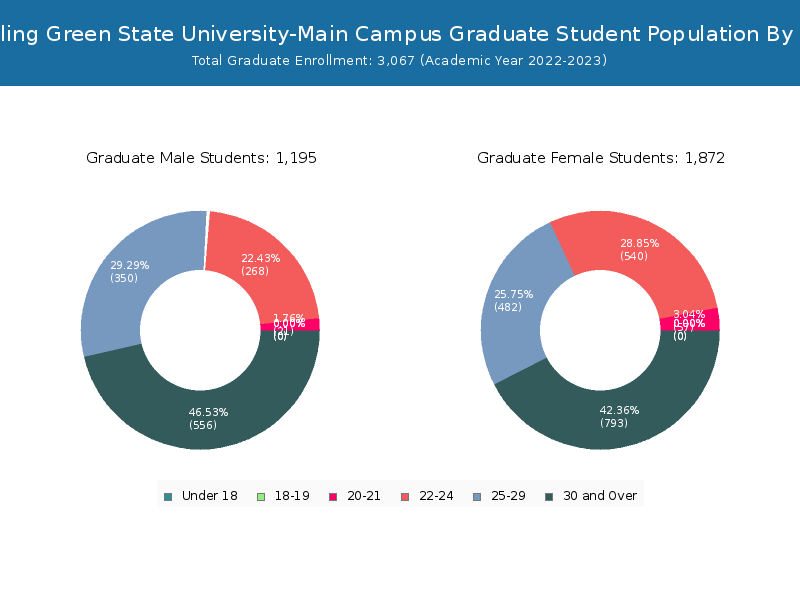
| Men | 7,184 | 5,989 | 1,195 |
| Women | 9,736 | 7,864 | 1,872 |

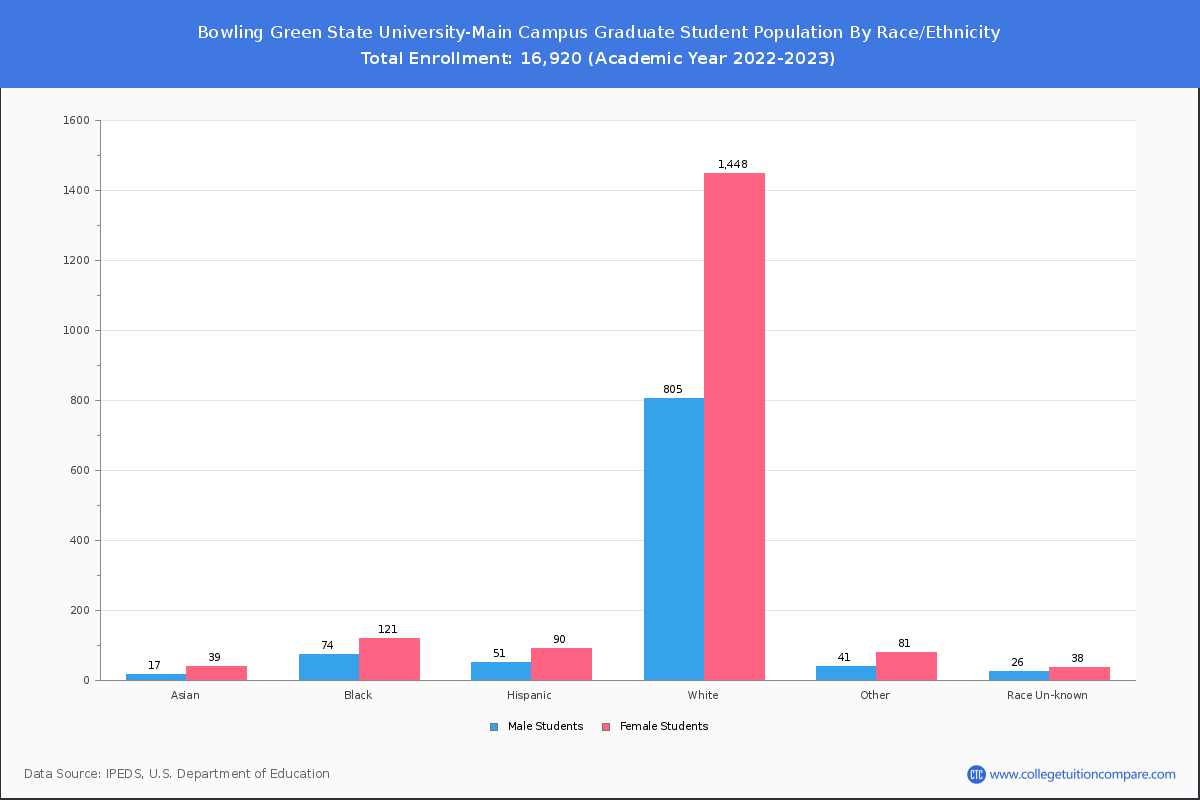
Student Distribution by Race/Ethnicity
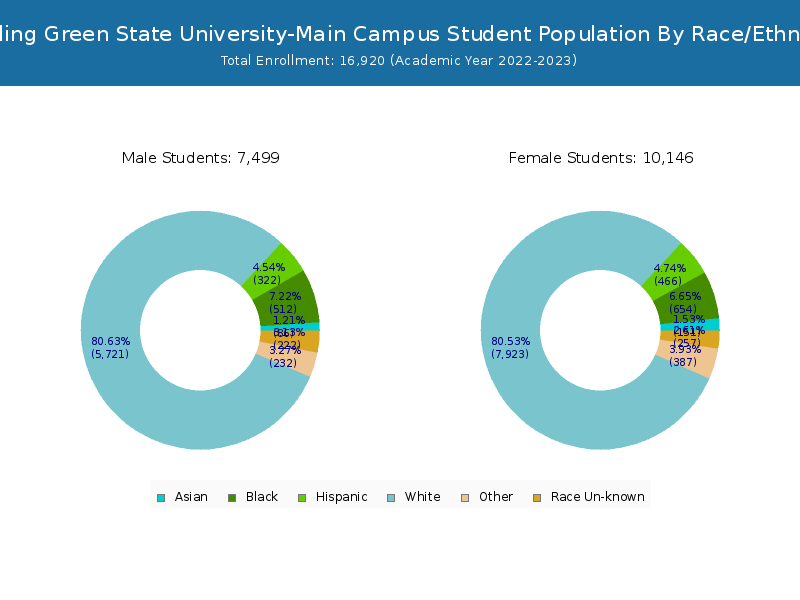
By race/ethnicity, 12,965 White, 1,049 Black, and 230 Asian students out of a total of 16,920 are attending at Bowling Green State University-Main Campus. Comprehensive enrollment statistic data by race/ethnicity is shown in the next chart (Academic year 2022-2023 data).
| Race | Total | Men | Women |
|---|---|---|---|
| American Indian or Native American | 20 | 9 | 11 |
| Asian | 230 | 88 | 142 |
| Black | 1,049 | 444 | 605 |
| Hispanic | 799 | 347 | 452 |
| Native Hawaiian or Other Pacific Islanders | 13 | 8 | 5 |
| White | 12,965 | 5,397 | 7,568 |
| Two or more races | 556 | 208 | 348 |
| Race Unknown | 491 | 228 | 263 |
| Race | Total | Men | Women |
|---|---|---|---|
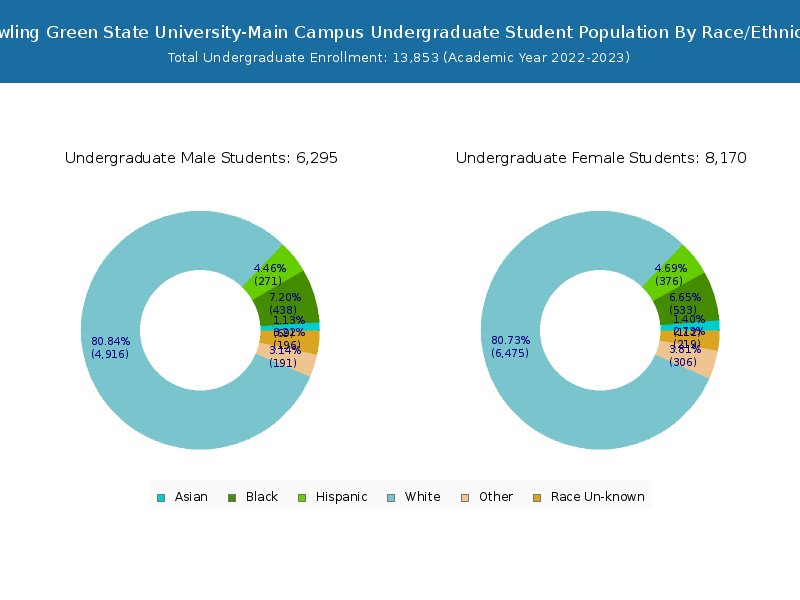
| American Indian or Native American | 18 | 8 | 10 |
| Asian | 169 | 66 | 103 |
| Black | 852 | 380 | 472 |
| Hispanic | 672 | 294 | 378 |
| Native Hawaiian or Other Pacific Islanders | 11 | 7 | 4 |
| White | 10,889 | 4,648 | 6,241 |
| Two or more races | 453 | 174 | 279 |
| Race Unknown | 431 | 197 | 234 |
| Race | Total | Men | Women |
|---|---|---|---|
| American Indian or Native American | 0 | 0 | 0 |
| Asian | 8 | 4 | 4 |
| Black | 36 | 23 | 13 |
| Hispanic | 26 | 14 | 12 |
| Native Hawaiian or Other Pacific Islanders | 1 | 1 | 0 |
| White | 345 | 170 | 175 |
| Two or more races | 13 | 5 | 8 |
| Race Unknown | 18 | 12 | 6 |
Student Age Distribution
By age, BGSU has 1,229 students under 18 years old and 7 students over 65 years old. There are 13,865 students under 25 years old, and 3,055 students over 25 years old out of 16,920 total students.
In undergraduate programs, 1,229 students are younger than 18 and 2 students are older than 65. BGSU has 12,979 undergraduate students aged under 25 and 874 students aged 25 and over.
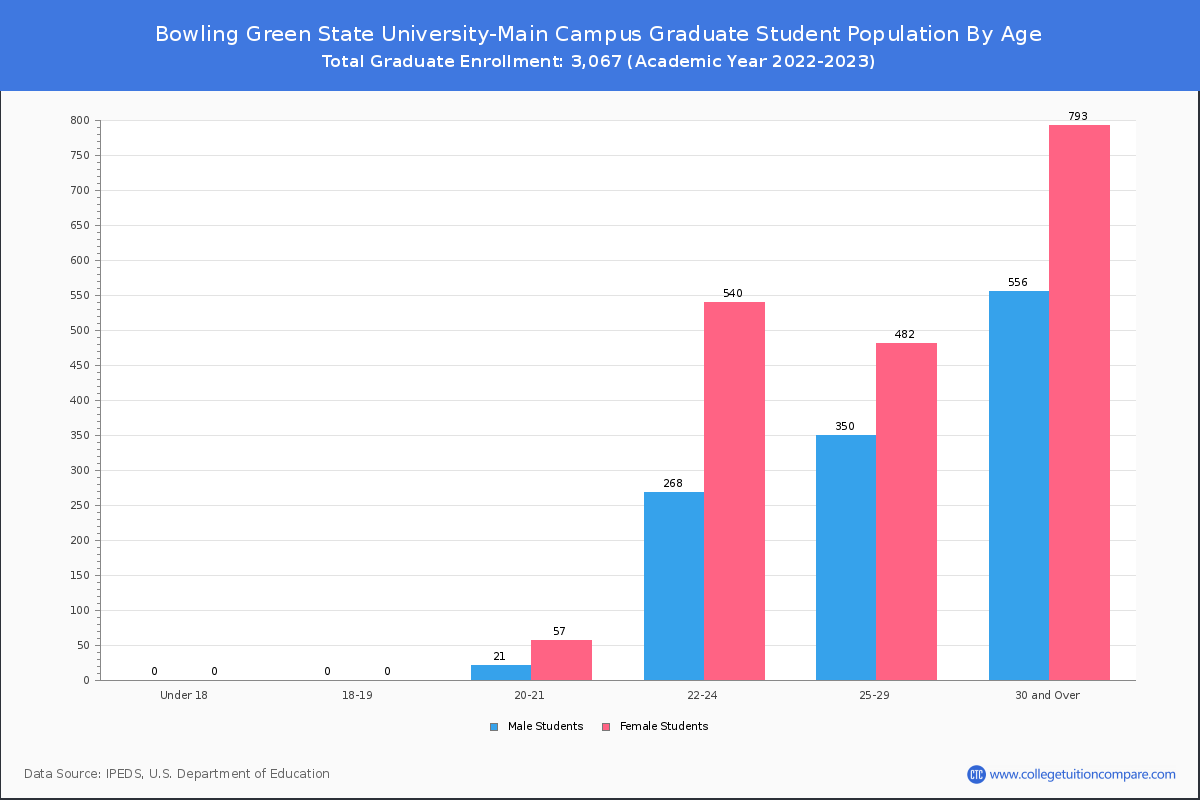
It has 886 graduate students aged under 25 and 2,181 students aged 25 and over.
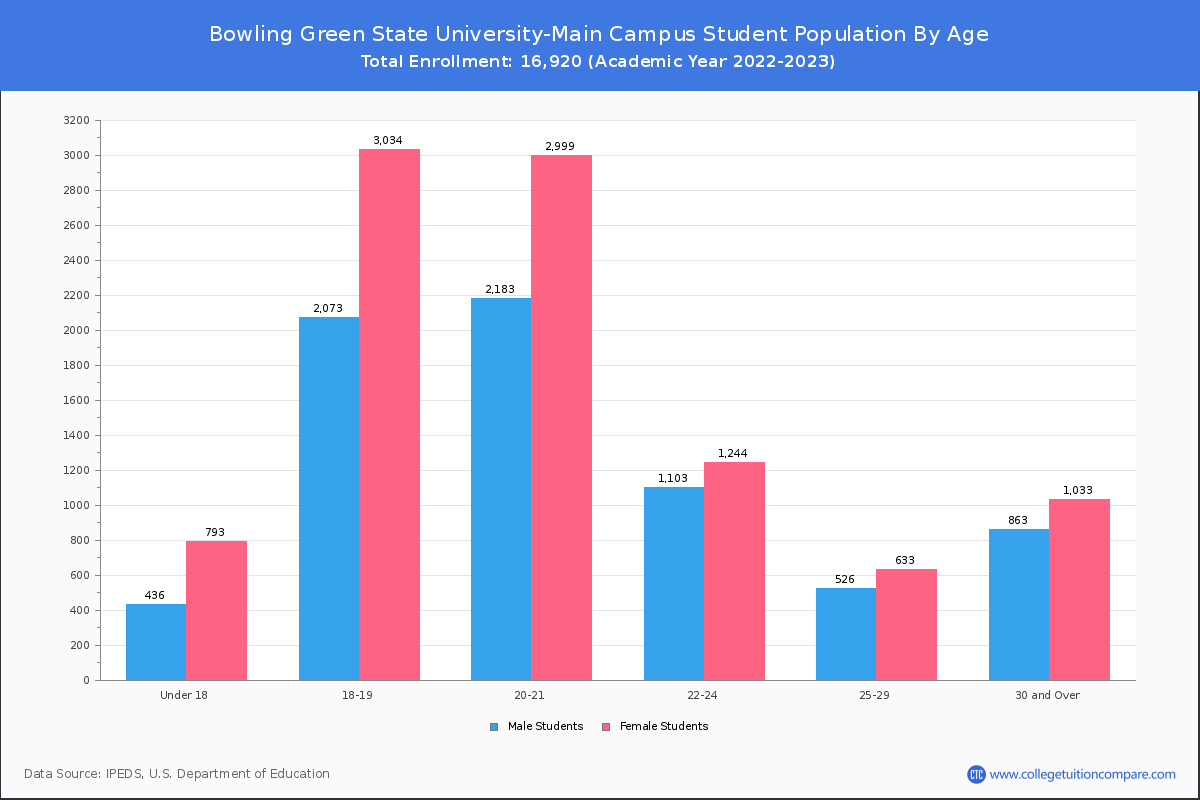
| Age | Total | Men | Women |
|---|---|---|---|
| Under 18 | 1,229 | 793 | 436 |
| 18-19 | 5,107 | 3,034 | 2,073 |
| 20-21 | 5,182 | 2,999 | 2,183 |
| 22-24 | 2,347 | 1,244 | 1,103 |
| 25-29 | 1,159 | 633 | 526 |
| 30-34 | 638 | 343 | 295 |
| 35-39 | 467 | 235 | 232 |
| 40-49 | 528 | 303 | 225 |
| 50-64 | 256 | 148 | 108 |
| Over 65 | 7 | 4 | 3 |
| Age | Total | Men | Women |
|---|---|---|---|
| Under 18 | 1,229 | 793 | 436 |
| 18-19 | 5,107 | 3,034 | 2,073 |
| 20-21 | 5,104 | 2,942 | 2,162 |
| 22-24 | 1,539 | 704 | 835 |
| 25-29 | 327 | 151 | 176 |
| 30-34 | 164 | 76 | 88 |
| 35-39 | 145 | 60 | 85 |
| 40-49 | 164 | 77 | 87 |
| 50-64 | 72 | 26 | 46 |
| Over 65 | 2 | 1 | 1 |
| Age | Total | Men | Women |
|---|
Online Student Enrollment
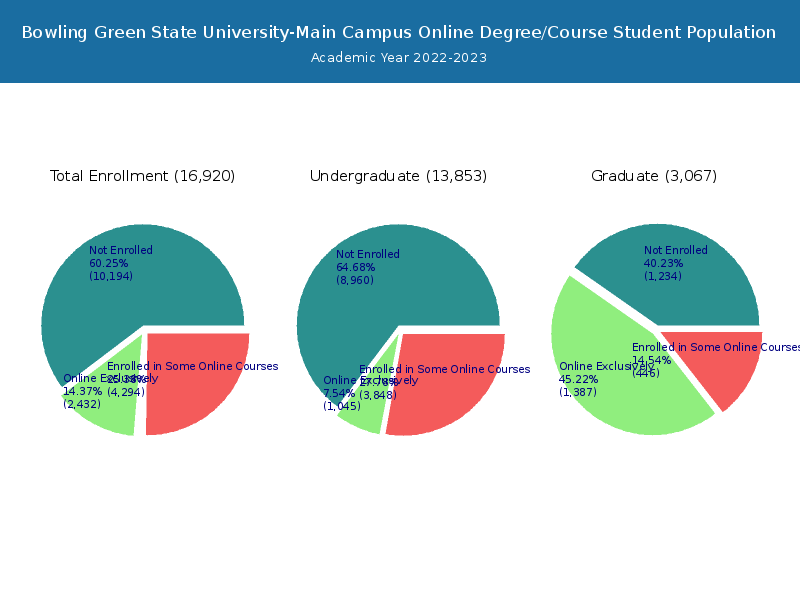
Distance learning, also called online education, is very attractive to students, especially who want to continue education and work in field. At Bowling Green State University-Main Campus, 2,432 students are enrolled exclusively in online courses and 4,294 students are enrolled in some online courses.
2,006 students lived in Ohio or jurisdiction in which the school is located are enrolled exclusively in online courses and 426 students live in other State or outside of the United States.
| All Students | Enrolled Exclusively Online Courses | Enrolled in Some Online Courses | |
|---|---|---|---|
| All Students | 16,920 | 2,432 | 4,294 |
| Undergraduate | 13,853 | 1,045 | 3,848 |
| Graduate | 3,067 | 1,387 | 446 |
| Ohio Residents | Other States in U.S. | Outside of U.S. | |
|---|---|---|---|
| All Students | 2,006 | 415 | 11 |
| Undergraduate | 914 | 126 | 5 |
| Graduate | 1,092 | 289 | 6 |
Transfer-in Students (Undergraduate)
Among 13,853 enrolled in undergraduate programs, 457 students have transferred-in from other institutions. The percentage of transfer-in students is 3.30%.399 students have transferred in as full-time status and 58 students transferred in as part-time status.
| Number of Students | |
|---|---|
| Regular Full-time | 11,182 |
| Transfer-in Full-time | 399 |
| Regular Part-time | 2,214 |
| Transfer-in Part-time | 58 |