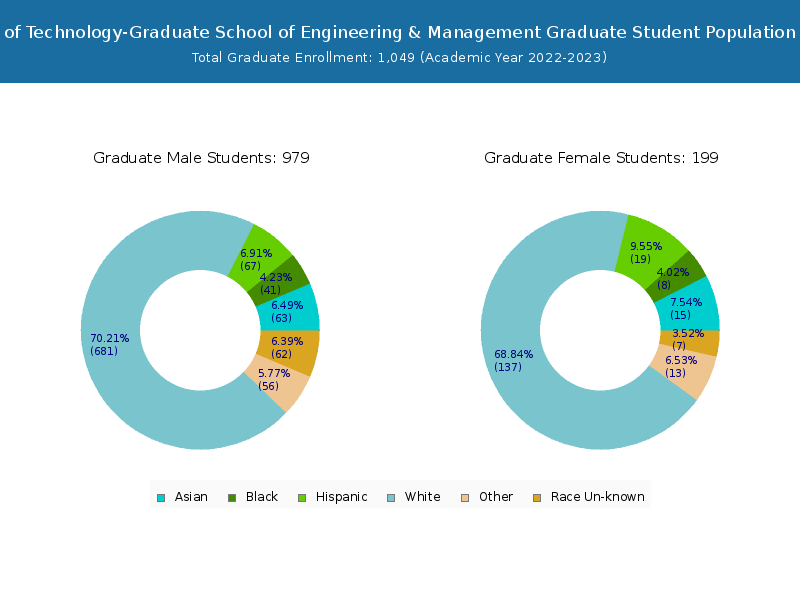
Student Population by Gender
Air Force Institute of Technology-Graduate School of Engineering & Management has a total of 1,048 enrolled students for the academic year 2022-2023. All 1,048 students are enrolled into graduate programs.
By gender, 859 male and 189 female students (the male-female ratio is 82:18) are attending the school. The gender distribution is based on the 2022-2023 data.
| Graduate | |
|---|---|
| Total | 1,048 |
| Men | 859 |
| Women | 189 |
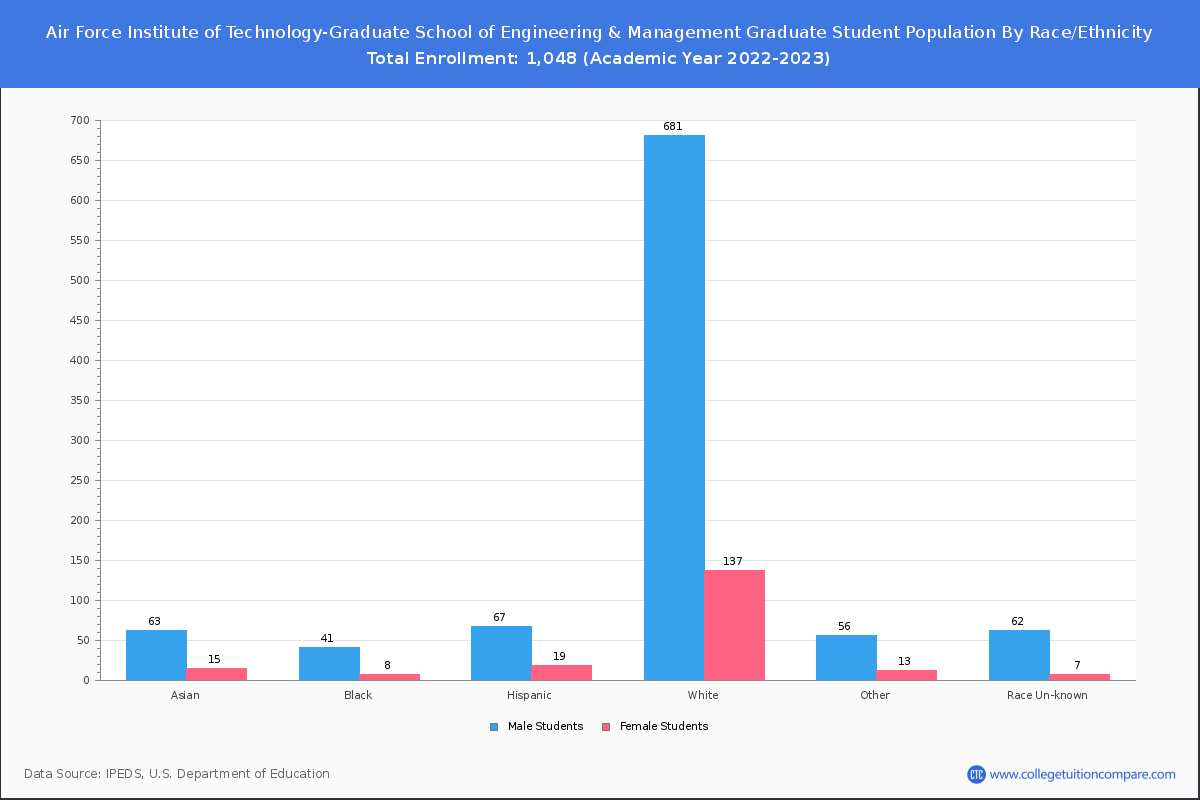
Student Distribution by Race/Ethnicity
By race/ethnicity, 733 White, 50 Black, and 69 Asian students out of a total of 1,048 are attending at Air Force Institute of Technology-Graduate School of Engineering & Management. Comprehensive enrollment statistic data by race/ethnicity is shown in the next chart (Academic year 2022-2023 data).
| Race | Total | Men | Women |
|---|---|---|---|
| American Indian or Native American | 3 | 2 | 1 |
| Asian | 69 | 62 | 7 |
| Black | 50 | 35 | 15 |
| Hispanic | 65 | 52 | 13 |
| Native Hawaiian or Other Pacific Islanders | 10 | 8 | 2 |
| White | 733 | 600 | 133 |
| Two or more races | 52 | 39 | 13 |
| Race Unknown | 52 | 47 | 5 |
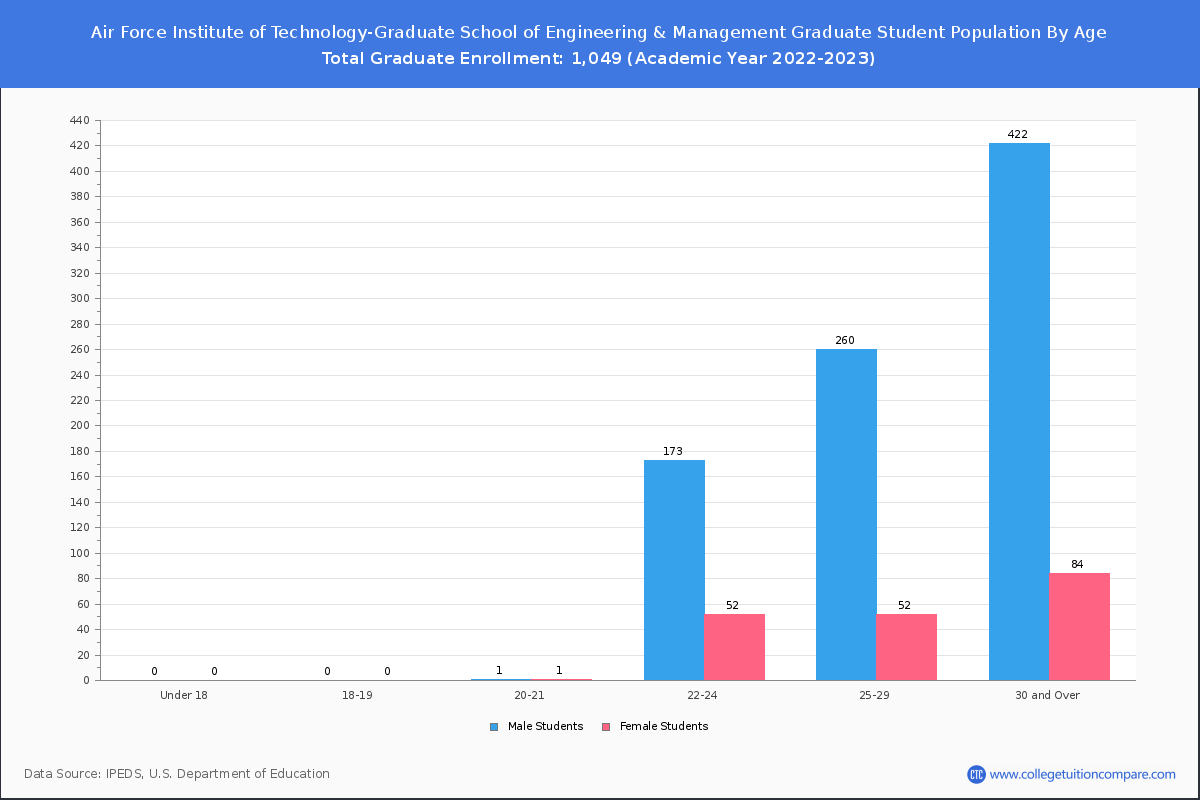
Student Age Distribution
There are 227 students under 25 years old, and 818 students over 25 years old out of 1,048 total students.

| Age | Total | Men | Women |
|---|
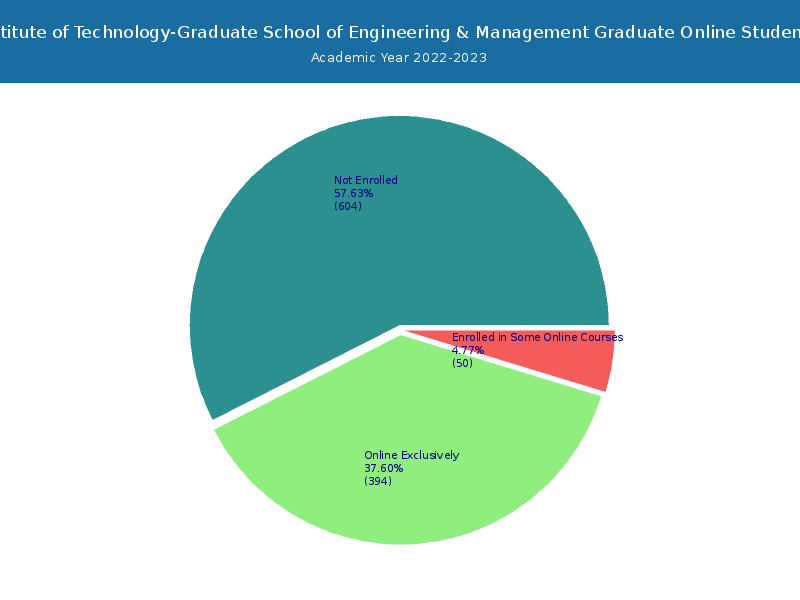
Online Student Enrollment
Distance learning, also called online education, is very attractive to students, especially who want to continue education and work in field. At Air Force Institute of Technology-Graduate School of Engineering & Management, 394 students are enrolled exclusively in online courses and 50 students are enrolled in some online courses.
| All Students | Enrolled Exclusively Online Courses | Enrolled in Some Online Courses | |
|---|---|---|---|
| All Students | 1,048 | 394 | 50 |
| Undergraduate | Undergraduate Program Not Offered | ||
| Graduate | 1,048 | 394 | 50 |
| Ohio Residents | Other States in U.S. | Outside of U.S. | |
|---|---|---|---|
| All Students | 0 | 394 | 0 |
| Undergraduate | - | - | - |
| Graduate | 0 | 394 | 0 |