Student Population by Gender
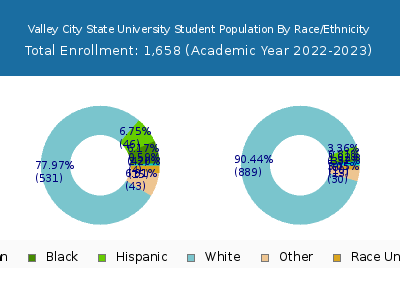
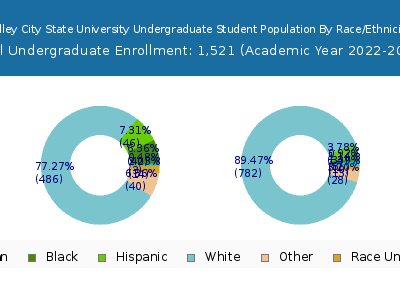
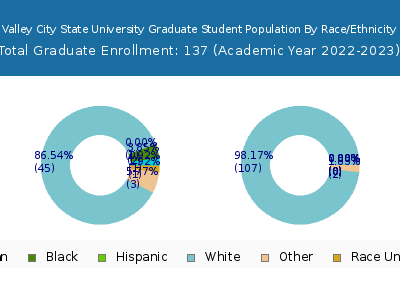
Valley City State University has a total of 1,658 enrolled students for the academic year 2022-2023. 1,521 students have enrolled in undergraduate programs and 137 students joined graduate programs.
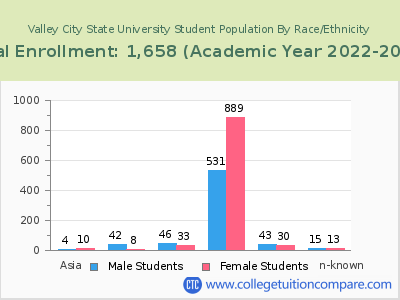
By gender, 685 male and 973 female students (the male-female ratio is 41:59) are attending the school. The gender distribution is based on the 2022-2023 data.
| Total | Undergraduate | Graduate | |
|---|---|---|---|
| Total | 1,658 | 1,521 | 137 |
| Men | 685 | 643 | 42 |
| Women | 973 | 878 | 95 |
Student Distribution by Race/Ethnicity
| Race | Total | Men | Women |
|---|---|---|---|
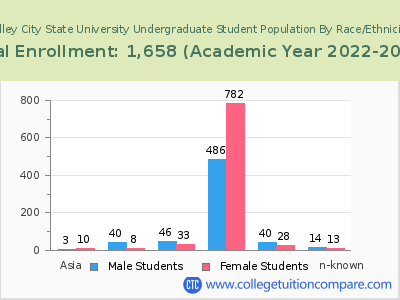
| American Indian or Native American | 14 | 6 | 8 |
| Asian | 7 | 3 | 4 |
| Black | 30 | 27 | 3 |
| Hispanic | 73 | 40 | 33 |
| Native Hawaiian or Other Pacific Islanders | 9 | 8 | 1 |
| White | 1,377 | 534 | 843 |
| Two or more races | 68 | 26 | 42 |
| Race Unknown | 52 | 23 | 29 |
| Race | Total | Men | Women |
|---|---|---|---|
| American Indian or Native American | 12 | 5 | 7 |
| Asian | 6 | 2 | 4 |
| Black | 28 | 25 | 3 |
| Hispanic | 73 | 40 | 33 |
| Native Hawaiian or Other Pacific Islanders | 9 | 8 | 1 |
| White | 1,252 | 499 | 753 |
| Two or more races | 64 | 24 | 40 |
| Race Unknown | 50 | 23 | 27 |
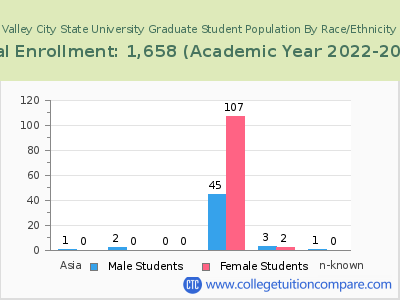
| Race | Total | Men | Women |
|---|---|---|---|
| American Indian or Native American | 1 | 1 | 0 |
| Asian | 1 | 0 | 1 |
| Black | 3 | 3 | 0 |
| Hispanic | 4 | 1 | 3 |
| Native Hawaiian or Other Pacific Islanders | 0 | 0 | 0 |
| White | 77 | 31 | 46 |
| Two or more races | 3 | 1 | 2 |
| Race Unknown | 0 | 0 | 0 |
Student Age Distribution
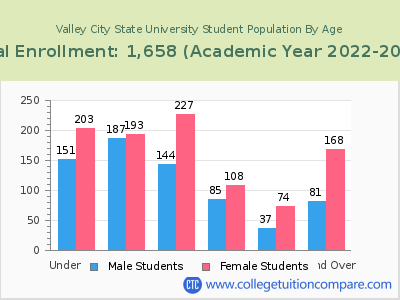
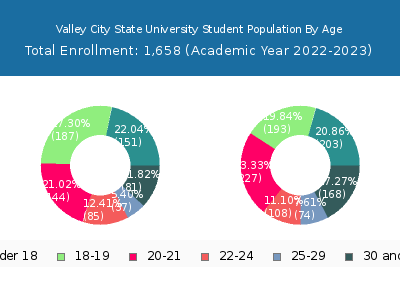
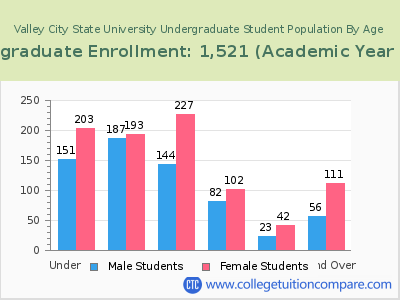
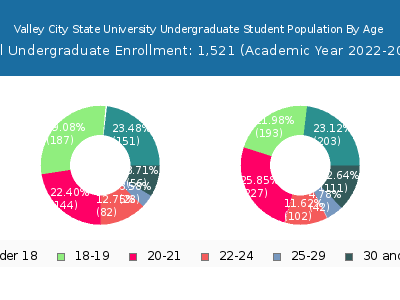
By age, Valley City State has 354 students under 18 years old and 2 students over 65 years old. There are 1,298 students under 25 years old, and 360 students over 25 years old out of 1,658 total students.
In undergraduate programs, 354 students are younger than 18 and 2 students are older than 65. Valley City State has 1,289 undergraduate students aged under 25 and 232 students aged 25 and over.
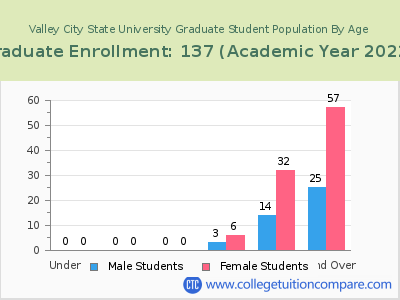
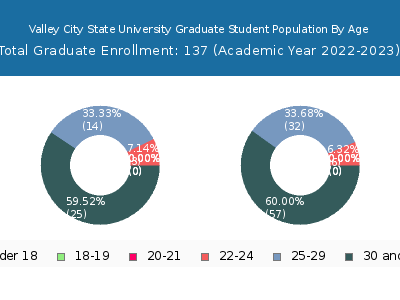
It has 9 graduate students aged under 25 and 128 students aged 25 and over.
| Age | Total | Men | Women |
|---|---|---|---|
| Under 18 | 354 | 203 | 151 |
| 18-19 | 380 | 193 | 187 |
| 20-21 | 371 | 227 | 144 |
| 22-24 | 193 | 108 | 85 |
| 25-29 | 111 | 74 | 37 |
| 30-34 | 66 | 44 | 22 |
| 35-39 | 63 | 46 | 17 |
| 40-49 | 73 | 46 | 27 |
| 50-64 | 45 | 31 | 14 |
| Over 65 | 2 | 1 | 1 |
| Age | Total | Men | Women |
|---|---|---|---|
| Under 18 | 354 | 203 | 151 |
| 18-19 | 380 | 193 | 187 |
| 20-21 | 371 | 227 | 144 |
| 22-24 | 184 | 102 | 82 |
| 25-29 | 65 | 42 | 23 |
| 30-34 | 46 | 31 | 15 |
| 35-39 | 38 | 28 | 10 |
| 40-49 | 47 | 29 | 18 |
| 50-64 | 34 | 22 | 12 |
| Over 65 | 2 | 1 | 1 |
| Age | Total | Men | Women |
|---|
Online Student Enrollment
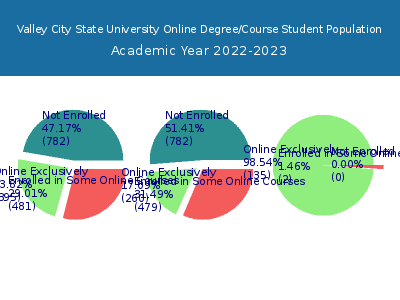
Distance learning, also called online education, is very attractive to students, especially who want to continue education and work in field. At Valley City State University, 395 students are enrolled exclusively in online courses and 481 students are enrolled in some online courses.
264 students lived in North Dakota or jurisdiction in which the school is located are enrolled exclusively in online courses and 131 students live in other State or outside of the United States.
| All Students | Enrolled Exclusively Online Courses | Enrolled in Some Online Courses | |
|---|---|---|---|
| All Students | 1,658 | 395 | 481 |
| Undergraduate | 1,521 | 260 | 479 |
| Graduate | 137 | 135 | 2 |
| North Dakota Residents | Other States in U.S. | Outside of U.S. | |
|---|---|---|---|
| All Students | 264 | 124 | 7 |
| Undergraduate | 151 | 102 | 7 |
| Graduate | 113 | 22 | 0 |
Transfer-in Students (Undergraduate)
Among 1,521 enrolled in undergraduate programs, 94 students have transferred-in from other institutions. The percentage of transfer-in students is 6.18%.61 students have transferred in as full-time status and 33 students transferred in as part-time status.
| Number of Students | |
|---|---|
| Regular Full-time | 762 |
| Transfer-in Full-time | 61 |
| Regular Part-time | 665 |
| Transfer-in Part-time | 33 |
