Student Population by Gender
Mayville State University has a total of 1,123 enrolled students for the academic year 2022-2023. 1,077 students have enrolled in undergraduate programs and 46 students joined graduate programs.
By gender, 407 male and 716 female students (the male-female ratio is 36:64) are attending the school. The gender distribution is based on the 2022-2023 data.
| Total | Undergraduate | Graduate | |
|---|---|---|---|
| Total | 1,123 | 1,077 | 46 |
| Men | 407 | 397 | 10 |
| Women | 716 | 680 | 36 |
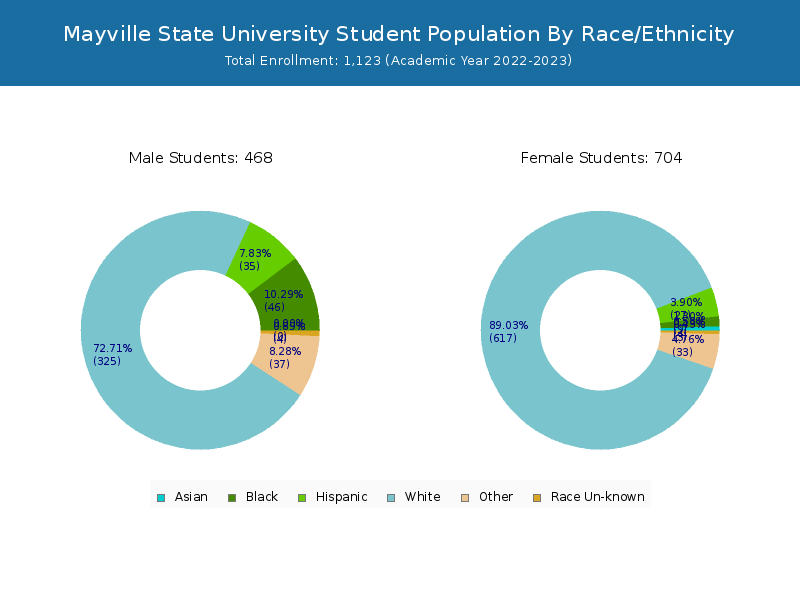
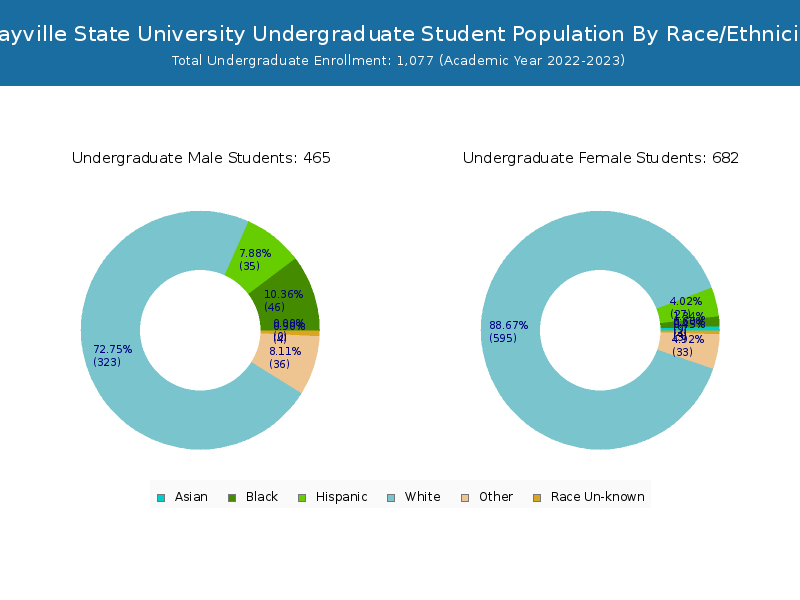
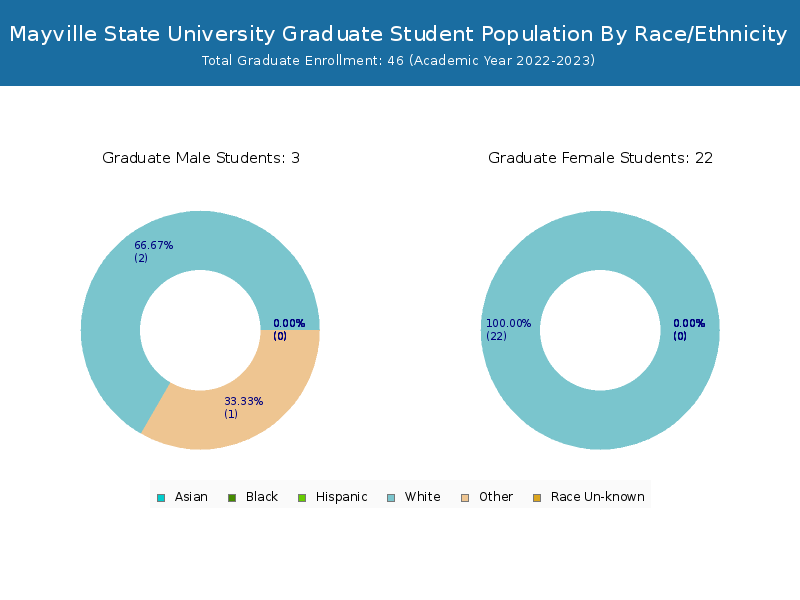
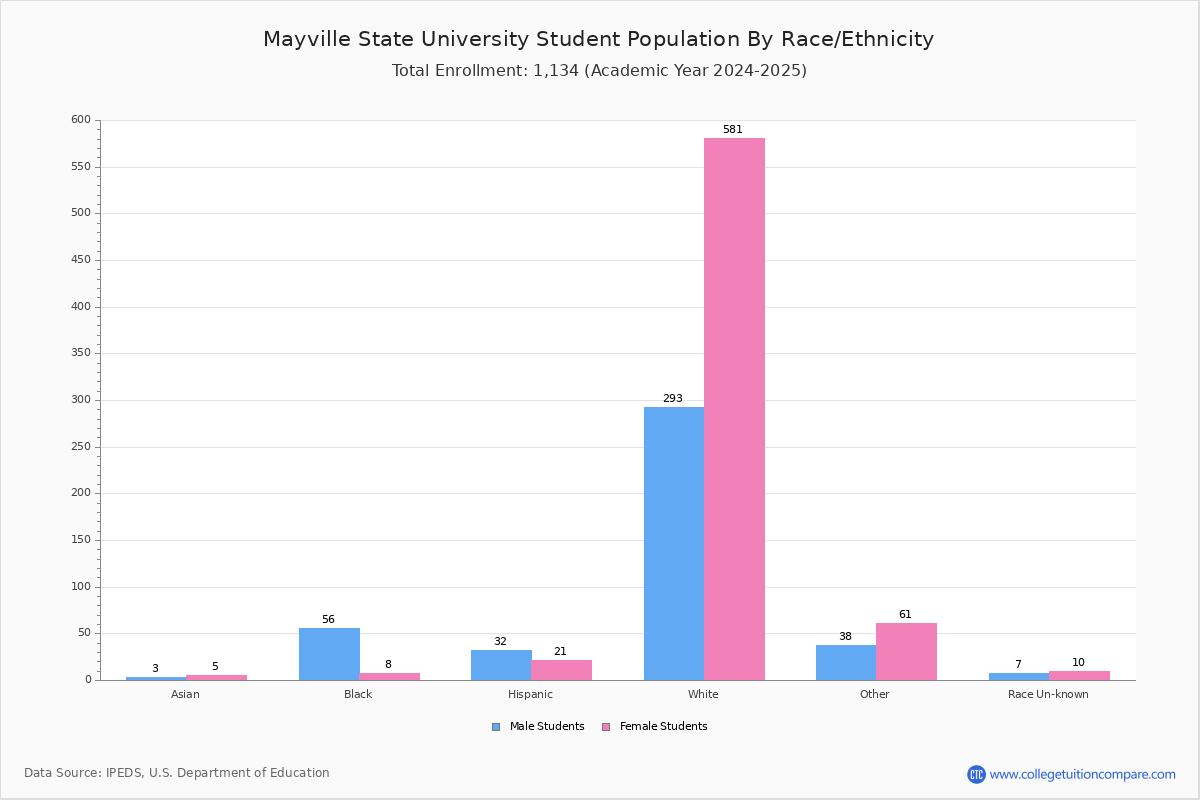
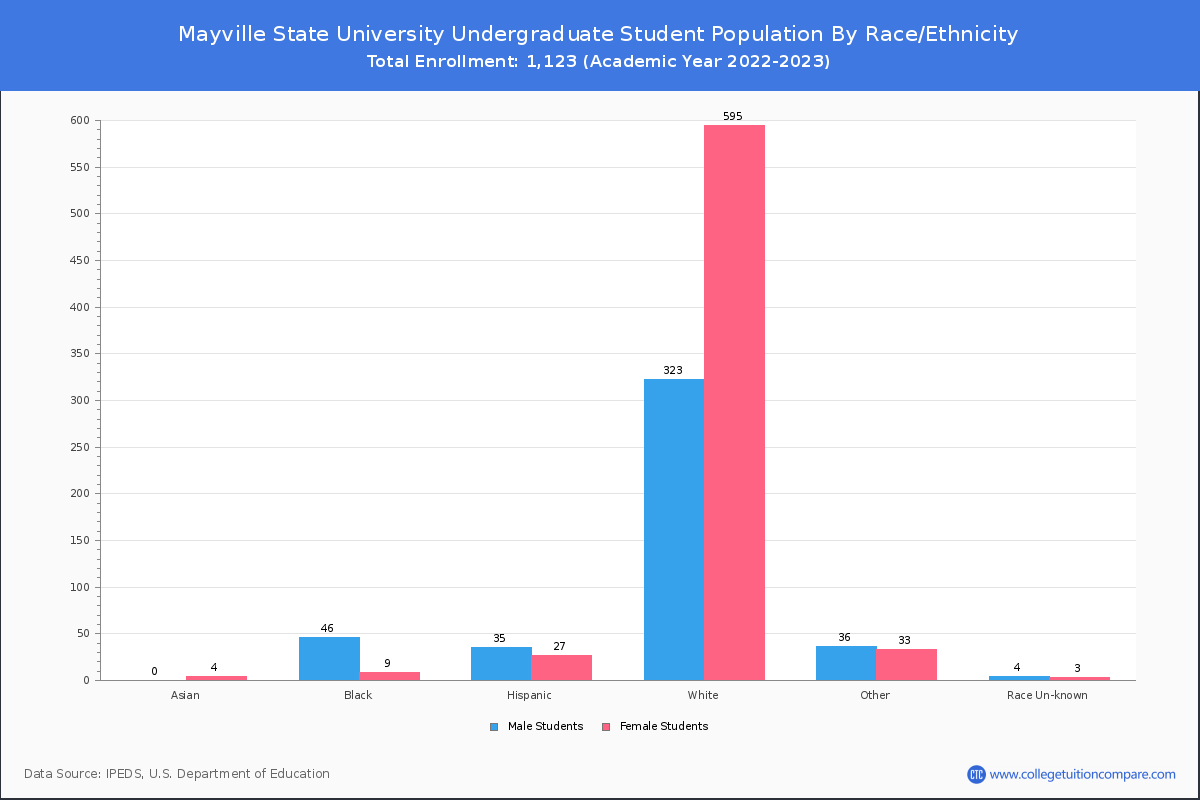
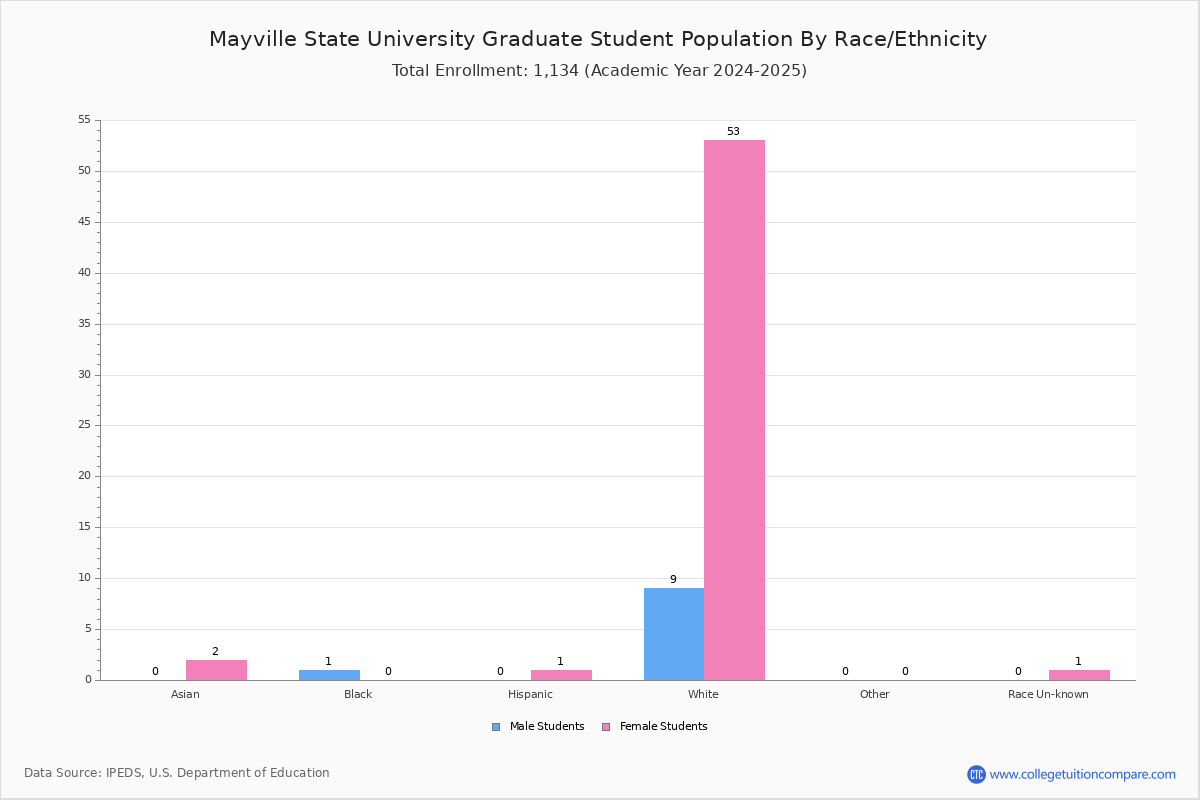
Student Distribution by Race/Ethnicity
By race/ethnicity, 910 White, 41 Black, and 7 Asian students out of a total of 1,123 are attending at Mayville State University. Comprehensive enrollment statistic data by race/ethnicity is shown in the next chart (Academic year 2022-2023 data).
| Race | Total | Men | Women |
|---|---|---|---|
| American Indian or Native American | 14 | 3 | 11 |
| Asian | 7 | 1 | 6 |
| Black | 41 | 36 | 5 |
| Hispanic | 50 | 26 | 24 |
| Native Hawaiian or Other Pacific Islanders | 0 | 0 | 0 |
| White | 910 | 283 | 627 |
| Two or more races | 58 | 32 | 26 |
| Race Unknown | 9 | 3 | 6 |
| Race | Total | Men | Women |
|---|---|---|---|
| American Indian or Native American | 13 | 2 | 11 |
| Asian | 6 | 1 | 5 |
| Black | 40 | 35 | 5 |
| Hispanic | 48 | 25 | 23 |
| Native Hawaiian or Other Pacific Islanders | 0 | 0 | 0 |
| White | 870 | 276 | 594 |
| Two or more races | 57 | 32 | 25 |
| Race Unknown | 9 | 3 | 6 |
| Race | Total | Men | Women |
|---|---|---|---|
| American Indian or Native American | 6 | 1 | 5 |
| Asian | 1 | 0 | 1 |
| Black | 5 | 4 | 1 |
| Hispanic | 9 | 5 | 4 |
| Native Hawaiian or Other Pacific Islanders | 0 | 0 | 0 |
| White | 103 | 18 | 85 |
| Two or more races | 7 | 2 | 5 |
| Race Unknown | 0 | 0 | 0 |
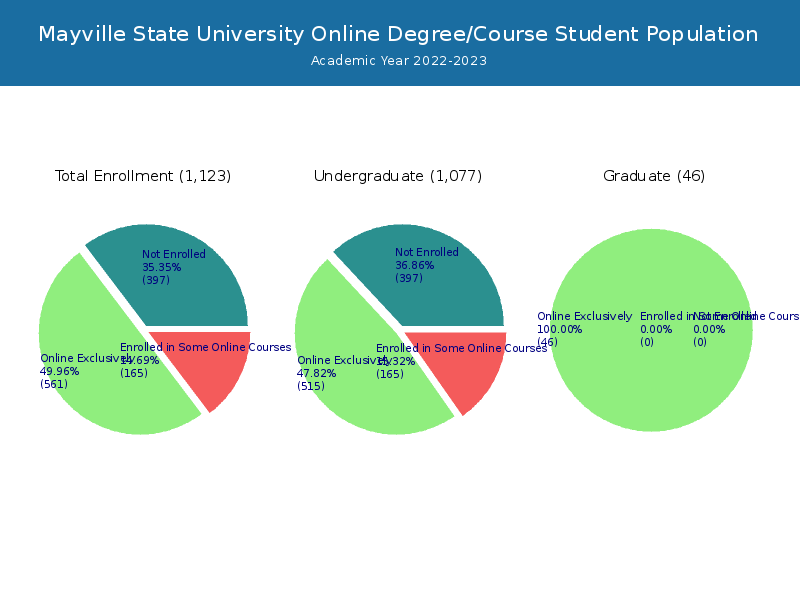
Online Student Enrollment
Distance learning, also called online education, is very attractive to students, especially who want to continue education and work in field. At Mayville State University, 561 students are enrolled exclusively in online courses and 165 students are enrolled in some online courses.
429 students lived in North Dakota or jurisdiction in which the school is located are enrolled exclusively in online courses and 132 students live in other State or outside of the United States.
| All Students | Enrolled Exclusively Online Courses | Enrolled in Some Online Courses | |
|---|---|---|---|
| All Students | 1,123 | 561 | 165 |
| Undergraduate | 1,077 | 515 | 165 |
| Graduate | 46 | 46 | 0 |
| North Dakota Residents | Other States in U.S. | Outside of U.S. | |
|---|---|---|---|
| All Students | 429 | 123 | 9 |
| Undergraduate | 391 | 115 | 9 |
| Graduate | 38 | 8 | 0 |
Transfer-in Students (Undergraduate)
Among 1,077 enrolled in undergraduate programs, 138 students have transferred-in from other institutions. The percentage of transfer-in students is 12.81%.91 students have transferred in as full-time status and 47 students transferred in as part-time status.
| Number of Students | |
|---|---|
| Regular Full-time | 500 |
| Transfer-in Full-time | 91 |
| Regular Part-time | 439 |
| Transfer-in Part-time | 47 |