Student Population by Gender
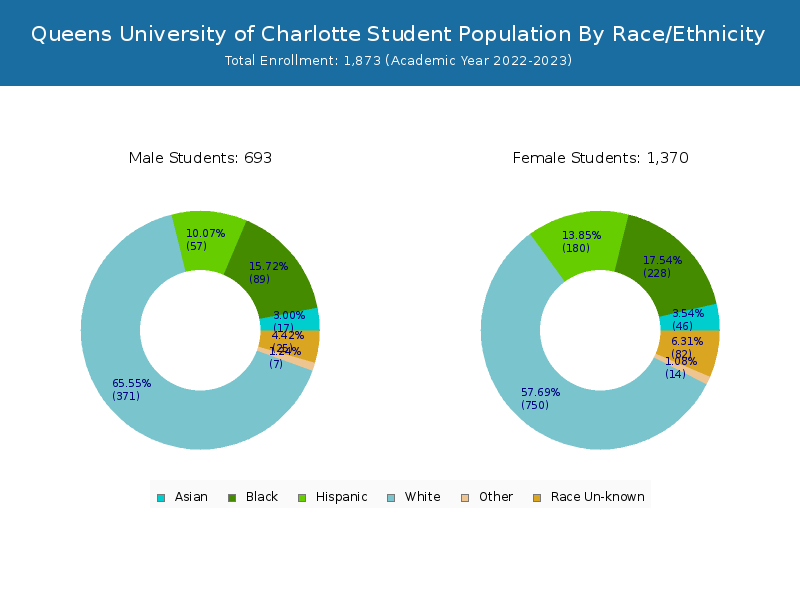
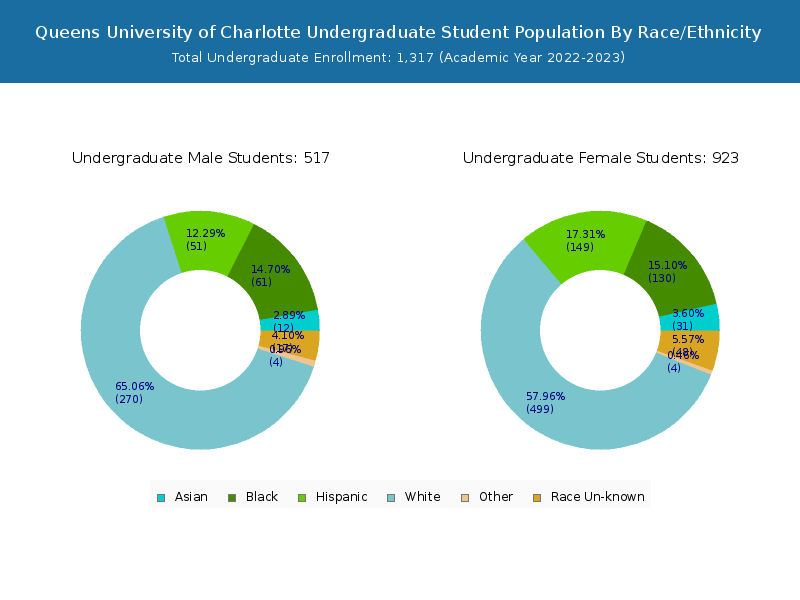
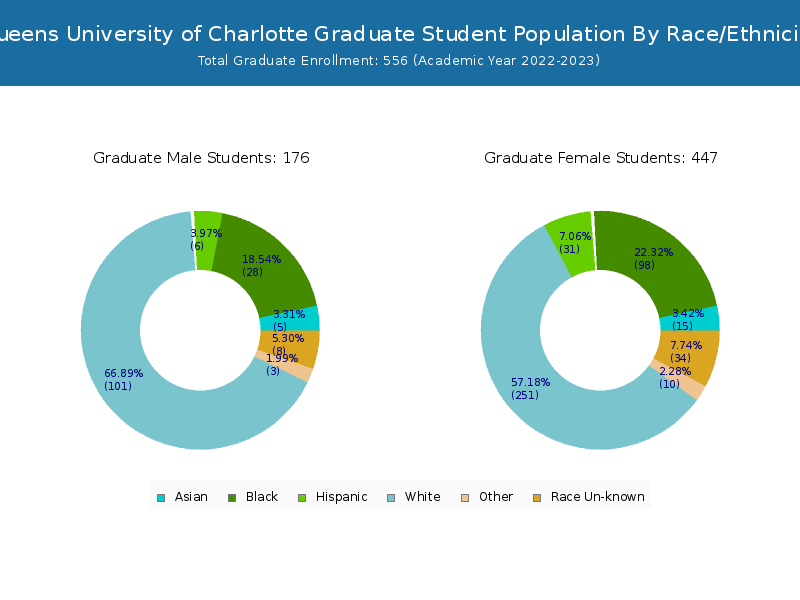
Queens University of Charlotte has a total of 1,873 enrolled students for the academic year 2022-2023. 1,317 students have enrolled in undergraduate programs and 556 students joined graduate programs.
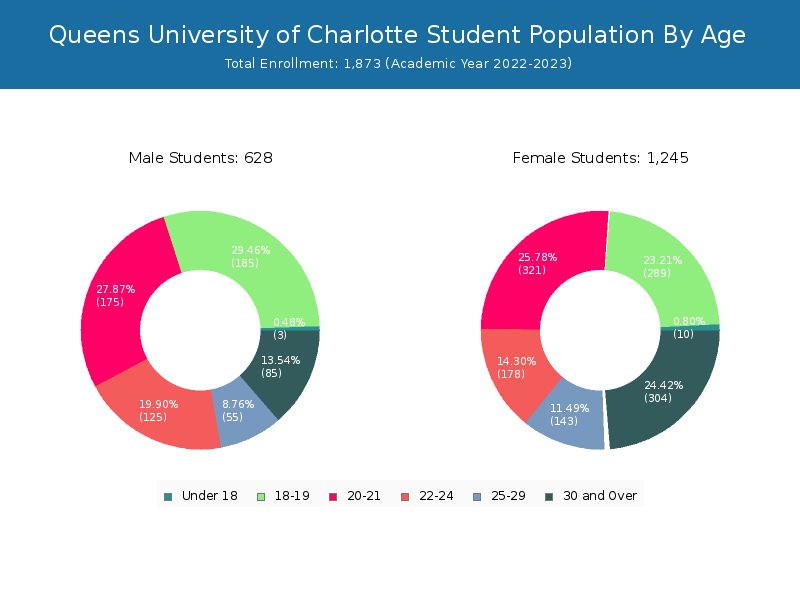
By gender, 628 male and 1,245 female students (the male-female ratio is 34:66) are attending the school. The gender distribution is based on the 2022-2023 data.
| Total | Undergraduate | Graduate | |
|---|---|---|---|
| Total | 1,873 | 1,317 | 556 |
| Men | 628 | 472 | 156 |
| Women | 1,245 | 845 | 400 |
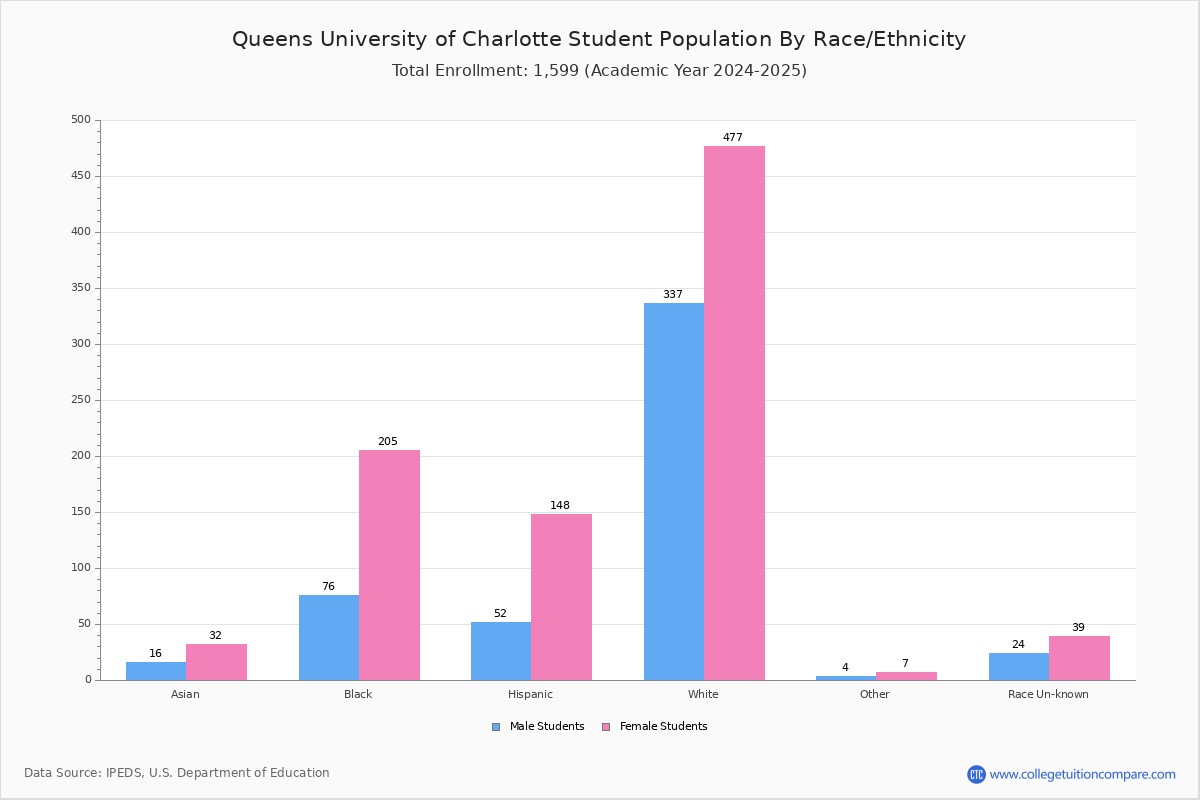
Student Distribution by Race/Ethnicity
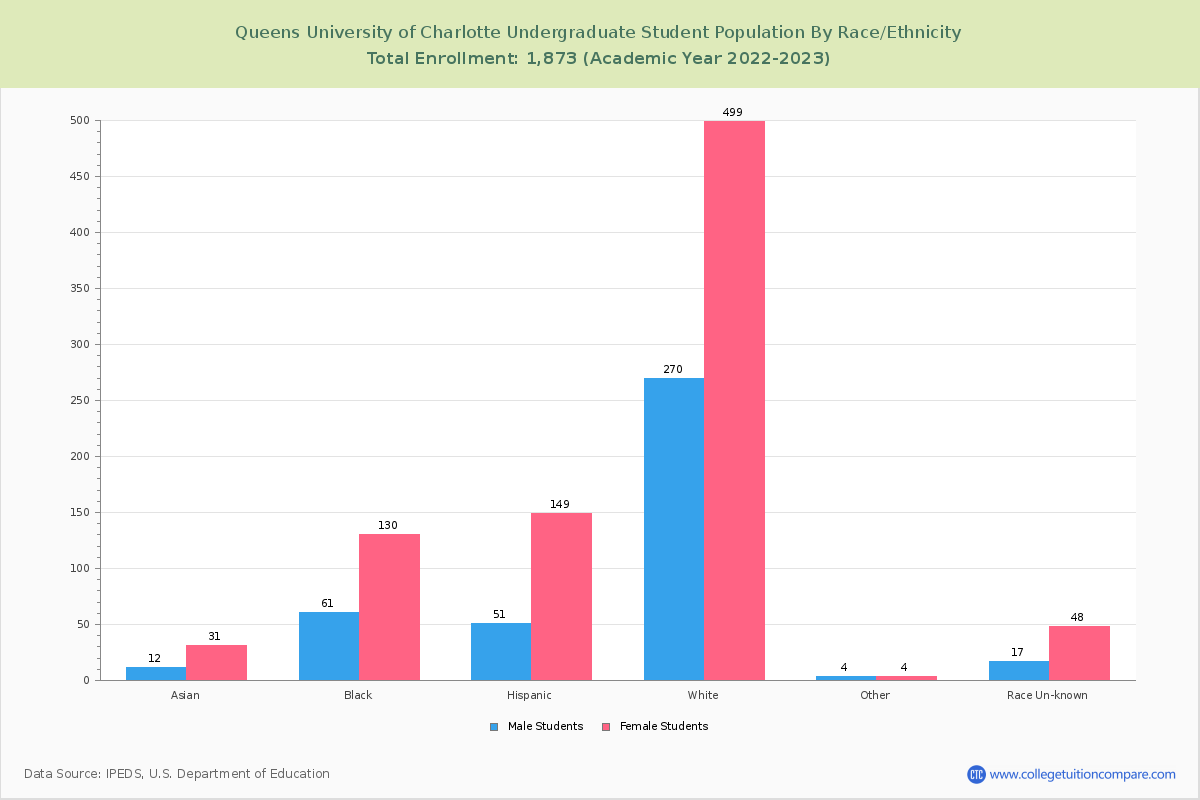
By race/ethnicity, 999 White, 282 Black, and 71 Asian students out of a total of 1,873 are attending at Queens University of Charlotte. Comprehensive enrollment statistic data by race/ethnicity is shown in the next chart (Academic year 2022-2023 data).
| Race | Total | Men | Women |
|---|---|---|---|
| American Indian or Native American | 2 | 1 | 1 |
| Asian | 71 | 14 | 57 |
| Black | 282 | 76 | 206 |
| Hispanic | 220 | 53 | 167 |
| Native Hawaiian or Other Pacific Islanders | 2 | 0 | 2 |
| White | 999 | 353 | 646 |
| Two or more races | 11 | 3 | 8 |
| Race Unknown | 82 | 14 | 68 |
| Race | Total | Men | Women |
|---|---|---|---|
| American Indian or Native American | 2 | 1 | 1 |
| Asian | 47 | 10 | 37 |
| Black | 178 | 55 | 123 |
| Hispanic | 182 | 46 | 136 |
| Native Hawaiian or Other Pacific Islanders | 1 | 0 | 1 |
| White | 686 | 255 | 431 |
| Two or more races | 2 | 0 | 2 |
| Race Unknown | 43 | 9 | 34 |
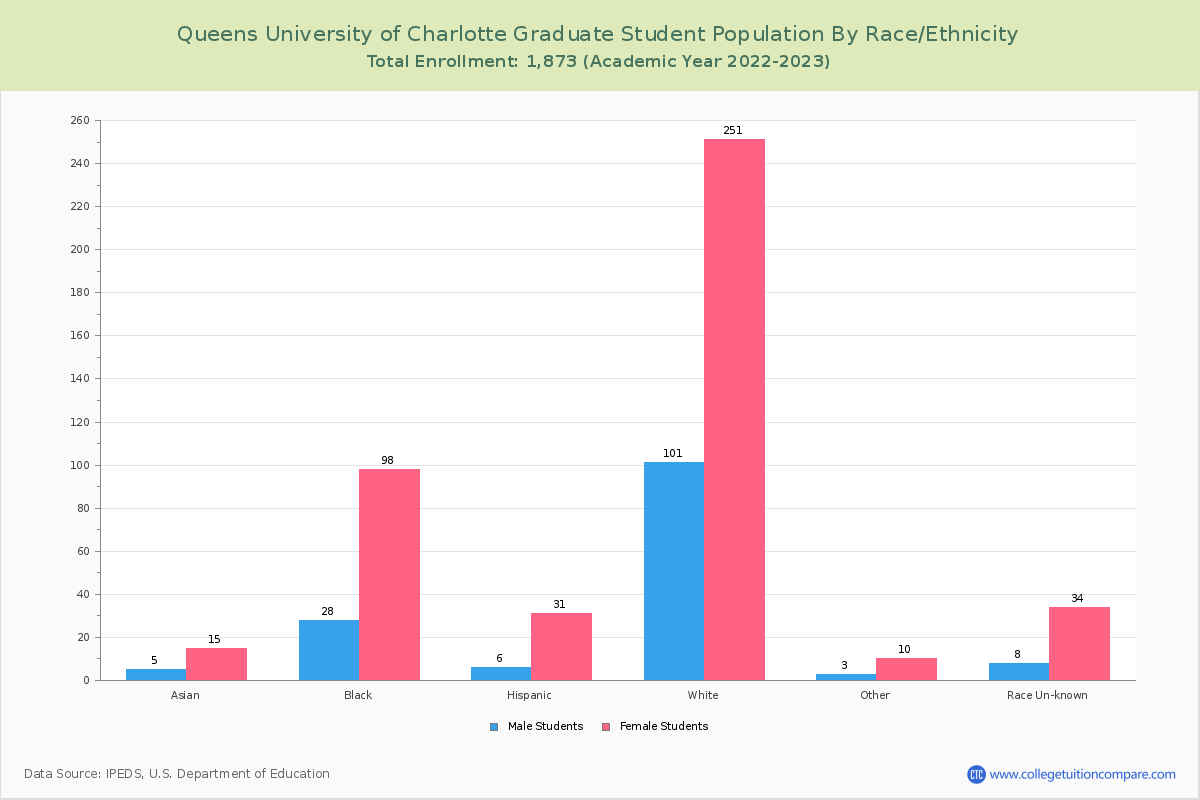
| Race | Total | Men | Women |
|---|---|---|---|
| American Indian or Native American | 0 | 0 | 0 |
| Asian | 7 | 0 | 7 |
| Black | 26 | 4 | 22 |
| Hispanic | 15 | 2 | 13 |
| Native Hawaiian or Other Pacific Islanders | 0 | 0 | 0 |
| White | 54 | 15 | 39 |
| Two or more races | 0 | 0 | 0 |
| Race Unknown | 7 | 3 | 4 |
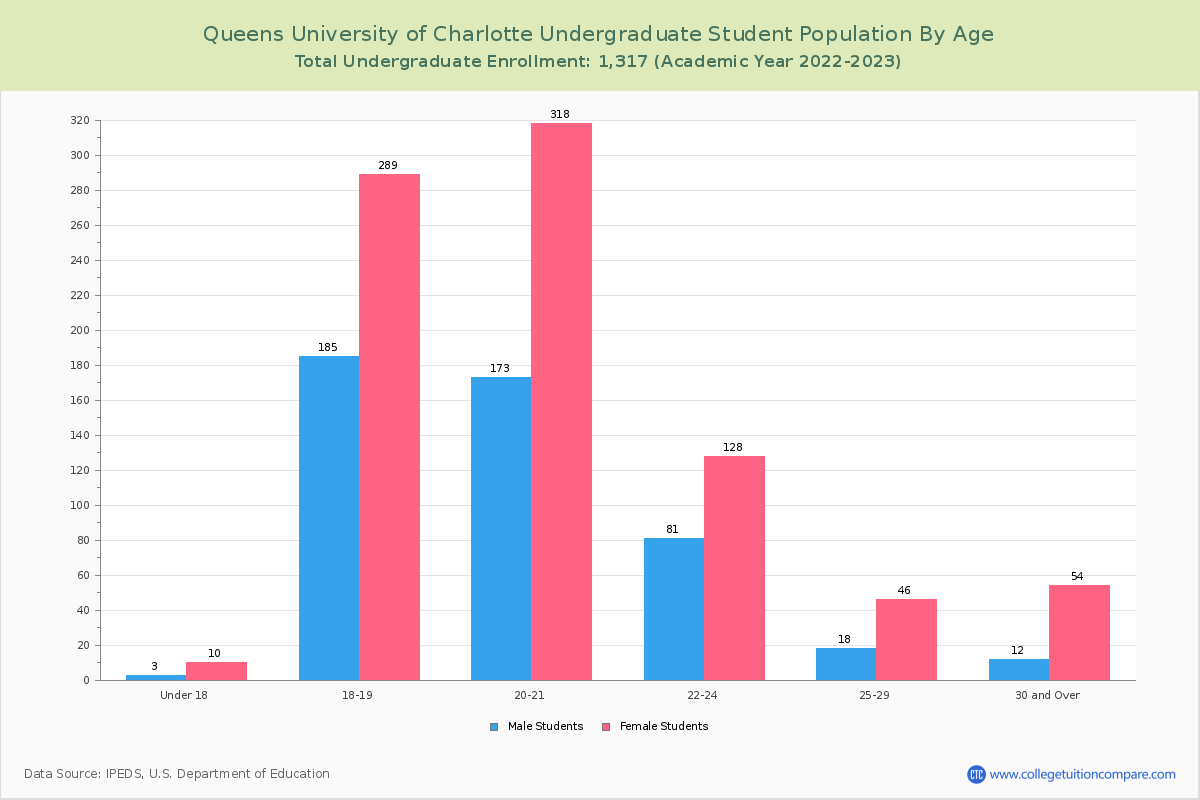
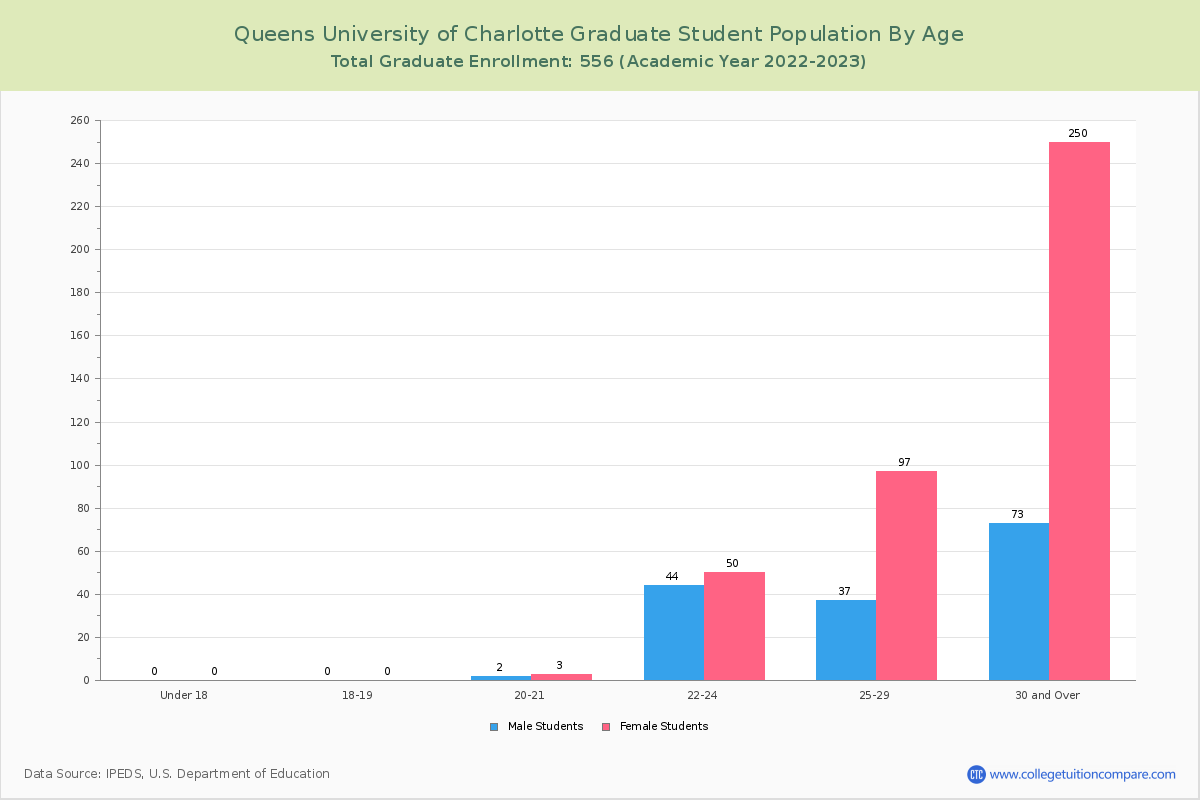
Student Age Distribution
By age, Queens has 13 students under 18 years old and 3 students over 65 years old. There are 1,286 students under 25 years old, and 587 students over 25 years old out of 1,873 total students.
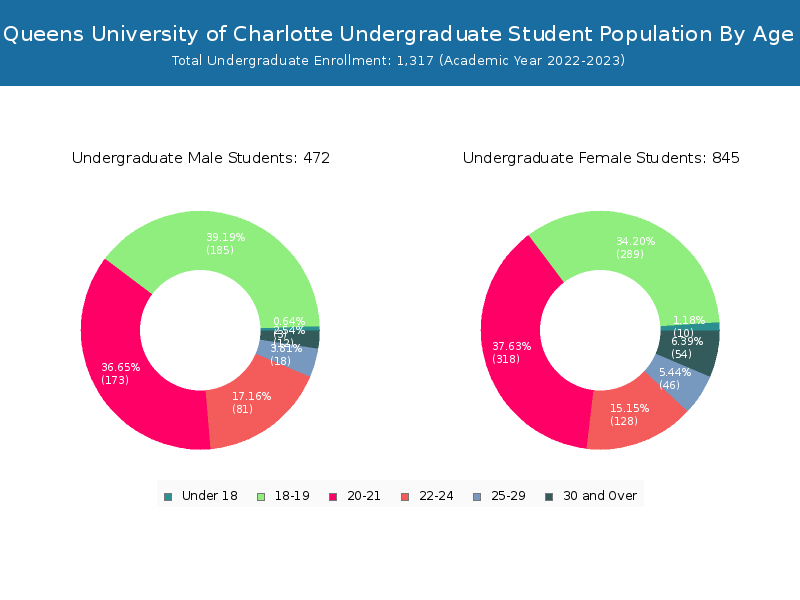
Queens has 1,187 undergraduate students aged under 25 and 130 students aged 25 and over.
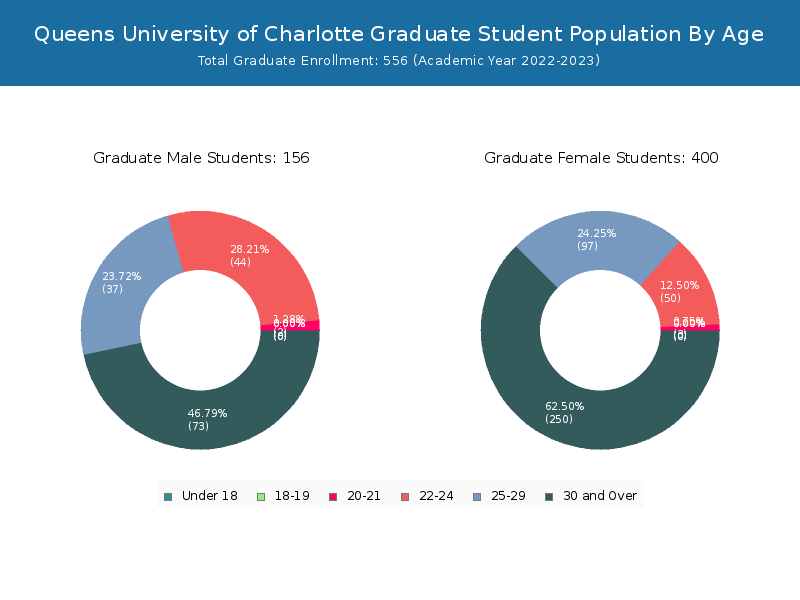
It has 99 graduate students aged under 25 and 457 students aged 25 and over.
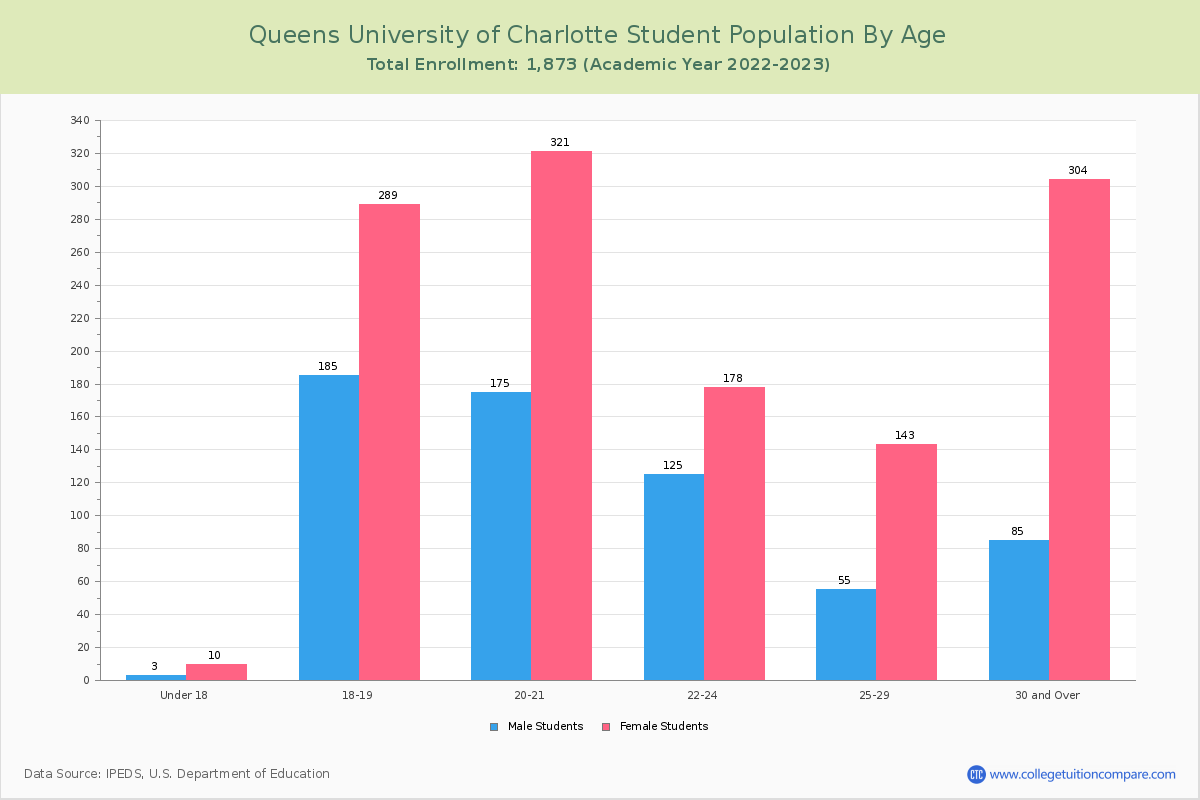
| Age | Total | Men | Women |
|---|---|---|---|
| Under 18 | 13 | 10 | 3 |
| 18-19 | 474 | 289 | 185 |
| 20-21 | 496 | 321 | 175 |
| 22-24 | 303 | 178 | 125 |
| 25-29 | 198 | 143 | 55 |
| 30-34 | 97 | 73 | 24 |
| 35-39 | 94 | 71 | 23 |
| 40-49 | 132 | 108 | 24 |
| 50-64 | 63 | 51 | 12 |
| Over 65 | 3 | 1 | 2 |
| Age | Total | Men | Women |
|---|---|---|---|
| Under 18 | 13 | 10 | 3 |
| 18-19 | 474 | 289 | 185 |
| 20-21 | 491 | 318 | 173 |
| 22-24 | 209 | 128 | 81 |
| 25-29 | 64 | 46 | 18 |
| 30-34 | 12 | 9 | 3 |
| 35-39 | 17 | 15 | 2 |
| 40-49 | 29 | 24 | 5 |
| 50-64 | 8 | 6 | 2 |
| Age | Total | Men | Women |
|---|
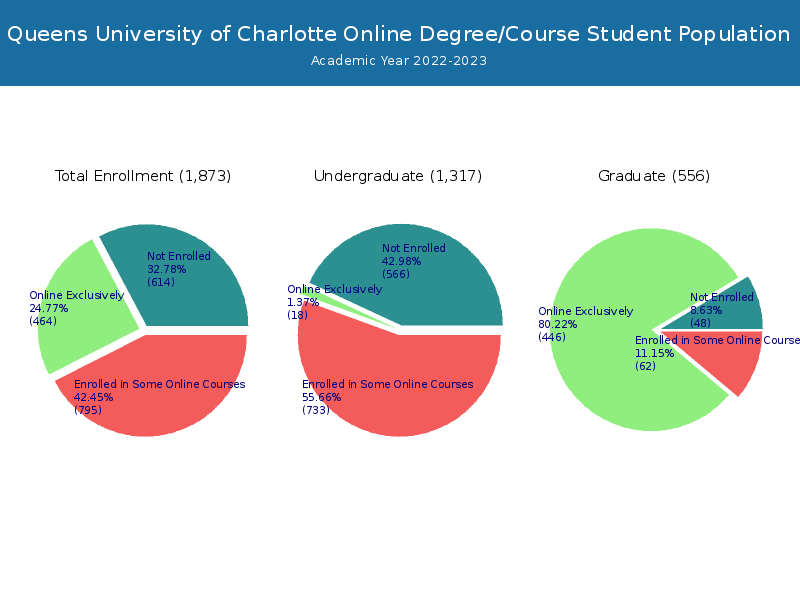
Online Student Enrollment
Distance learning, also called online education, is very attractive to students, especially who want to continue education and work in field. At Queens University of Charlotte, 464 students are enrolled exclusively in online courses and 795 students are enrolled in some online courses.
312 students lived in North Carolina or jurisdiction in which the school is located are enrolled exclusively in online courses and 152 students live in other State or outside of the United States.
| All Students | Enrolled Exclusively Online Courses | Enrolled in Some Online Courses | |
|---|---|---|---|
| All Students | 1,873 | 464 | 795 |
| Undergraduate | 1,317 | 18 | 733 |
| Graduate | 556 | 446 | 62 |
| North Carolina Residents | Other States in U.S. | Outside of U.S. | |
|---|---|---|---|
| All Students | 312 | 151 | 1 |
| Undergraduate | 16 | 2 | 0 |
| Graduate | 296 | 149 | 1 |
Transfer-in Students (Undergraduate)
Among 1,317 enrolled in undergraduate programs, 117 students have transferred-in from other institutions. The percentage of transfer-in students is 8.88%.114 students have transferred in as full-time status and 3 students transferred in as part-time status.
| Number of Students | |
|---|---|
| Regular Full-time | 1,127 |
| Transfer-in Full-time | 114 |
| Regular Part-time | 73 |
| Transfer-in Part-time | 3 |