Student Population by Gender
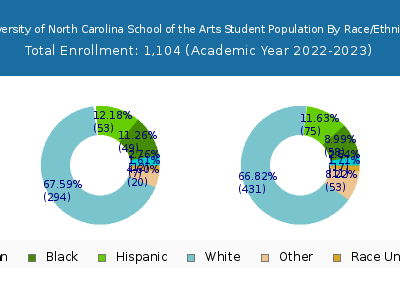
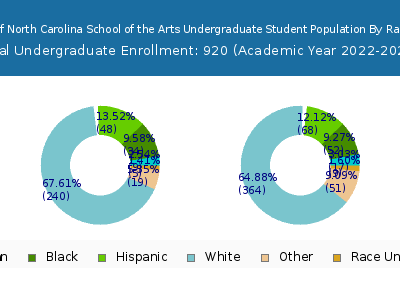
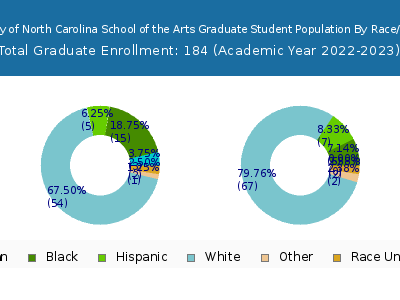
University of North Carolina School of the Arts has a total of 1,104 enrolled students for the academic year 2022-2023. 920 students have enrolled in undergraduate programs and 184 students joined graduate programs.
By gender, 449 male and 655 female students (the male-female ratio is 41:59) are attending the school. The gender distribution is based on the 2022-2023 data.
| Total | Undergraduate | Graduate | |
|---|---|---|---|
| Total | 1,104 | 920 | 184 |
| Men | 449 | 362 | 87 |
| Women | 655 | 558 | 97 |
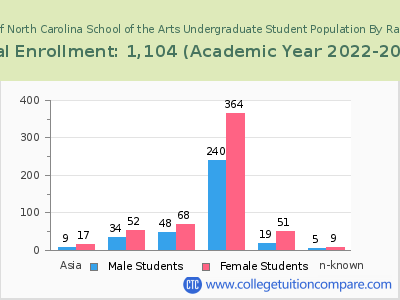
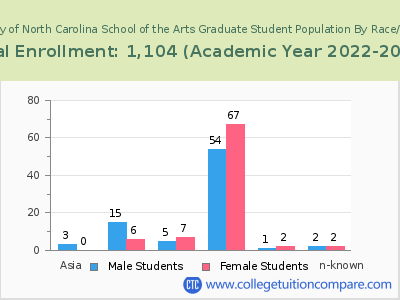
Student Distribution by Race/Ethnicity
| Race | Total | Men | Women |
|---|---|---|---|
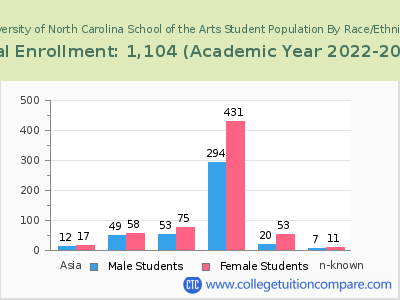
| American Indian or Native American | 1 | 0 | 1 |
| Asian | 31 | 15 | 16 |
| Black | 111 | 51 | 60 |
| Hispanic | 141 | 57 | 84 |
| Native Hawaiian or Other Pacific Islanders | 1 | 1 | 0 |
| White | 689 | 274 | 415 |
| Two or more races | 67 | 19 | 48 |
| Race Unknown | 20 | 9 | 11 |
| Race | Total | Men | Women |
|---|---|---|---|
| American Indian or Native American | 1 | 0 | 1 |
| Asian | 24 | 11 | 13 |
| Black | 90 | 35 | 55 |
| Hispanic | 126 | 52 | 74 |
| Native Hawaiian or Other Pacific Islanders | 1 | 1 | 0 |
| White | 572 | 222 | 350 |
| Two or more races | 64 | 18 | 46 |
| Race Unknown | 17 | 8 | 9 |
| Race | Total | Men | Women |
|---|---|---|---|
| American Indian or Native American | 0 | 0 | 0 |
| Asian | 0 | 0 | 0 |
| Black | 2 | 1 | 1 |
| Hispanic | 5 | 1 | 4 |
| Native Hawaiian or Other Pacific Islanders | 0 | 0 | 0 |
| White | 24 | 13 | 11 |
| Two or more races | 1 | 0 | 1 |
| Race Unknown | 1 | 1 | 0 |
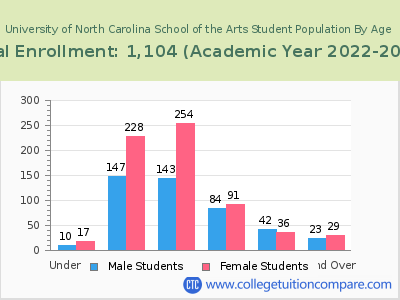
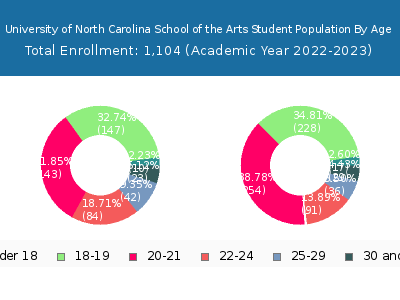
Student Age Distribution
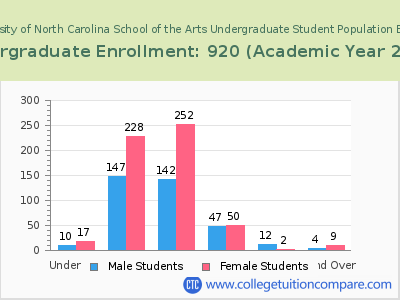
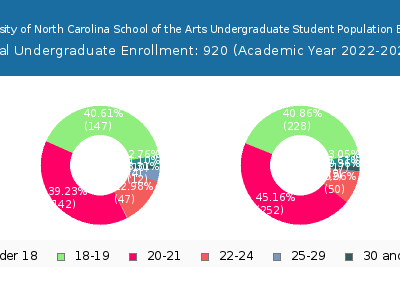
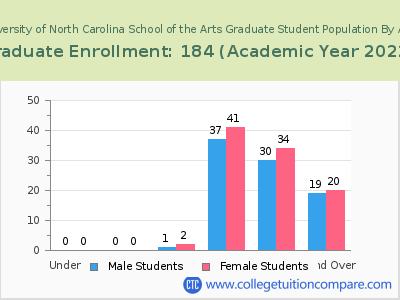
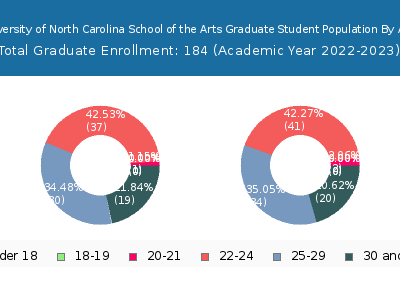
By age, UNCSA has 27 students under 18 years old and 1 students over 65 years old. There are 974 students under 25 years old, and 130 students over 25 years old out of 1,104 total students.
In undergraduate programs, 27 students are younger than 18 and 1 students are older than 65. UNCSA has 893 undergraduate students aged under 25 and 27 students aged 25 and over.
It has 81 graduate students aged under 25 and 103 students aged 25 and over.
| Age | Total | Men | Women |
|---|---|---|---|
| Under 18 | 27 | 17 | 10 |
| 18-19 | 375 | 228 | 147 |
| 20-21 | 397 | 254 | 143 |
| 22-24 | 175 | 91 | 84 |
| 25-29 | 78 | 36 | 42 |
| 30-34 | 26 | 13 | 13 |
| 35-39 | 12 | 10 | 2 |
| 40-49 | 6 | 3 | 3 |
| 50-64 | 7 | 3 | 4 |
| Over 65 | 1 | 0 | 1 |
| Age | Total | Men | Women |
|---|---|---|---|
| Under 18 | 27 | 17 | 10 |
| 18-19 | 375 | 228 | 147 |
| 20-21 | 394 | 252 | 142 |
| 22-24 | 97 | 50 | 47 |
| 25-29 | 14 | 2 | 12 |
| 30-34 | 8 | 6 | 2 |
| 35-39 | 3 | 3 | 0 |
| Age | Total | Men | Women |
|---|
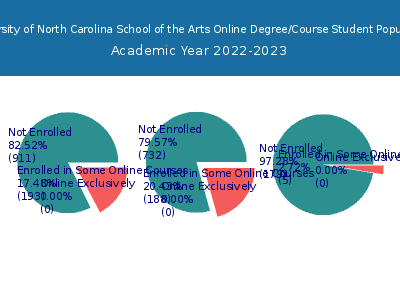
Online Student Enrollment
| All Students | Enrolled Exclusively Online Courses | Enrolled in Some Online Courses | |
|---|---|---|---|
| All Students | 1,104 | 0 | 193 |
| Undergraduate | 920 | 0 | 188 |
| Graduate | 184 | 0 | 5 |
| North Carolina Residents | Other States in U.S. | Outside of U.S. | |
|---|---|---|---|
| All Students | 0 | - | 0 |
| Undergraduate | 0 | - | 0 |
| Graduate | 0 | - | 0 |
Transfer-in Students (Undergraduate)
Among 920 enrolled in undergraduate programs, 36 students have transferred-in from other institutions. The percentage of transfer-in students is 3.91%.
| Number of Students | |
|---|---|
| Regular Full-time | 858 |
| Transfer-in Full-time | 36 |
