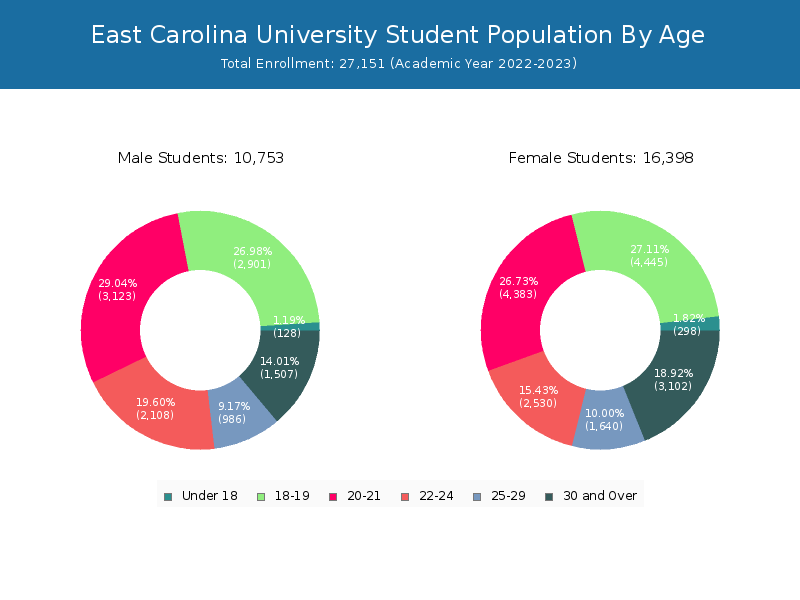
Student Population by Gender
East Carolina University has a total of 27,151 enrolled students for the academic year 2022-2023. 21,688 students have enrolled in undergraduate programs and 5,463 students joined graduate programs.
By gender, 10,753 male and 16,398 female students (the male-female ratio is 40:60) are attending the school. The gender distribution is based on the 2022-2023 data.
| Total | Undergraduate | Graduate | |
|---|---|---|---|
| Total | 27,151 | 21,688 | 5,463 |
| Men | 10,753 | 9,038 | 1,715 |
| Women | 16,398 | 12,650 | 3,748 |
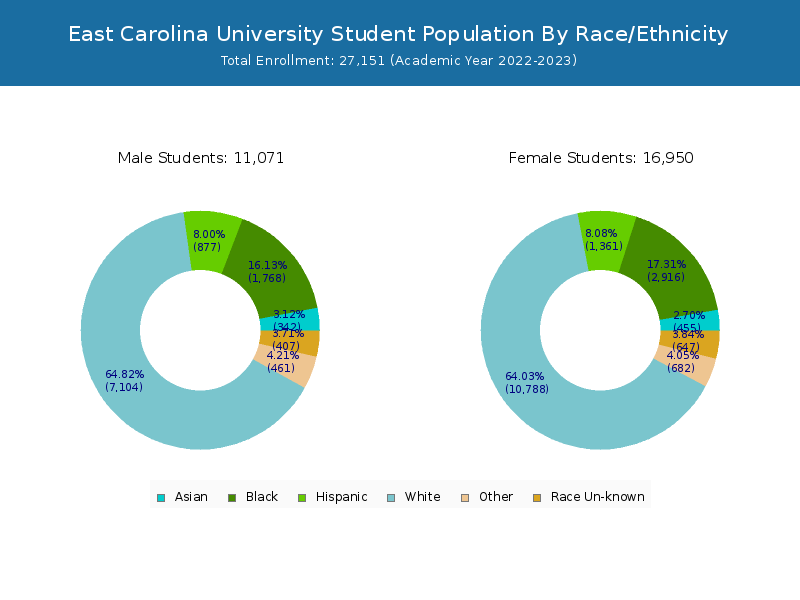
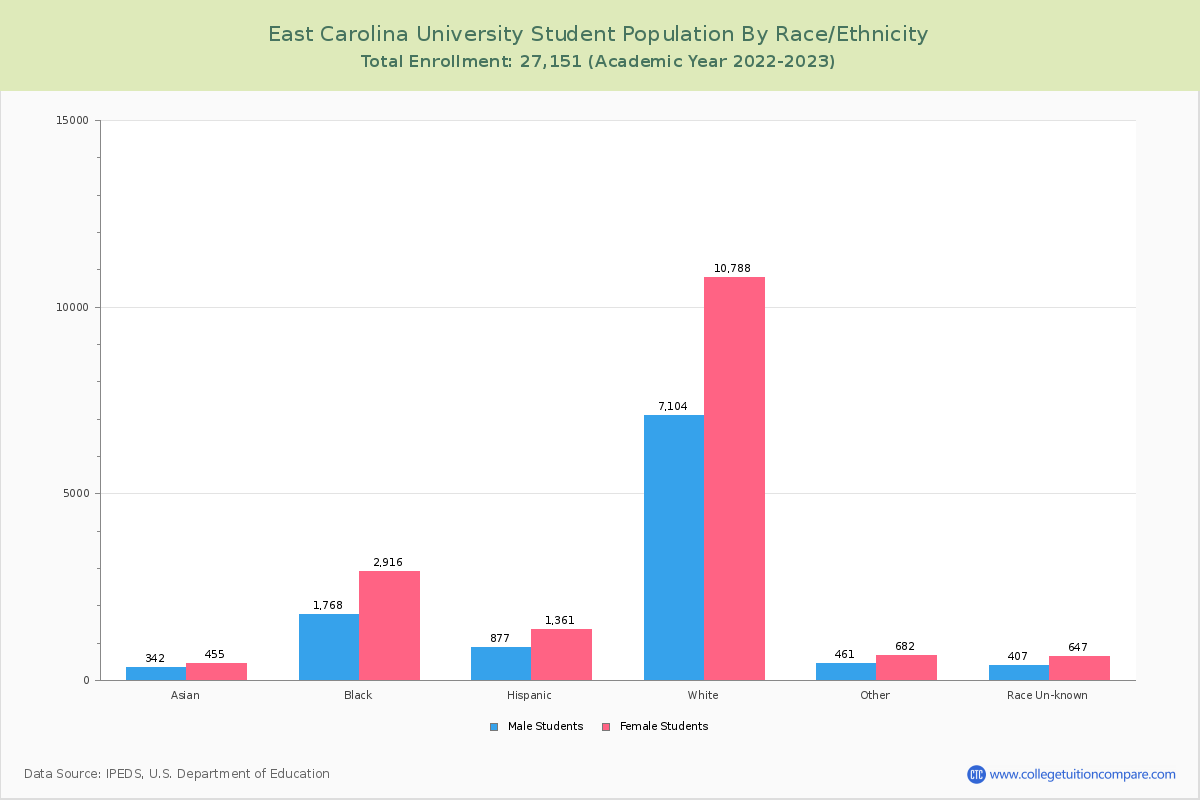
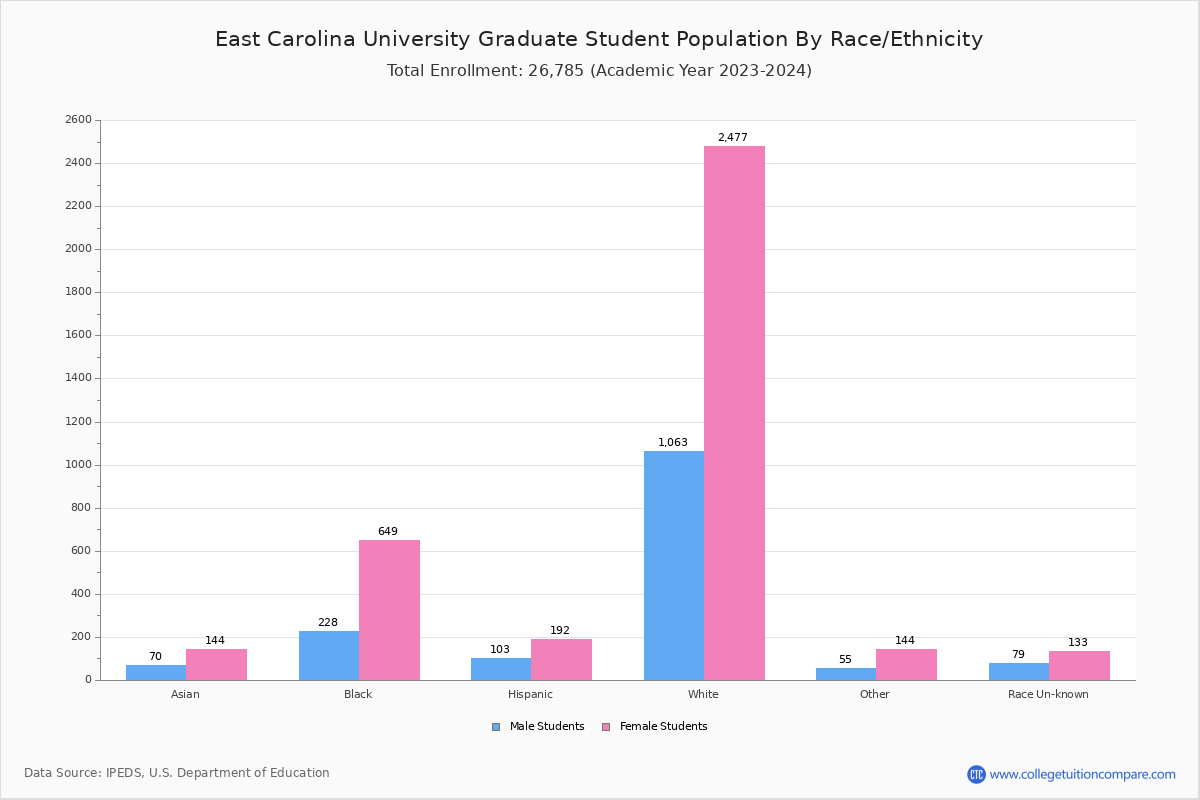
Student Distribution by Race/Ethnicity
By race/ethnicity, 17,239 White, 4,445 Black, and 773 Asian students out of a total of 27,151 are attending at East Carolina University. Comprehensive enrollment statistic data by race/ethnicity is shown in the next chart (Academic year 2022-2023 data).
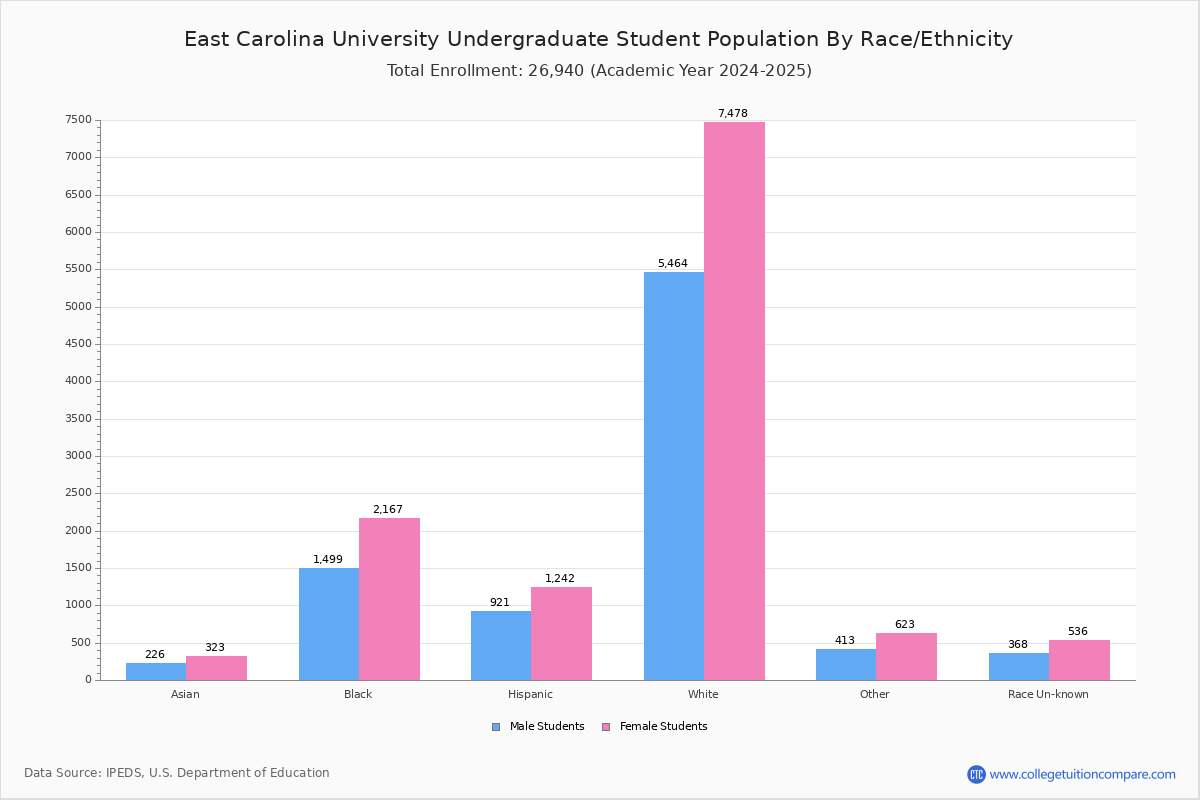
| Race | Total | Men | Women |
|---|---|---|---|
| American Indian or Native American | 143 | 58 | 85 |
| Asian | 773 | 326 | 447 |
| Black | 4,445 | 1,666 | 2,779 |
| Hispanic | 2,265 | 928 | 1,337 |
| Native Hawaiian or Other Pacific Islanders | 29 | 11 | 18 |
| White | 17,239 | 6,864 | 10,375 |
| Two or more races | 930 | 367 | 563 |
| Race Unknown | 1,071 | 414 | 657 |
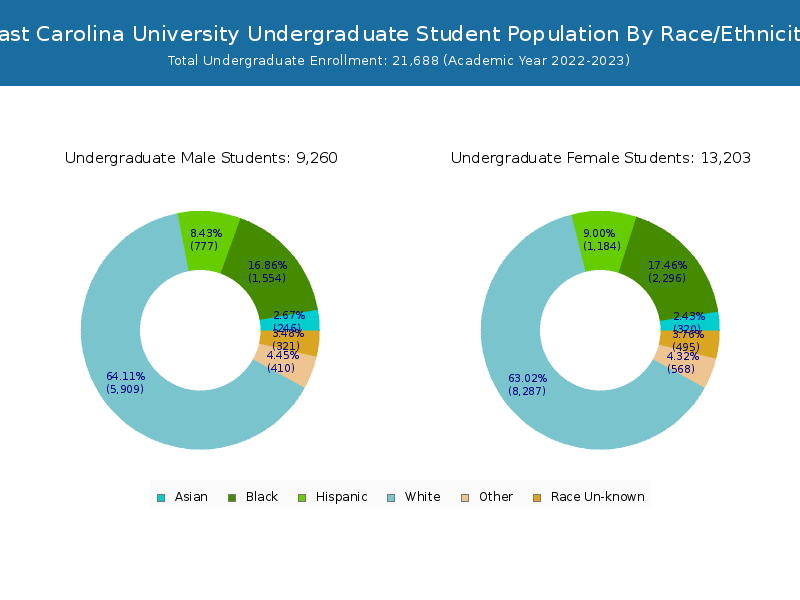
| Race | Total | Men | Women |
|---|---|---|---|
| American Indian or Native American | 104 | 52 | 52 |
| Asian | 545 | 229 | 316 |
| Black | 3,627 | 1,472 | 2,155 |
| Hispanic | 1,965 | 831 | 1,134 |
| Native Hawaiian or Other Pacific Islanders | 22 | 8 | 14 |
| White | 13,666 | 5,734 | 7,932 |
| Two or more races | 797 | 332 | 465 |
| Race Unknown | 828 | 322 | 506 |
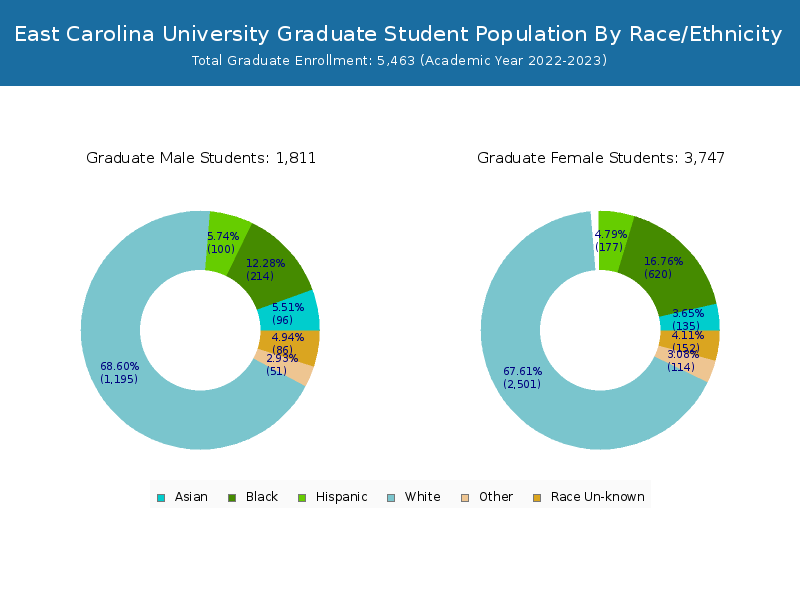
| Race | Total | Men | Women |
|---|---|---|---|
| American Indian or Native American | 8 | 5 | 3 |
| Asian | 33 | 18 | 15 |
| Black | 247 | 116 | 131 |
| Hispanic | 177 | 87 | 90 |
| Native Hawaiian or Other Pacific Islanders | 1 | 0 | 1 |
| White | 1,063 | 480 | 583 |
| Two or more races | 66 | 27 | 39 |
| Race Unknown | 28 | 13 | 15 |
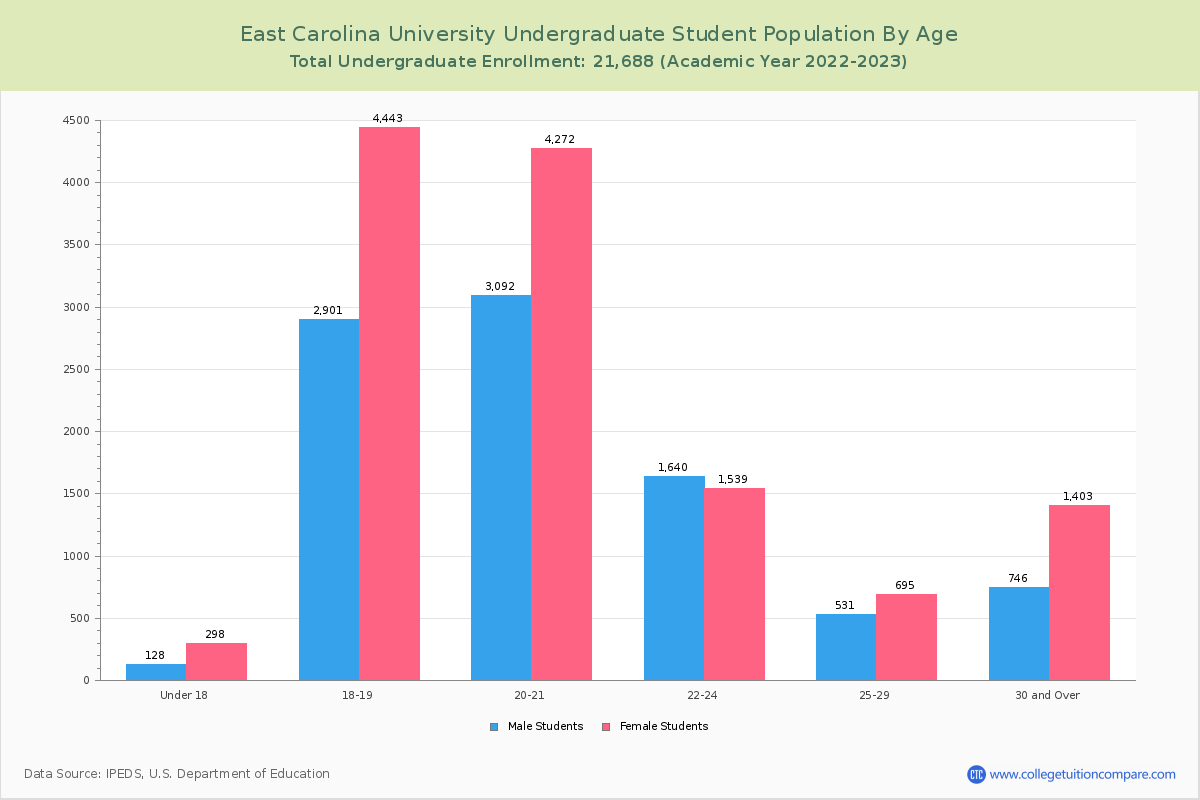
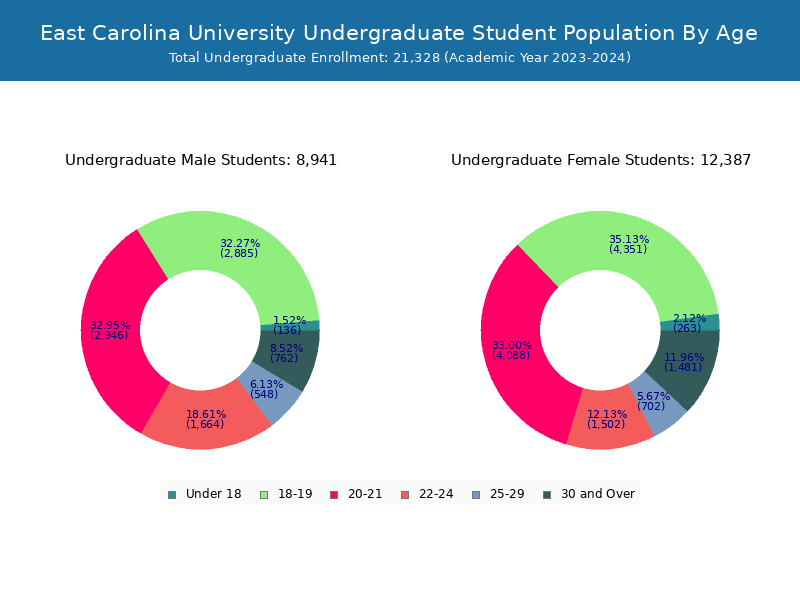
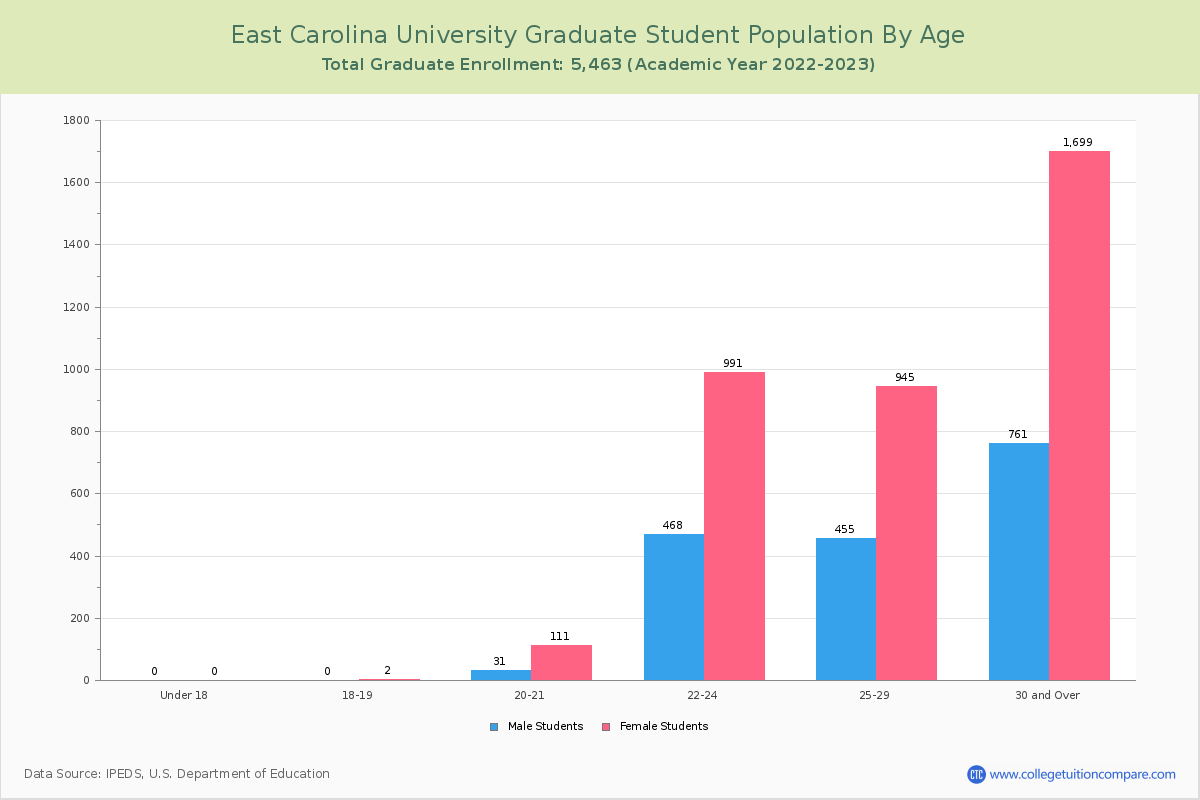
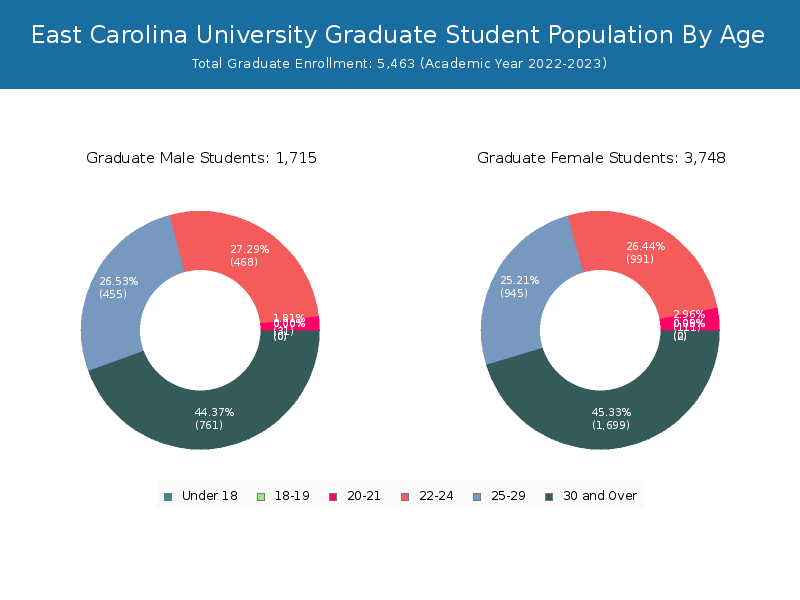
Student Age Distribution
By age, ECU has 426 students under 18 years old and 28 students over 65 years old. There are 19,916 students under 25 years old, and 7,235 students over 25 years old out of 27,151 total students.
In undergraduate programs, 426 students are younger than 18 and 16 students are older than 65. ECU has 18,313 undergraduate students aged under 25 and 3,375 students aged 25 and over.
It has 1,603 graduate students aged under 25 and 3,860 students aged 25 and over.
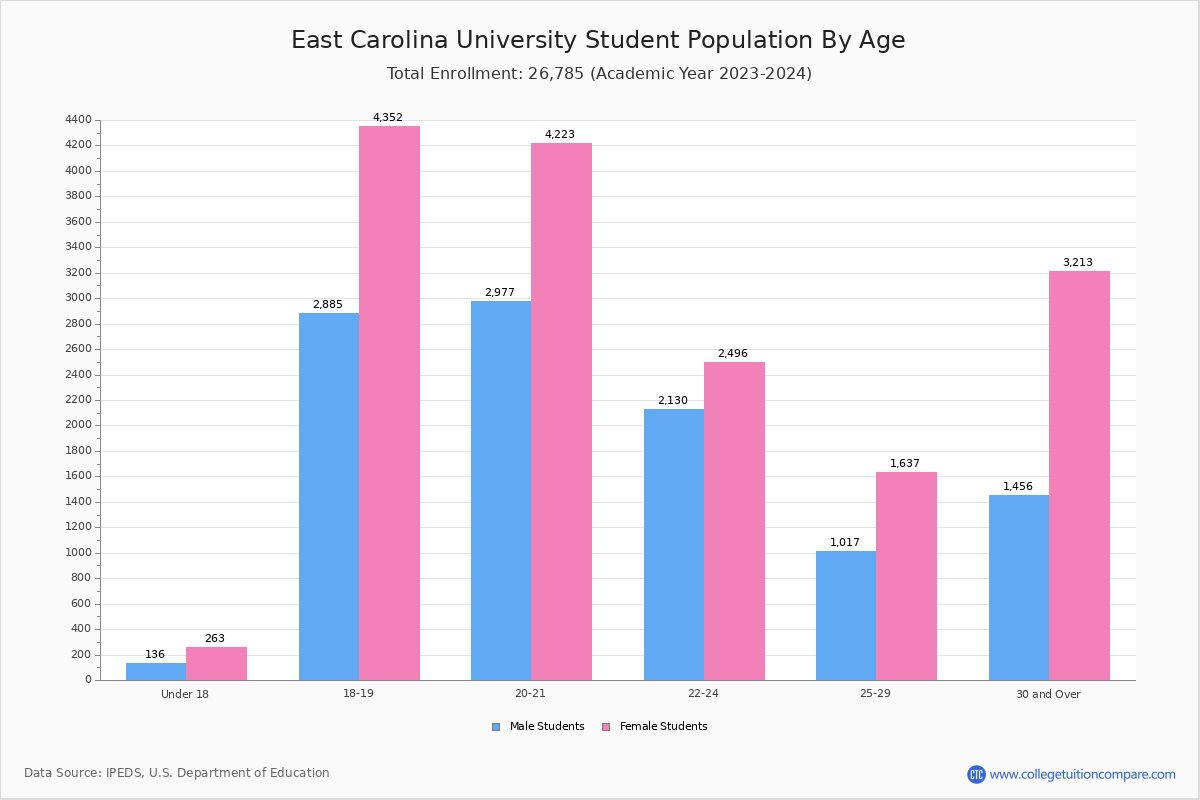
| Age | Total | Men | Women |
|---|---|---|---|
| Under 18 | 426 | 298 | 128 |
| 18-19 | 7,346 | 4,445 | 2,901 |
| 20-21 | 7,506 | 4,383 | 3,123 |
| 22-24 | 4,638 | 2,530 | 2,108 |
| 25-29 | 2,626 | 1,640 | 986 |
| 30-34 | 1,451 | 936 | 515 |
| 35-39 | 1,123 | 760 | 363 |
| 40-49 | 1,366 | 937 | 429 |
| 50-64 | 641 | 447 | 194 |
| Over 65 | 28 | 22 | 6 |
| Age | Total | Men | Women |
|---|---|---|---|
| Under 18 | 426 | 298 | 128 |
| 18-19 | 7,344 | 4,443 | 2,901 |
| 20-21 | 7,364 | 4,272 | 3,092 |
| 22-24 | 3,179 | 1,539 | 1,640 |
| 25-29 | 1,226 | 695 | 531 |
| 30-34 | 738 | 469 | 269 |
| 35-39 | 507 | 336 | 171 |
| 40-49 | 591 | 392 | 199 |
| 50-64 | 297 | 194 | 103 |
| Over 65 | 16 | 12 | 4 |
| Age | Total | Men | Women |
|---|
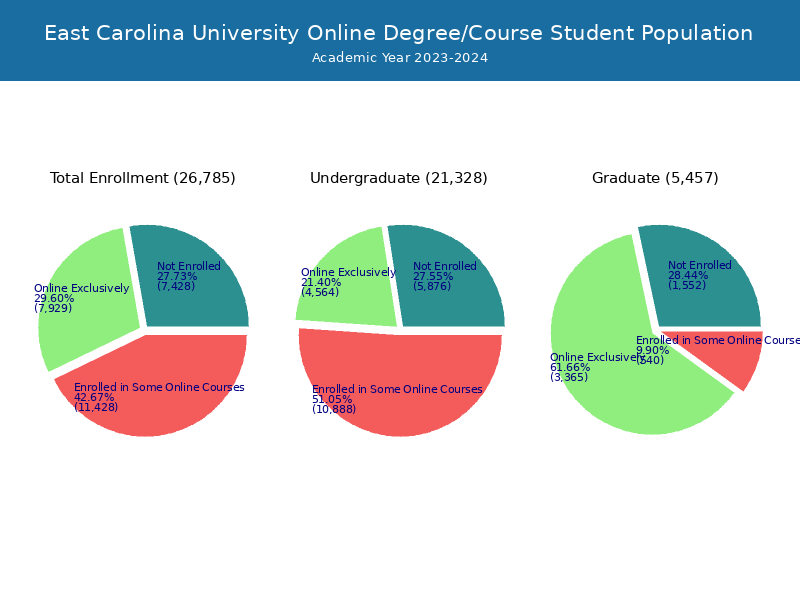
Online Student Enrollment
Distance learning, also called online education, is very attractive to students, especially who want to continue education and work in field. At East Carolina University, 7,807 students are enrolled exclusively in online courses and 11,621 students are enrolled in some online courses.
7,369 students lived in North Carolina or jurisdiction in which the school is located are enrolled exclusively in online courses and 438 students live in other State or outside of the United States.
| All Students | Enrolled Exclusively Online Courses | Enrolled in Some Online Courses | |
|---|---|---|---|
| All Students | 27,151 | 7,807 | 11,621 |
| Undergraduate | 21,688 | 4,434 | 11,041 |
| Graduate | 5,463 | 3,373 | 580 |
| North Carolina Residents | Other States in U.S. | Outside of U.S. | |
|---|---|---|---|
| All Students | 7,369 | 410 | 28 |
| Undergraduate | 4,286 | 141 | 7 |
| Graduate | 3,083 | 269 | 21 |
Transfer-in Students (Undergraduate)
Among 21,688 enrolled in undergraduate programs, 1,641 students have transferred-in from other institutions. The percentage of transfer-in students is 7.57%.1,198 students have transferred in as full-time status and 443 students transferred in as part-time status.
| Number of Students | |
|---|---|
| Regular Full-time | 16,419 |
| Transfer-in Full-time | 1,198 |
| Regular Part-time | 3,628 |
| Transfer-in Part-time | 443 |