Student Population by Gender
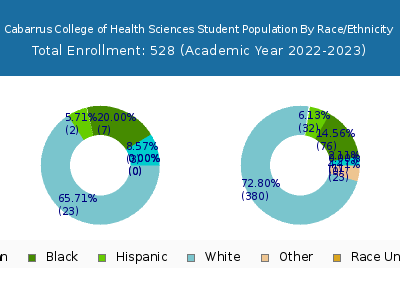
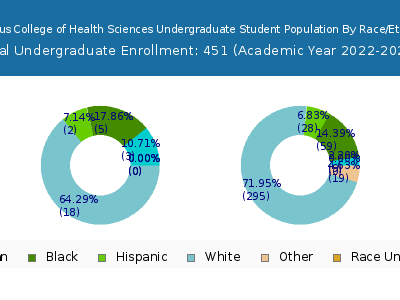
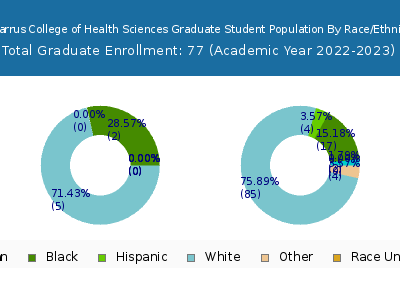
Cabarrus College of Health Sciences has a total of 528 enrolled students for the academic year 2022-2023. 451 students have enrolled in undergraduate programs and 77 students joined graduate programs.
By gender, 38 male and 490 female students (the male-female ratio is 7:93) are attending the school. The gender distribution is based on the 2022-2023 data.
| Total | Undergraduate | Graduate | |
|---|---|---|---|
| Total | 528 | 451 | 77 |
| Men | 38 | 31 | 7 |
| Women | 490 | 420 | 70 |
Student Distribution by Race/Ethnicity
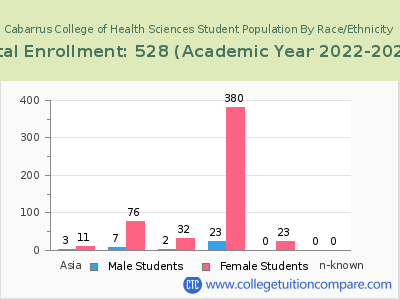
| Race | Total | Men | Women |
|---|---|---|---|
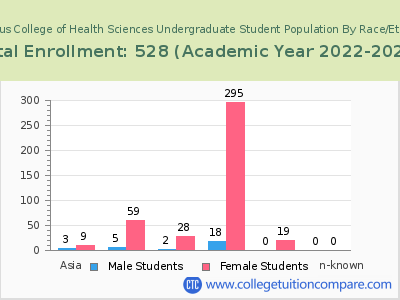
| American Indian or Native American | 1 | 0 | 1 |
| Asian | 13 | 3 | 10 |
| Black | 90 | 3 | 87 |
| Hispanic | 43 | 7 | 36 |
| Native Hawaiian or Other Pacific Islanders | 0 | 0 | 0 |
| White | 356 | 23 | 333 |
| Two or more races | 25 | 2 | 23 |
| Race Unknown | 0 | 0 | 0 |
| Race | Total | Men | Women |
|---|---|---|---|
| American Indian or Native American | 1 | 0 | 1 |
| Asian | 13 | 3 | 10 |
| Black | 84 | 3 | 81 |
| Hispanic | 40 | 6 | 34 |
| Native Hawaiian or Other Pacific Islanders | 0 | 0 | 0 |
| White | 290 | 17 | 273 |
| Two or more races | 23 | 2 | 21 |
| Race Unknown | 0 | 0 | 0 |
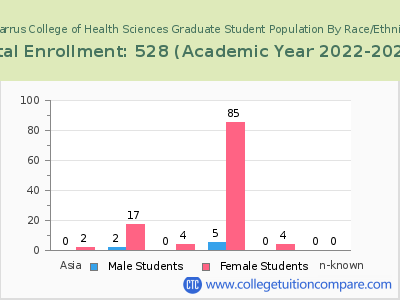
| Race | Total | Men | Women |
|---|---|---|---|
| American Indian or Native American | 1 | 0 | 1 |
| Asian | 3 | 0 | 3 |
| Black | 27 | 1 | 26 |
| Hispanic | 13 | 1 | 12 |
| Native Hawaiian or Other Pacific Islanders | 0 | 0 | 0 |
| White | 80 | 6 | 74 |
| Two or more races | 13 | 1 | 12 |
| Race Unknown | 0 | 0 | 0 |
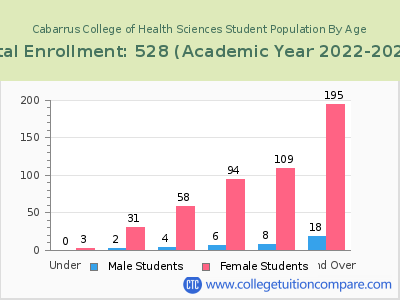
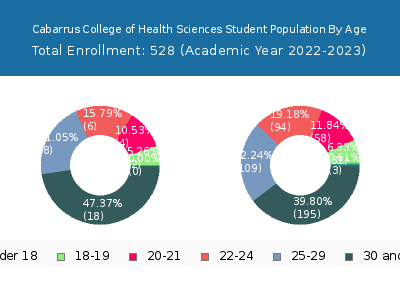
Student Age Distribution
Online Student Enrollment
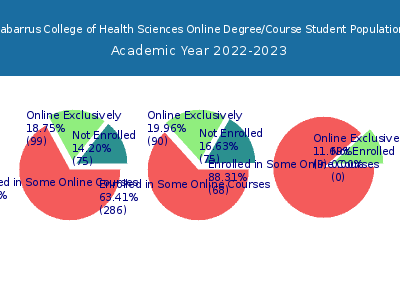
Distance learning, also called online education, is very attractive to students, especially who want to continue education and work in field. At Cabarrus College of Health Sciences, 99 students are enrolled exclusively in online courses and 354 students are enrolled in some online courses.
89 students lived in North Carolina or jurisdiction in which the school is located are enrolled exclusively in online courses and 10 students live in other State or outside of the United States.
| All Students | Enrolled Exclusively Online Courses | Enrolled in Some Online Courses | |
|---|---|---|---|
| All Students | 528 | 99 | 354 |
| Undergraduate | 451 | 90 | 286 |
| Graduate | 77 | 9 | 68 |
| North Carolina Residents | Other States in U.S. | Outside of U.S. | |
|---|---|---|---|
| All Students | 89 | 10 | 0 |
| Undergraduate | 81 | 9 | 0 |
| Graduate | 8 | 1 | 0 |
Transfer-in Students (Undergraduate)
Among 451 enrolled in undergraduate programs, 137 students have transferred-in from other institutions. The percentage of transfer-in students is 30.38%.57 students have transferred in as full-time status and 80 students transferred in as part-time status.
| Number of Students | |
|---|---|
| Regular Full-time | 78 |
| Transfer-in Full-time | 57 |
| Regular Part-time | 236 |
| Transfer-in Part-time | 80 |
