Student Population by Gender
United States Military Academy has a total of 4,393 enrolled students for the academic year 2022-2023. All 4,393 students are enrolled into undergraduate programs.
By gender, 3,394 male and 999 female students (the male-female ratio is 77:23) are attending the school. The gender distribution is based on the 2022-2023 data.
| Undergraduate | |
|---|---|
| Total | 4,393 |
| Men | 3,394 |
| Women | 999 |
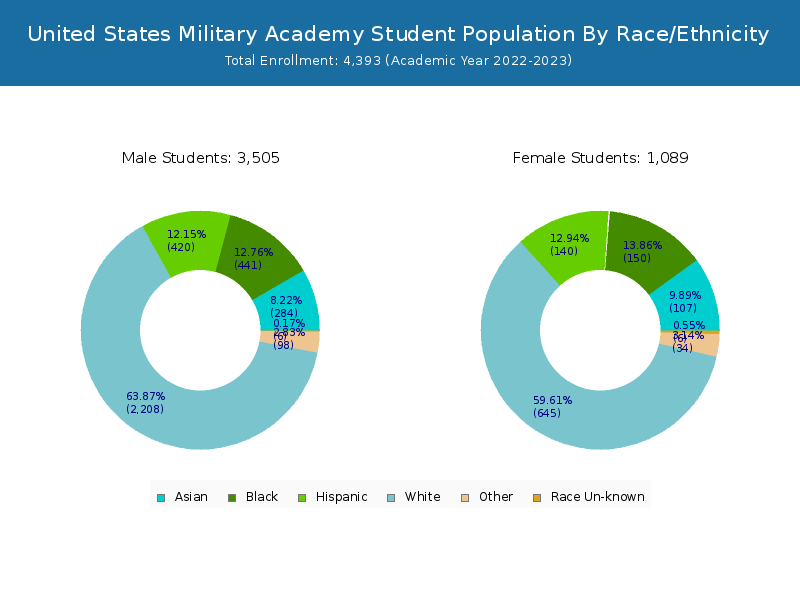
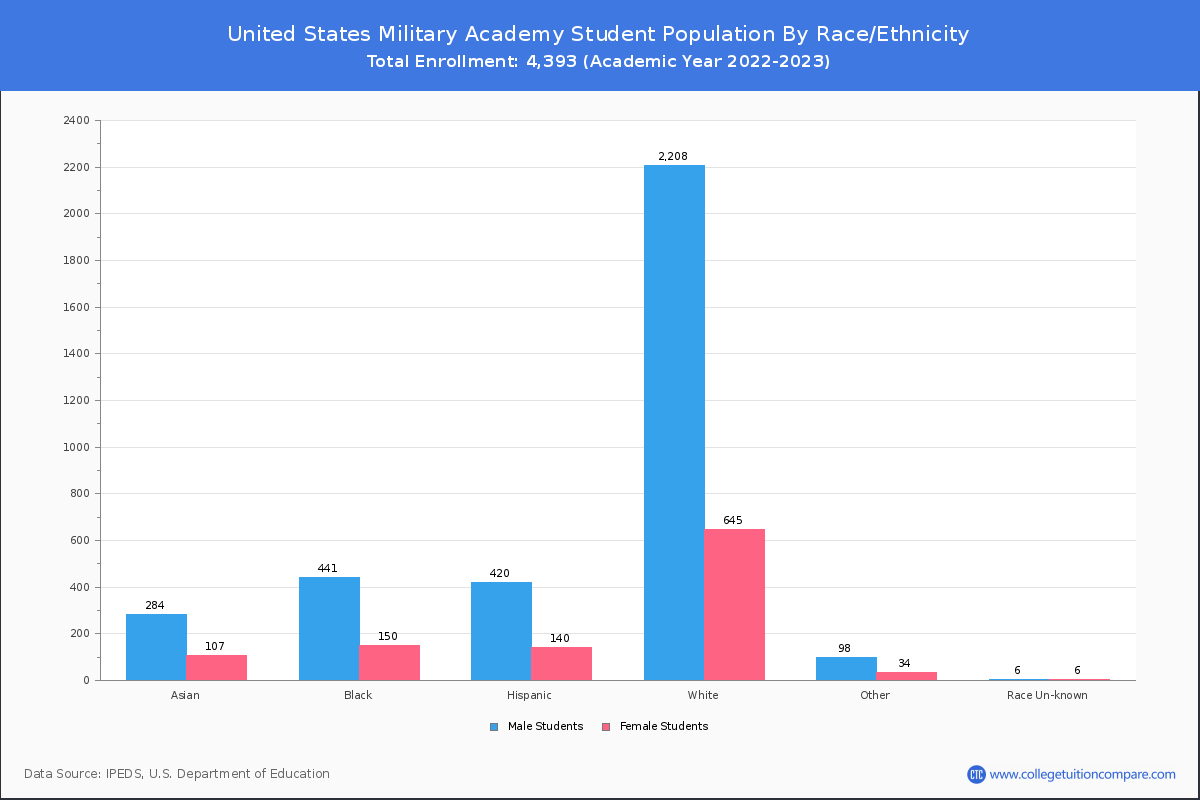
Student Distribution by Race/Ethnicity
By race/ethnicity, 2,693 White, 483 Black, and 414 Asian students out of a total of 4,393 are attending at United States Military Academy. Comprehensive enrollment statistic data by race/ethnicity is shown in the next chart (Academic year 2022-2023 data).
| Race | Total | Men | Women |
|---|---|---|---|
| American Indian or Native American | 38 | 31 | 7 |
| Asian | 414 | 306 | 108 |
| Black | 483 | 365 | 118 |
| Hispanic | 545 | 408 | 137 |
| Native Hawaiian or Other Pacific Islanders | 27 | 22 | 5 |
| White | 2,693 | 2,107 | 586 |
| Two or more races | 75 | 57 | 18 |
| Race Unknown | 59 | 47 | 12 |
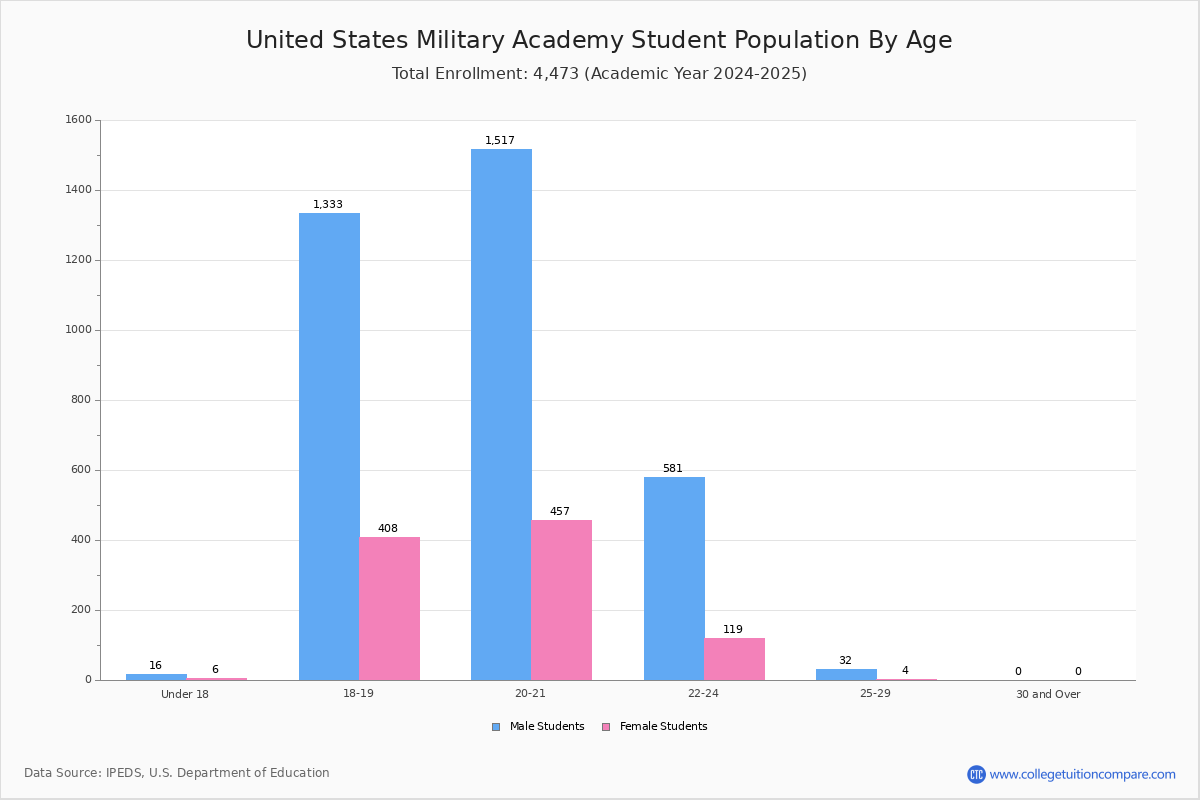
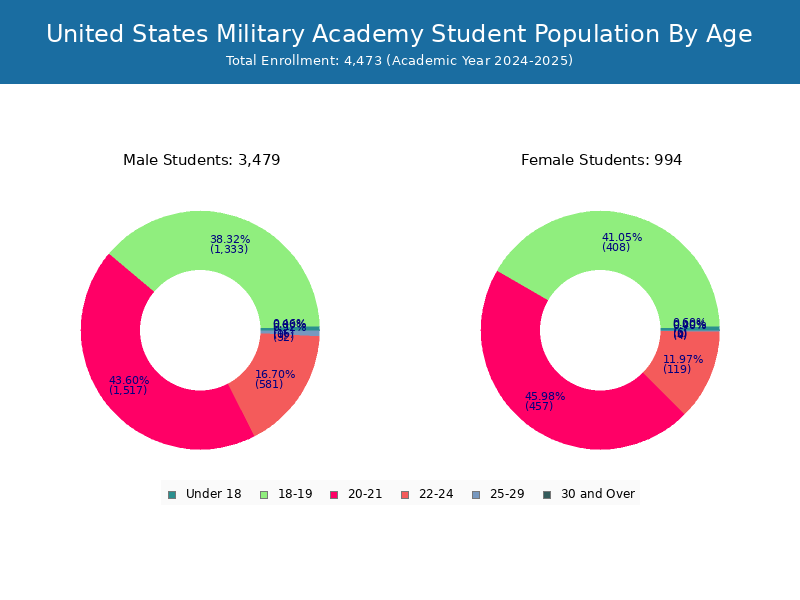
Student Age Distribution
There are 4,352 students under 25 years old, and 41 students over 25 years old out of 4,393 total students.
| Age | Total | Men | Women |
|---|---|---|---|
| Under 18 | 25 | 6 | 19 |
| 18-19 | 1,636 | 418 | 1,218 |
| 20-21 | 2,003 | 463 | 1,540 |
| 22-24 | 688 | 106 | 582 |
| 25-29 | 39 | 5 | 34 |
| 30-34 | 2 | 1 | 1 |