Student Population by Gender
Stony Brook University has a total of 25,710 enrolled students for the academic year 2022-2023. 17,509 students have enrolled in undergraduate programs and 8,201 students joined graduate programs.
By gender, 12,181 male and 13,529 female students (the male-female ratio is 47:53) are attending the school. The gender distribution is based on the 2022-2023 data.
| Total | Undergraduate | Graduate | |
|---|---|---|---|
| Total | 25,710 | 17,509 | 8,201 |
| Men | 12,181 | 8,610 | 3,571 |
| Women | 13,529 | 8,899 | 4,630 |
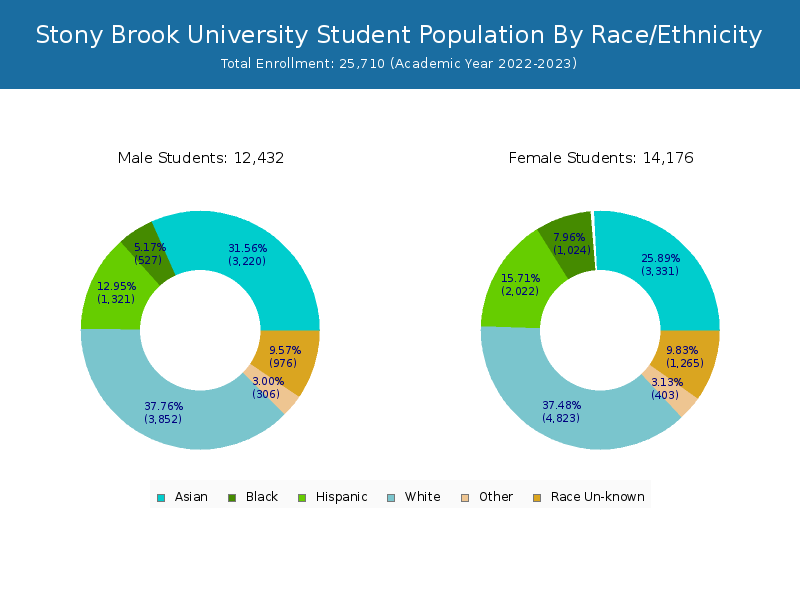
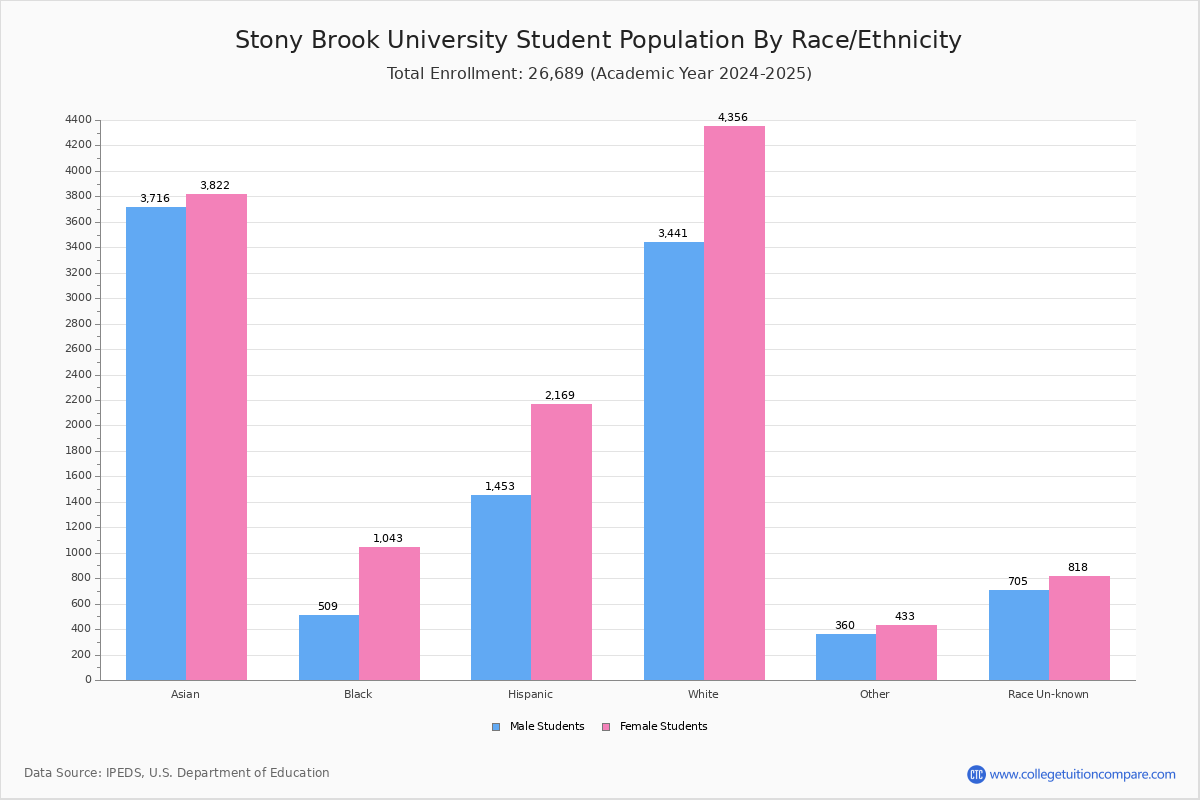
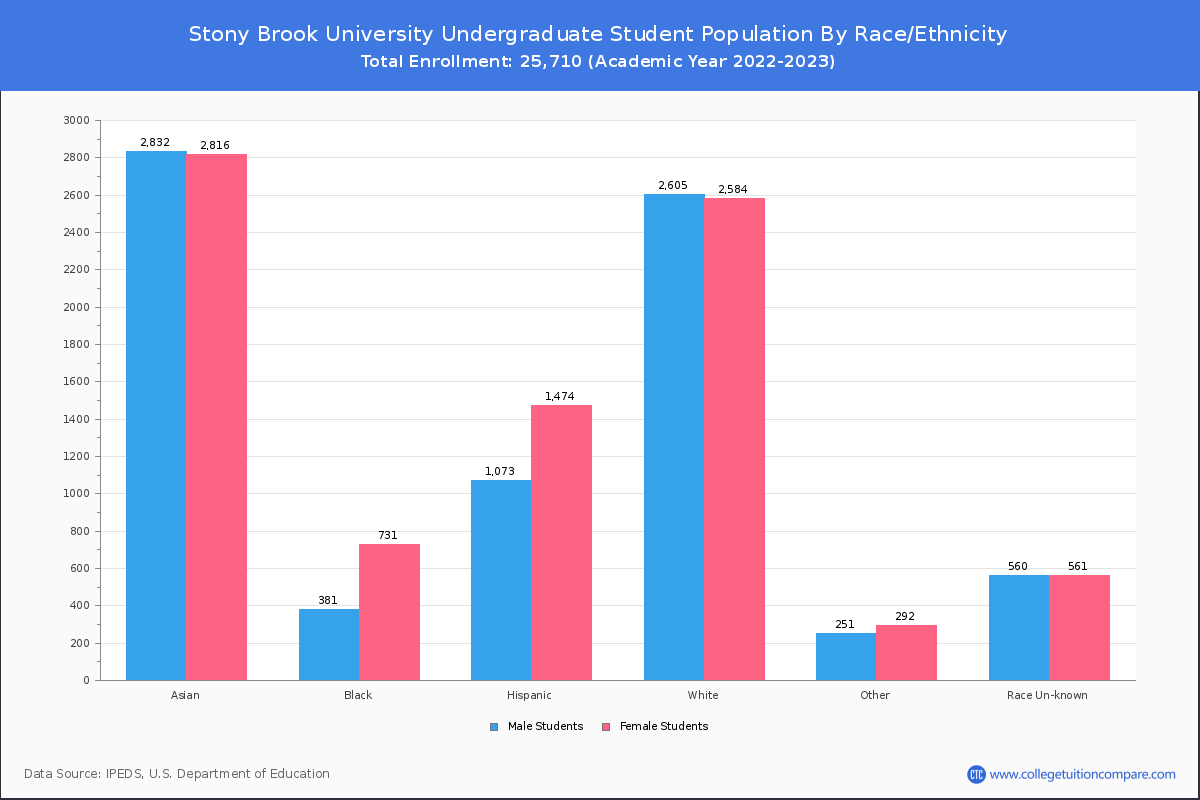
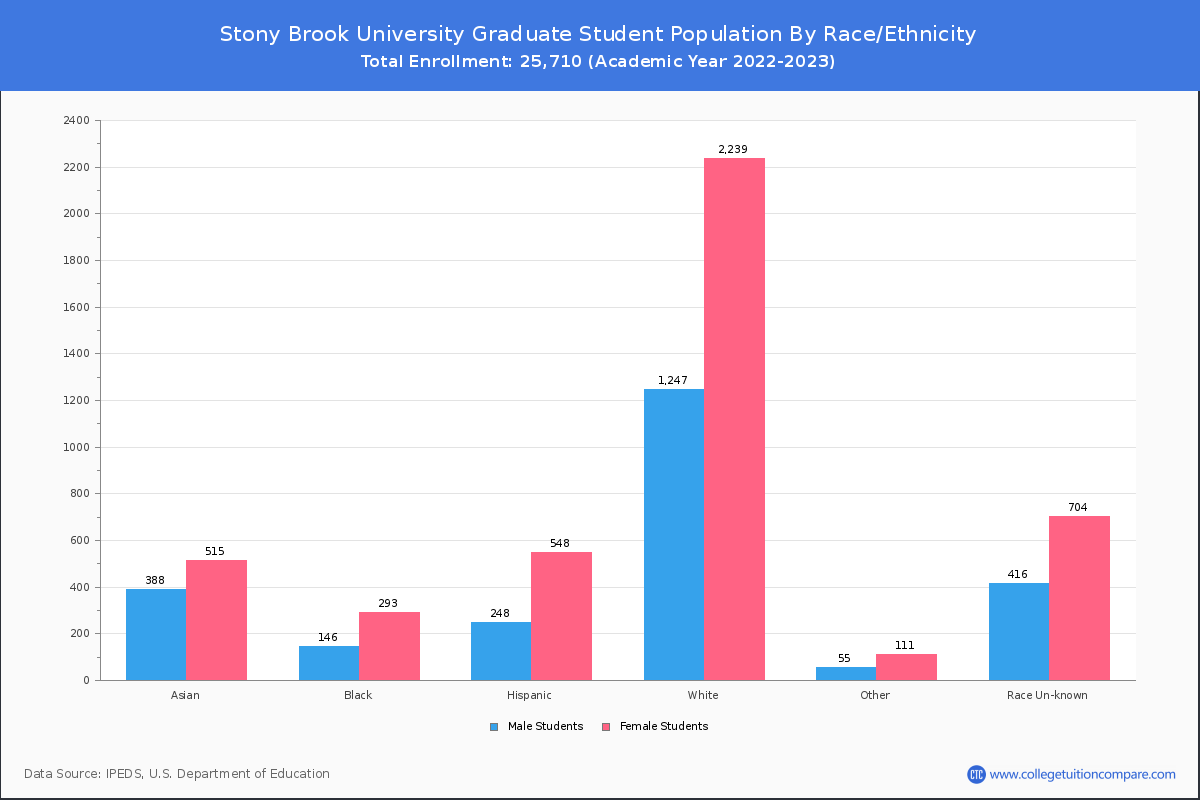
Student Distribution by Race/Ethnicity
By race/ethnicity, 7,844 White, 1,464 Black, and 6,829 Asian students out of a total of 25,710 are attending at Stony Brook University. Comprehensive enrollment statistic data by race/ethnicity is shown in the next chart (Academic year 2022-2023 data).
| Race | Total | Men | Women |
|---|---|---|---|
| American Indian or Native American | 17 | 7 | 10 |
| Asian | 6,829 | 3,369 | 3,460 |
| Black | 1,464 | 521 | 943 |
| Hispanic | 3,316 | 1,327 | 1,989 |
| Native Hawaiian or Other Pacific Islanders | 17 | 9 | 8 |
| White | 7,844 | 3,504 | 4,340 |
| Two or more races | 625 | 273 | 352 |
| Race Unknown | 2,002 | 885 | 1,117 |
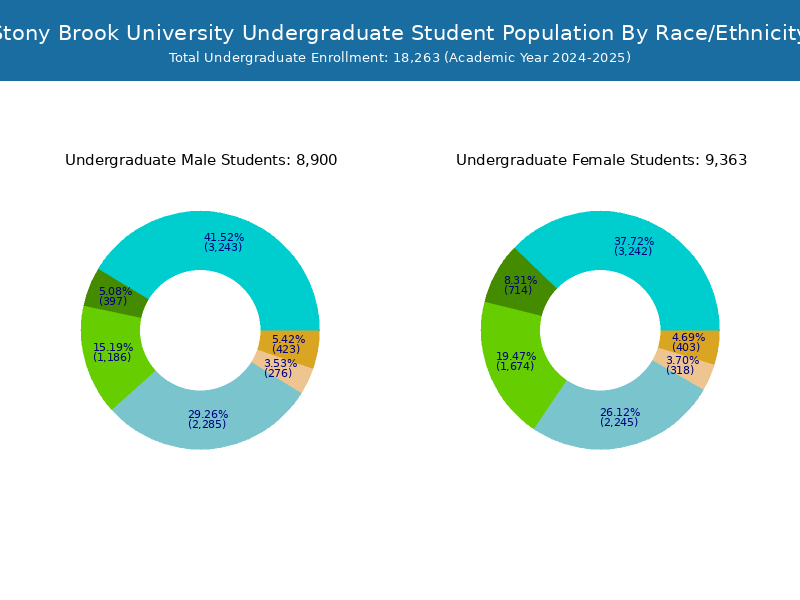
| Race | Total | Men | Women |
|---|---|---|---|
| American Indian or Native American | 12 | 4 | 8 |
| Asian | 5,917 | 2,984 | 2,933 |
| Black | 1,050 | 375 | 675 |
| Hispanic | 2,590 | 1,089 | 1,501 |
| Native Hawaiian or Other Pacific Islanders | 11 | 6 | 5 |
| White | 4,785 | 2,409 | 2,376 |
| Two or more races | 480 | 216 | 264 |
| Race Unknown | 928 | 478 | 450 |
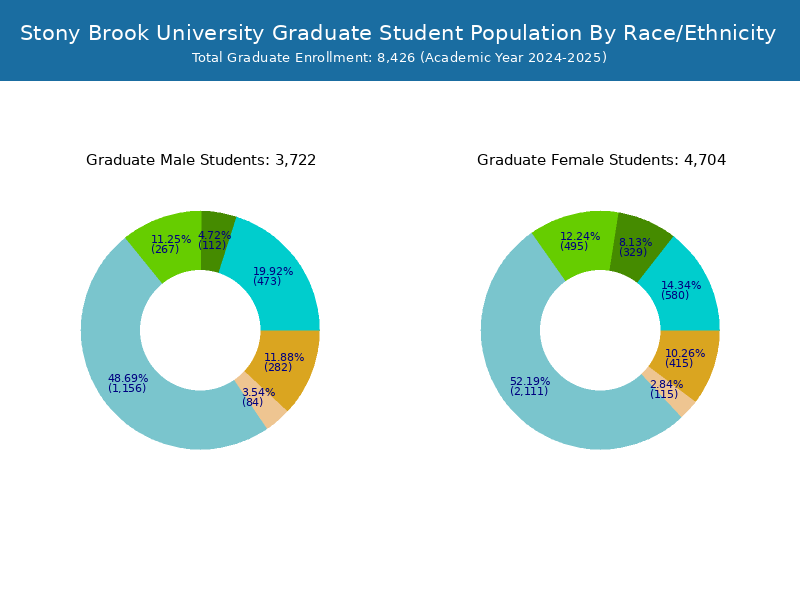
| Race | Total | Men | Women |
|---|---|---|---|
| American Indian or Native American | 2 | 1 | 1 |
| Asian | 222 | 112 | 110 |
| Black | 87 | 24 | 63 |
| Hispanic | 233 | 92 | 141 |
| Native Hawaiian or Other Pacific Islanders | 1 | 1 | 0 |
| White | 487 | 216 | 271 |
| Two or more races | 39 | 17 | 22 |
| Race Unknown | 44 | 21 | 23 |
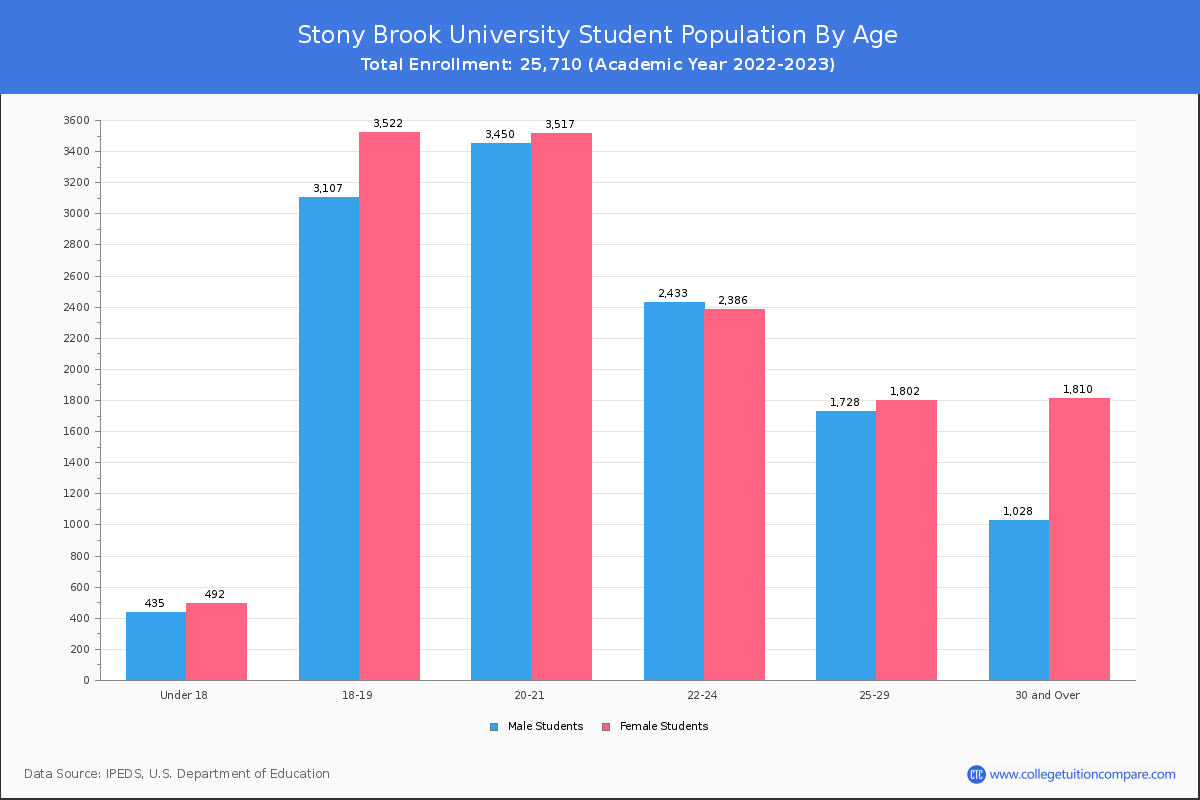
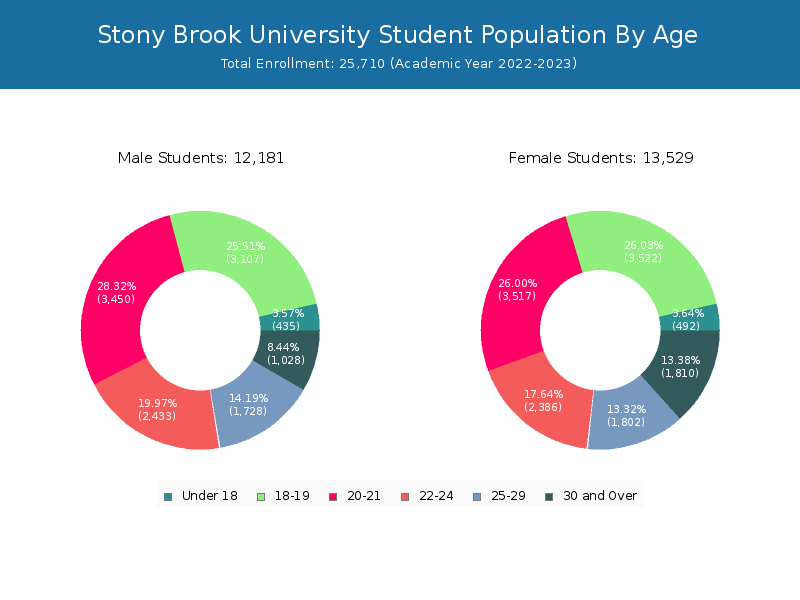
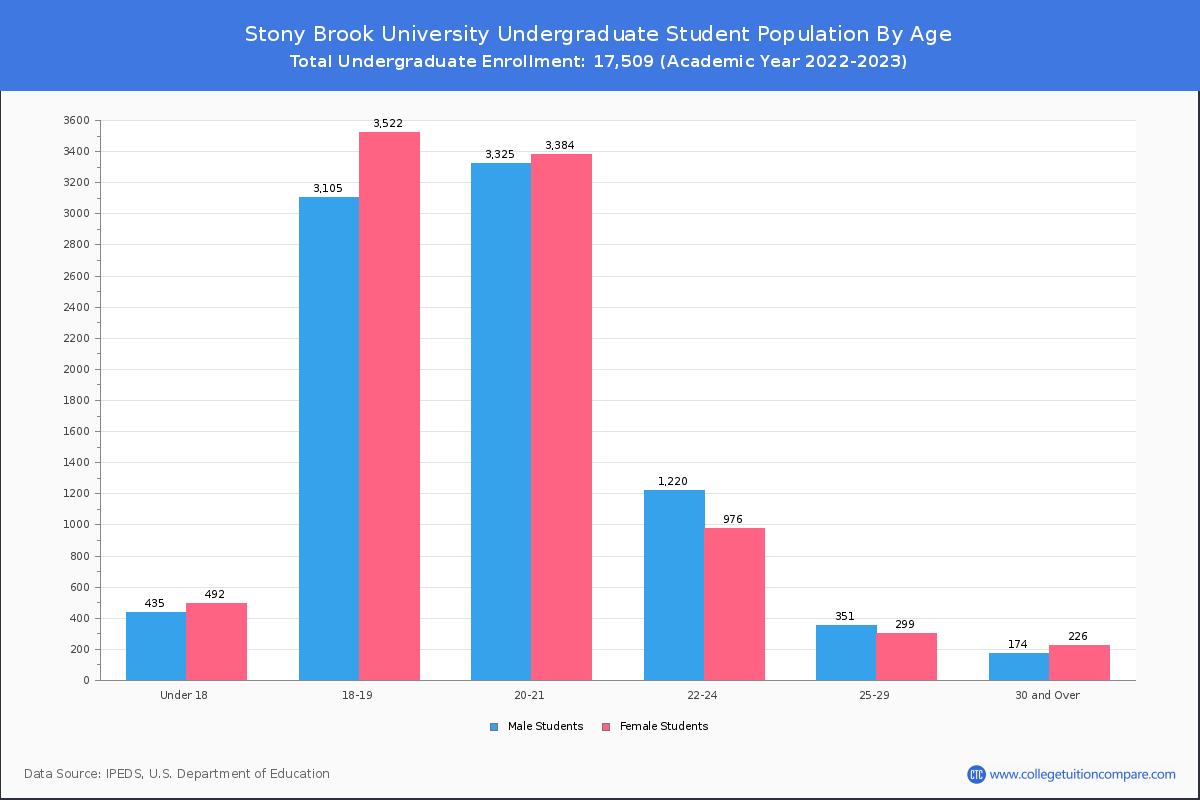
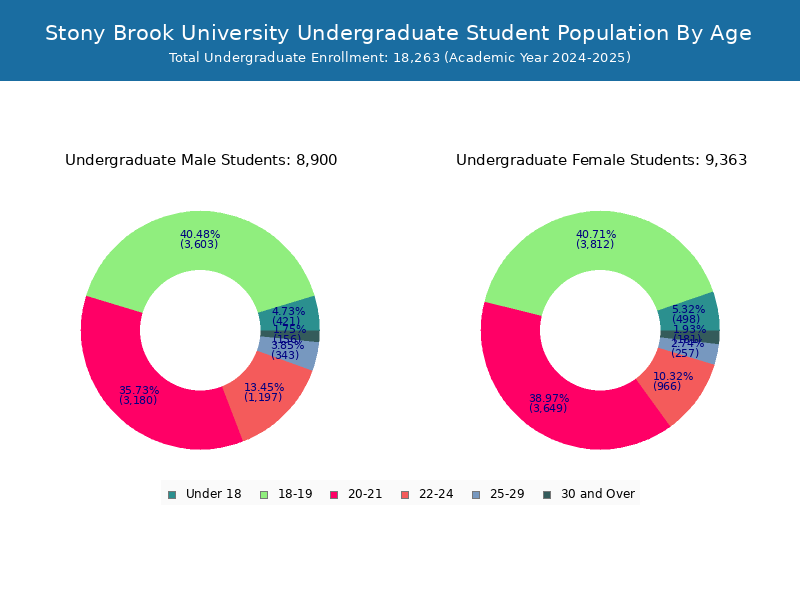
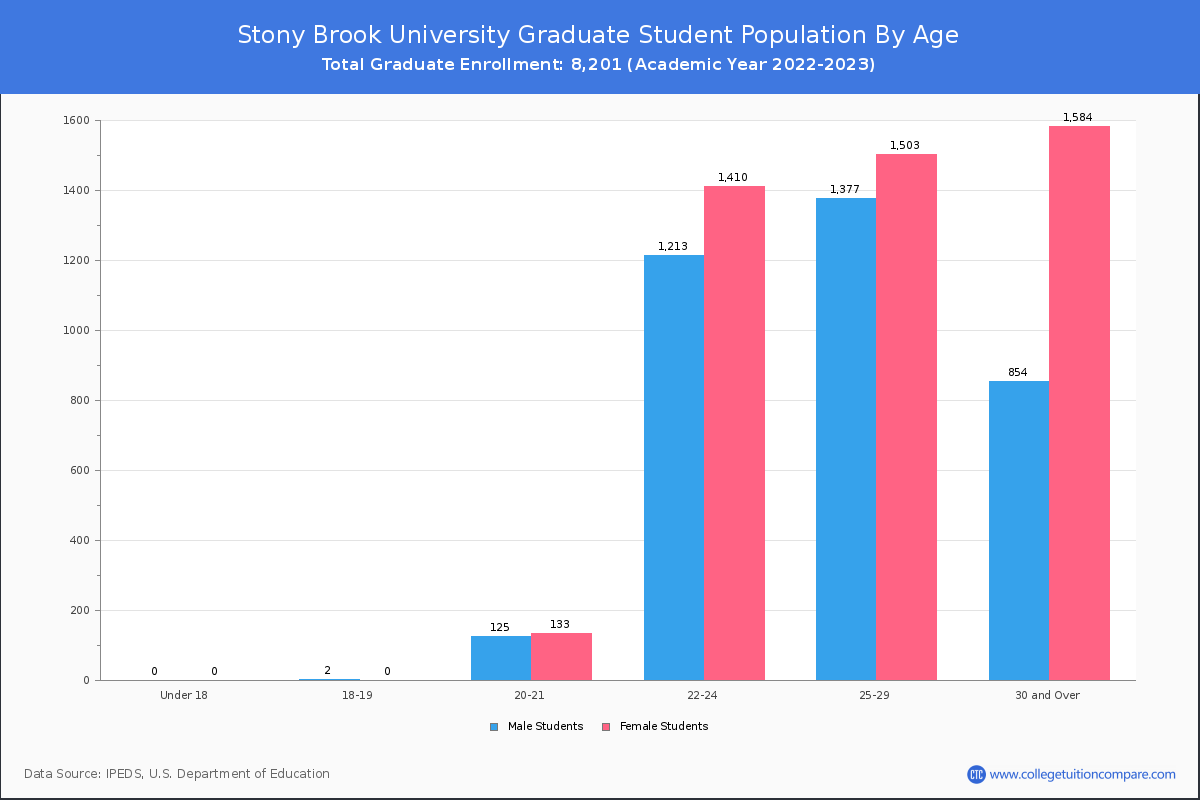
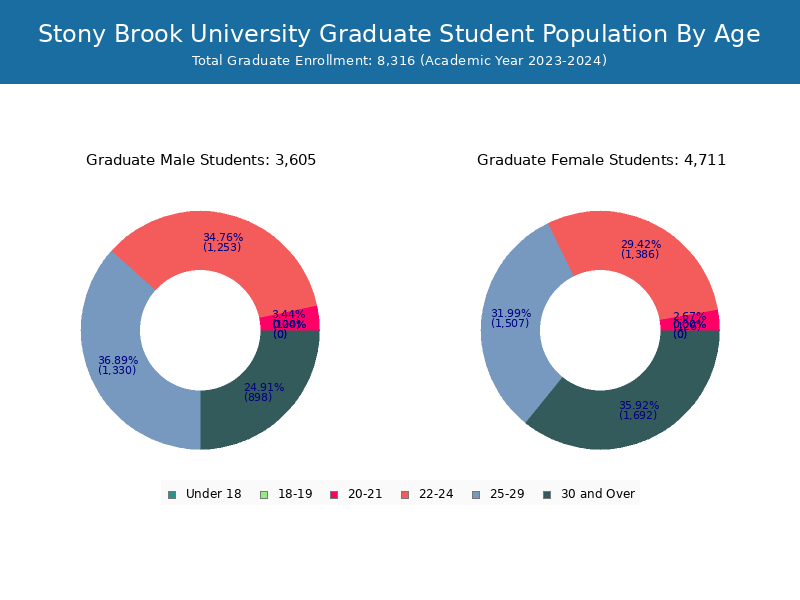
Student Age Distribution
By age, SUNY Stony Brook has 927 students under 18 years old and 16 students over 65 years old. There are 19,342 students under 25 years old, and 6,368 students over 25 years old out of 25,710 total students.
SUNY Stony Brook has 16,459 undergraduate students aged under 25 and 1,050 students aged 25 and over.
It has 2,883 graduate students aged under 25 and 5,318 students aged 25 and over.
| Age | Total | Men | Women |
|---|---|---|---|
| Under 18 | 927 | 492 | 435 |
| 18-19 | 6,629 | 3,522 | 3,107 |
| 20-21 | 6,967 | 3,517 | 3,450 |
| 22-24 | 4,819 | 2,386 | 2,433 |
| 25-29 | 3,530 | 1,802 | 1,728 |
| 30-34 | 1,340 | 794 | 546 |
| 35-39 | 587 | 384 | 203 |
| 40-49 | 634 | 431 | 203 |
| 50-64 | 261 | 194 | 67 |
| Over 65 | 16 | 7 | 9 |
| Age | Total | Men | Women |
|---|---|---|---|
| Under 18 | 927 | 492 | 435 |
| 18-19 | 6,627 | 3,522 | 3,105 |
| 20-21 | 6,709 | 3,384 | 3,325 |
| 22-24 | 2,196 | 976 | 1,220 |
| 25-29 | 650 | 299 | 351 |
| 30-34 | 204 | 113 | 91 |
| 35-39 | 94 | 56 | 38 |
| 40-49 | 75 | 42 | 33 |
| 50-64 | 27 | 15 | 12 |
| Age | Total | Men | Women |
|---|
Online Student Enrollment
Distance learning, also called online education, is very attractive to students, especially who want to continue education and work in field. At Stony Brook University, 2,171 students are enrolled exclusively in online courses and 13,828 students are enrolled in some online courses.
1,999 students lived in New York or jurisdiction in which the school is located are enrolled exclusively in online courses and 172 students live in other State or outside of the United States.
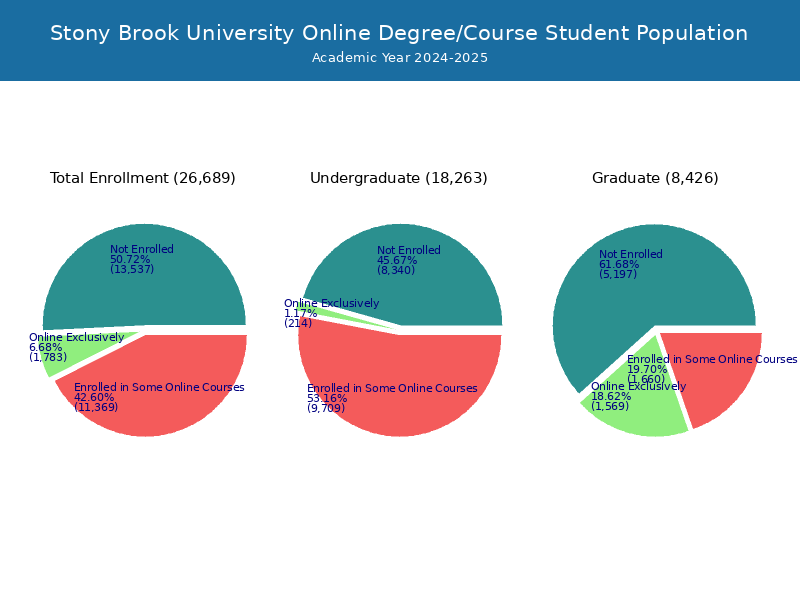
| All Students | Enrolled Exclusively Online Courses | Enrolled in Some Online Courses | |
|---|---|---|---|
| All Students | 25,710 | 2,171 | 13,828 |
| Undergraduate | 17,509 | 636 | 11,919 |
| Graduate | 8,201 | 1,535 | 1,909 |
| New York Residents | Other States in U.S. | Outside of U.S. | |
|---|---|---|---|
| All Students | 1,999 | 142 | 30 |
| Undergraduate | 570 | 40 | 26 |
| Graduate | 1,429 | 102 | 4 |
Transfer-in Students (Undergraduate)
Among 17,509 enrolled in undergraduate programs, 1,179 students have transferred-in from other institutions. The percentage of transfer-in students is 6.73%.1,093 students have transferred in as full-time status and 86 students transferred in as part-time status.
| Number of Students | |
|---|---|
| Regular Full-time | 15,313 |
| Transfer-in Full-time | 1,093 |
| Regular Part-time | 1,017 |
| Transfer-in Part-time | 86 |