Student Population by Gender
SUNY College of Technology at Delhi has a total of 2,612 enrolled students for the academic year 2022-2023. 2,478 students have enrolled in undergraduate programs and 134 students joined graduate programs.
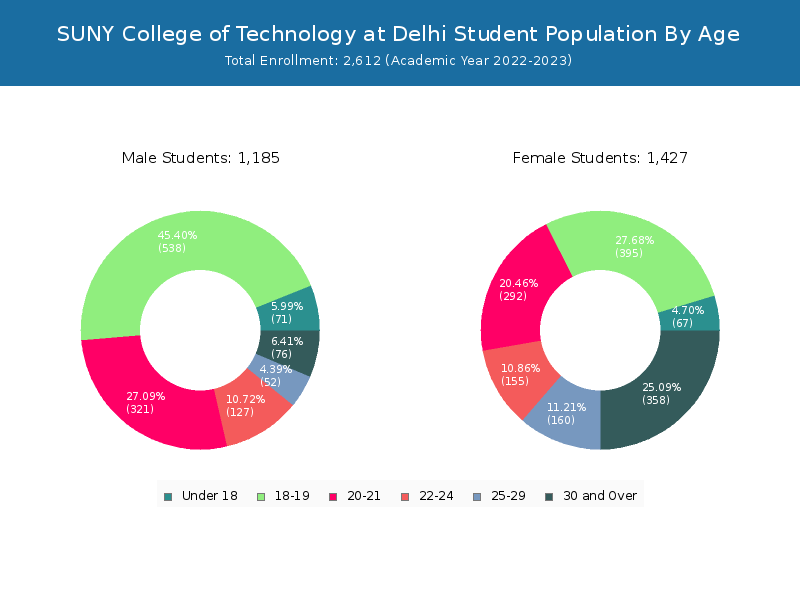
By gender, 1,185 male and 1,427 female students (the male-female ratio is 45:55) are attending the school. The gender distribution is based on the 2022-2023 data.
| Total | Undergraduate | Graduate | |
|---|---|---|---|
| Total | 2,612 | 2,478 | 134 |
| Men | 1,185 | 1,174 | 11 |
| Women | 1,427 | 1,304 | 123 |
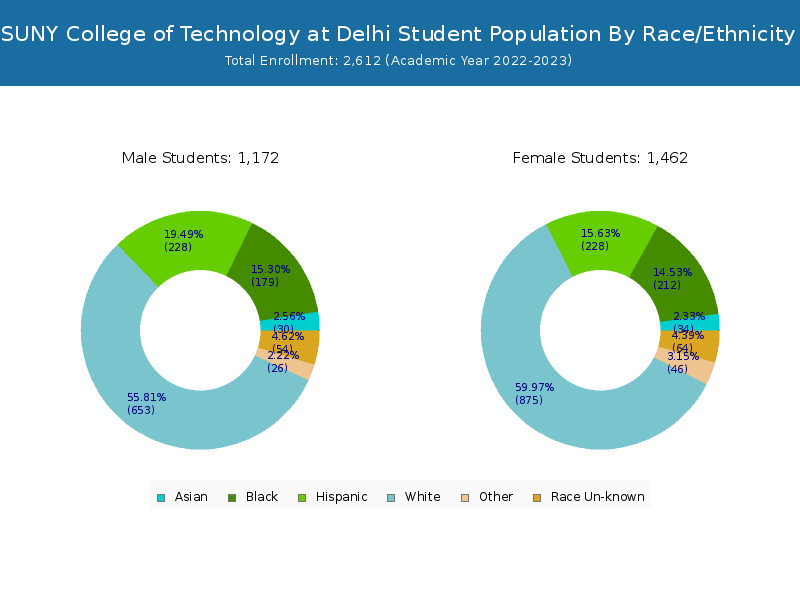
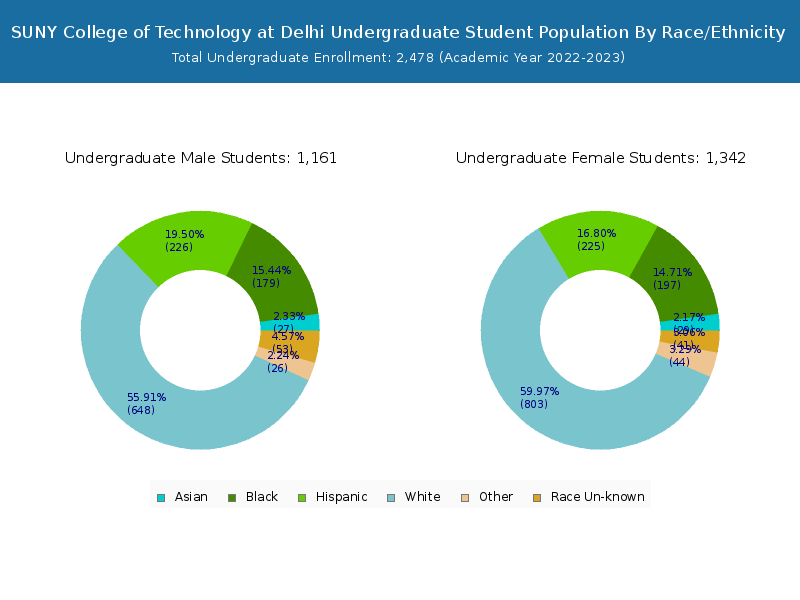
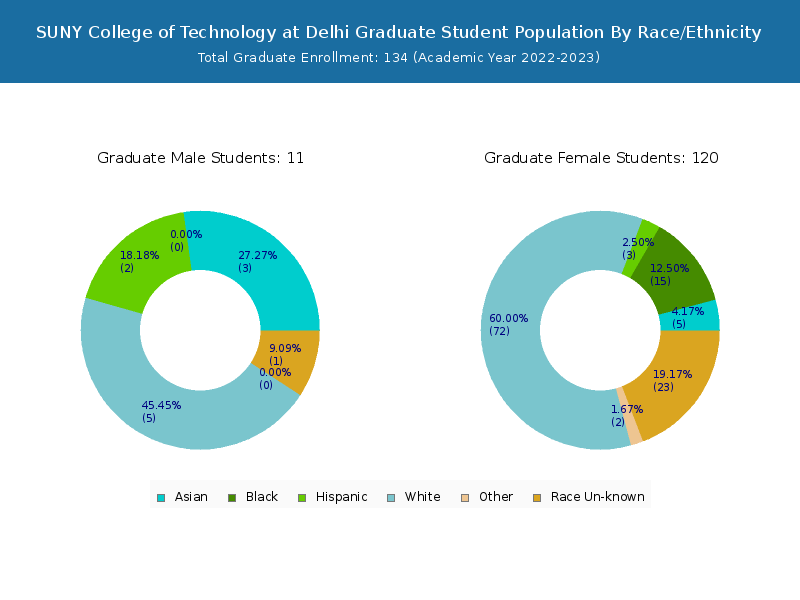
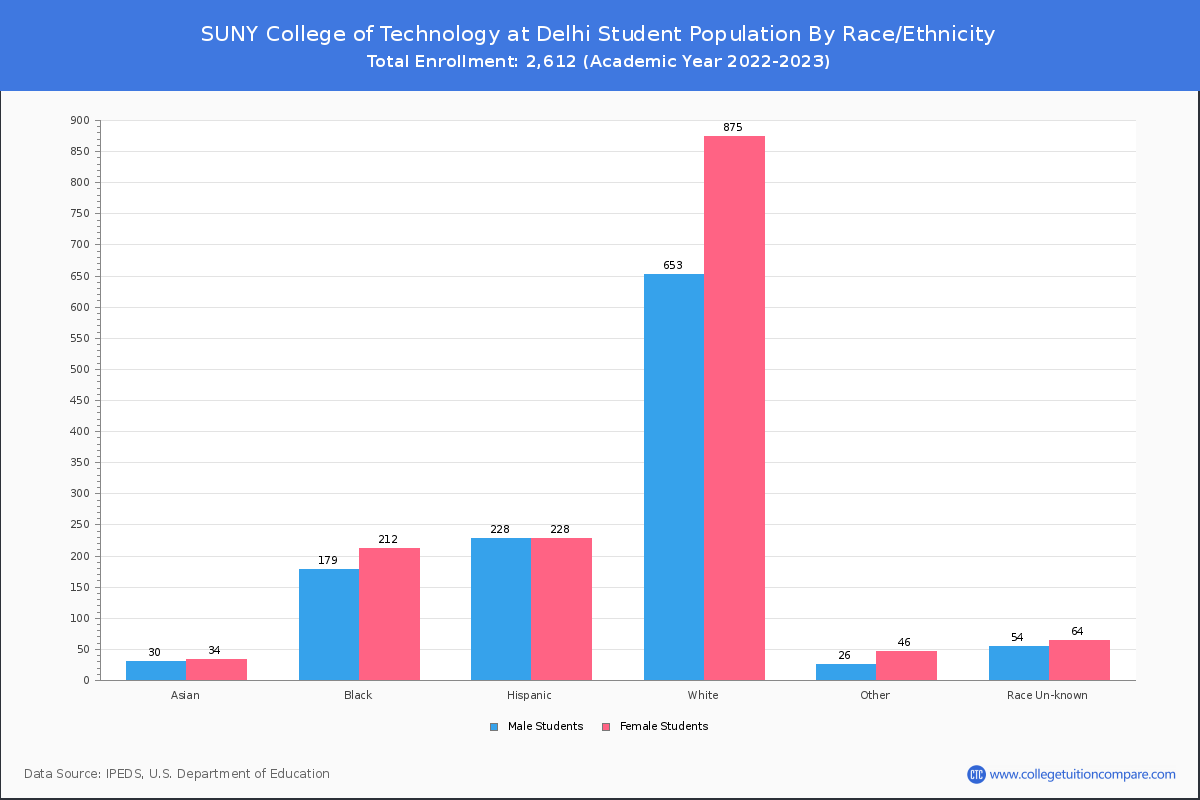
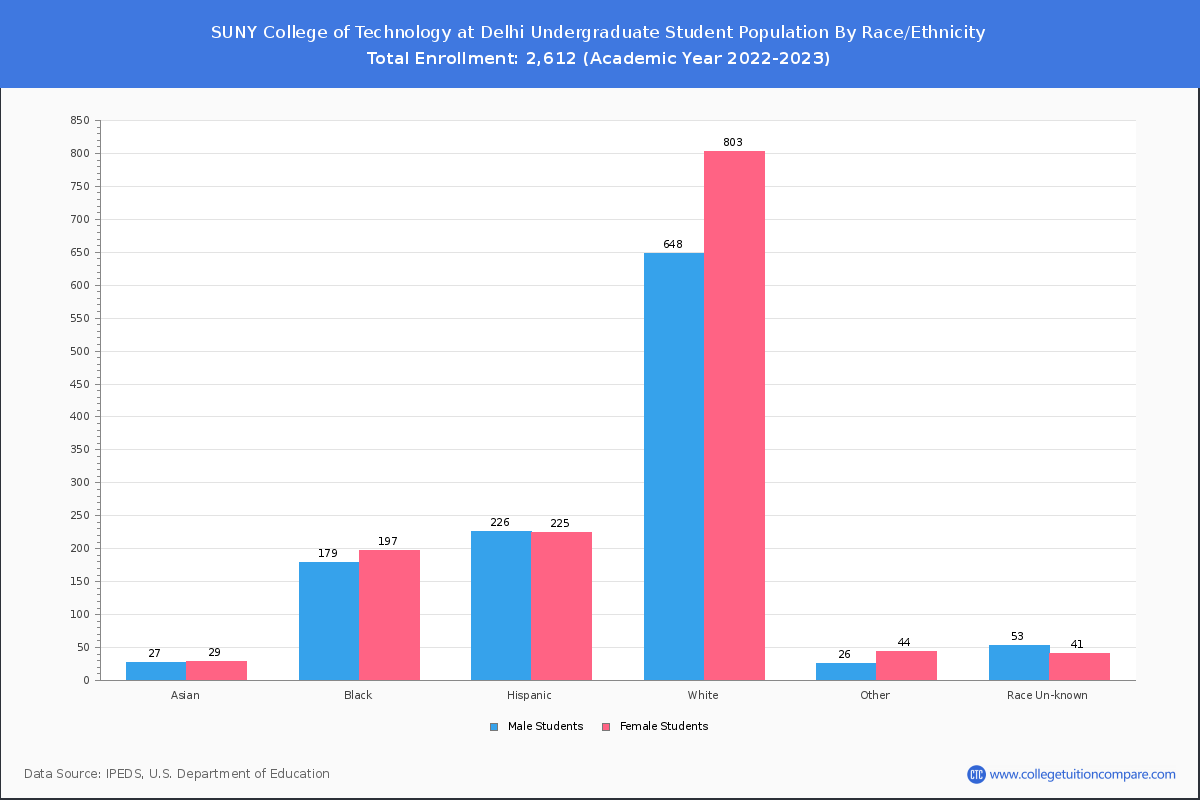
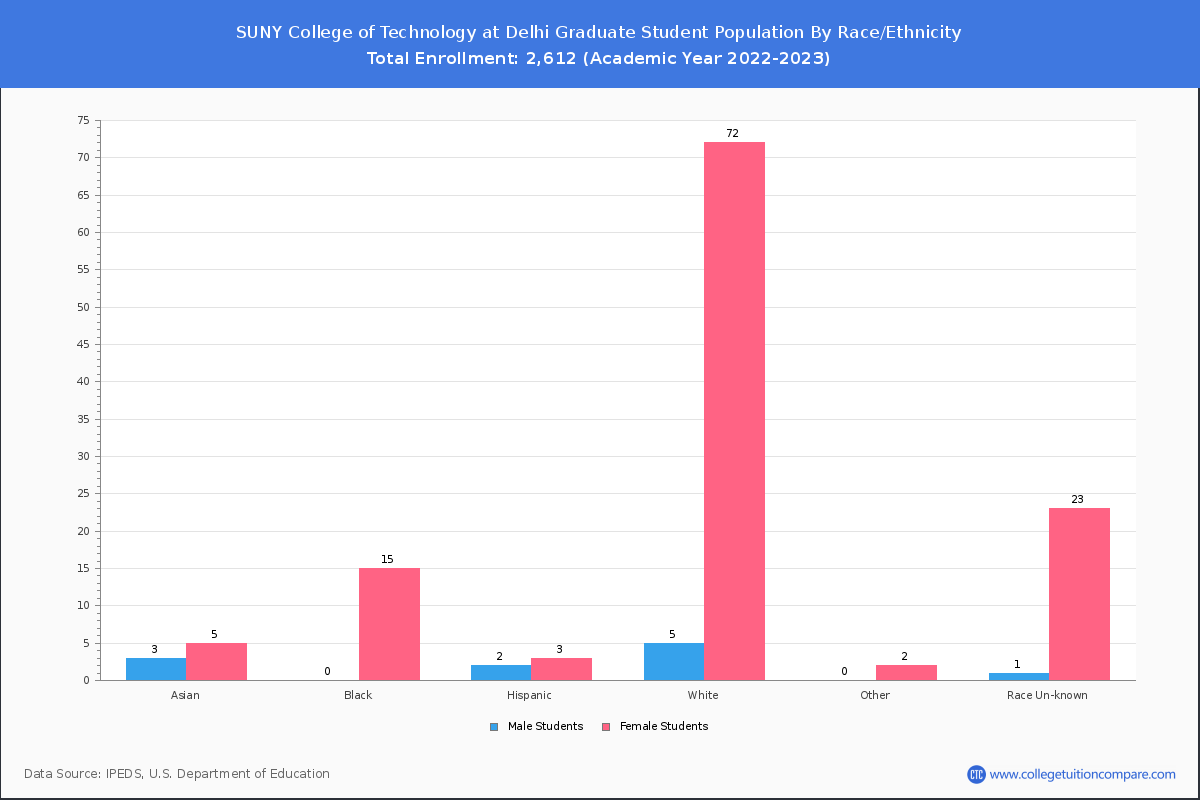
Student Distribution by Race/Ethnicity
By race/ethnicity, 1,522 White, 392 Black, and 56 Asian students out of a total of 2,612 are attending at SUNY College of Technology at Delhi. Comprehensive enrollment statistic data by race/ethnicity is shown in the next chart (Academic year 2022-2023 data).
| Race | Total | Men | Women |
|---|---|---|---|
| American Indian or Native American | 7 | 3 | 4 |
| Asian | 56 | 22 | 34 |
| Black | 392 | 188 | 204 |
| Hispanic | 449 | 215 | 234 |
| Native Hawaiian or Other Pacific Islanders | 2 | 1 | 1 |
| White | 1,522 | 679 | 843 |
| Two or more races | 71 | 31 | 40 |
| Race Unknown | 106 | 42 | 64 |
| Race | Total | Men | Women |
|---|---|---|---|
| American Indian or Native American | 7 | 3 | 4 |
| Asian | 50 | 21 | 29 |
| Black | 378 | 188 | 190 |
| Hispanic | 438 | 213 | 225 |
| Native Hawaiian or Other Pacific Islanders | 2 | 1 | 1 |
| White | 1,455 | 672 | 783 |
| Two or more races | 69 | 31 | 38 |
| Race Unknown | 72 | 41 | 31 |
| Race | Total | Men | Women |
|---|---|---|---|
| American Indian or Native American | 0 | 0 | 0 |
| Asian | 9 | 3 | 6 |
| Black | 33 | 15 | 18 |
| Hispanic | 29 | 8 | 21 |
| Native Hawaiian or Other Pacific Islanders | 0 | 0 | 0 |
| White | 148 | 45 | 103 |
| Two or more races | 6 | 1 | 5 |
| Race Unknown | 6 | 3 | 3 |
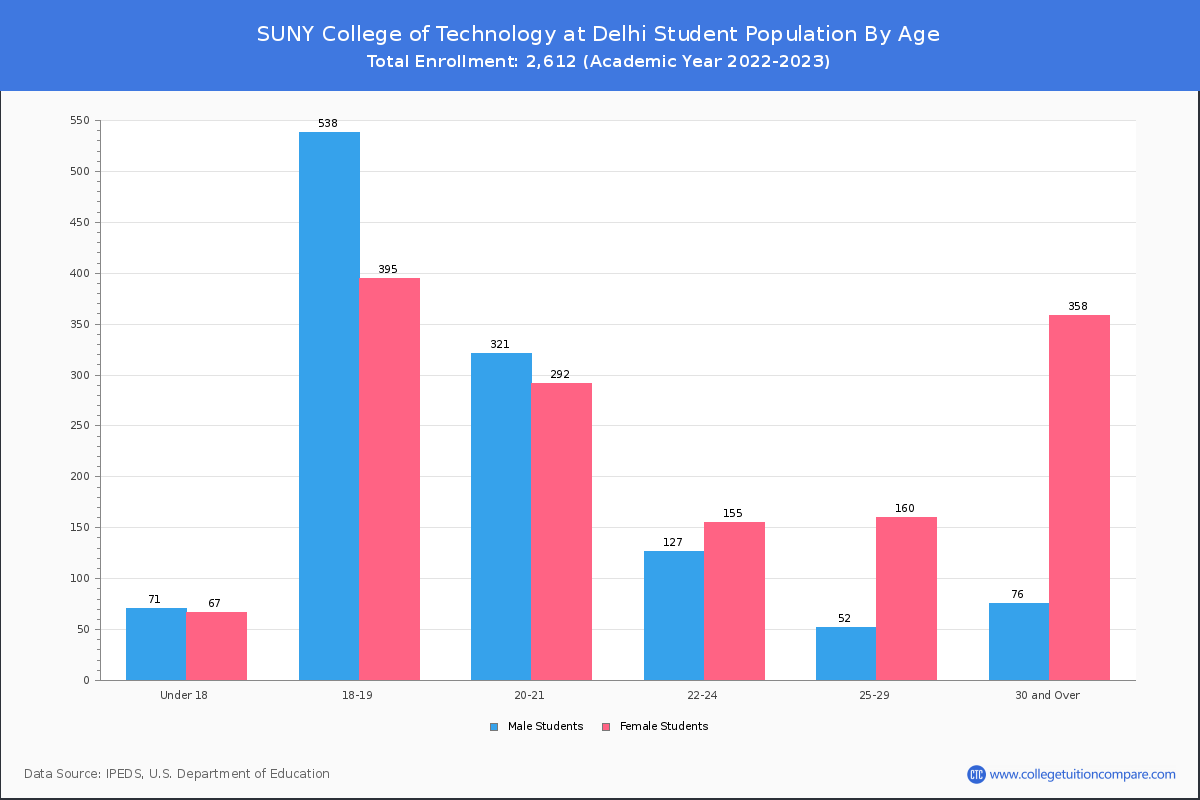
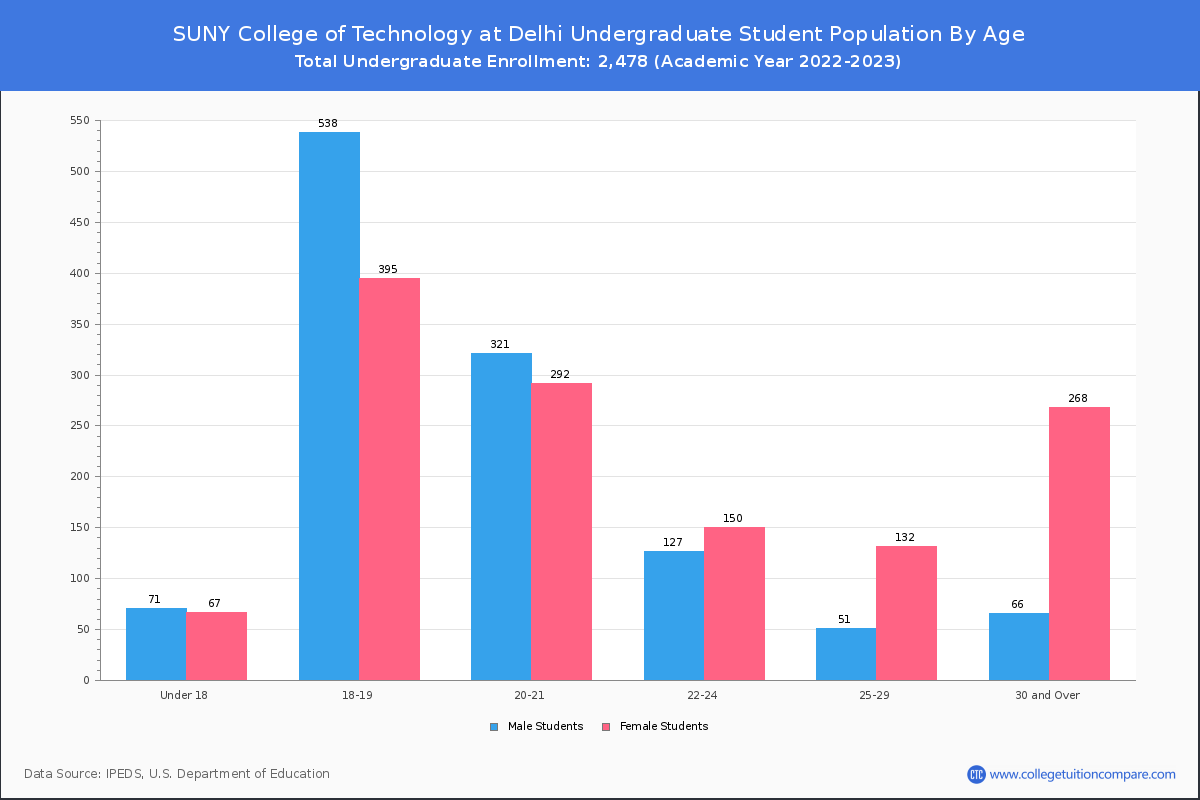
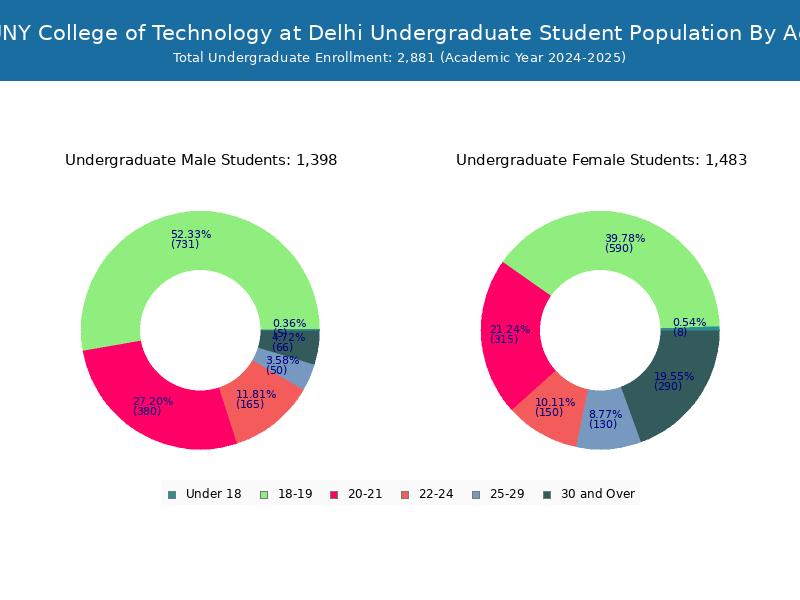
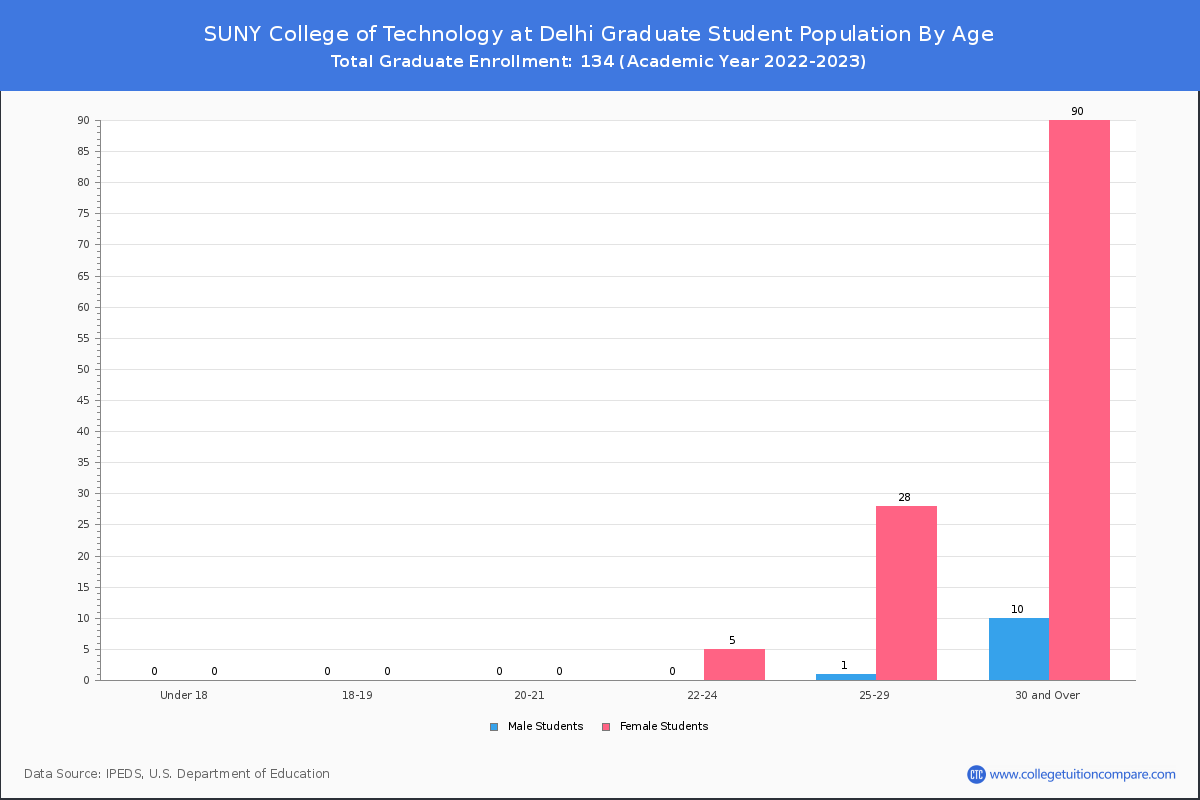
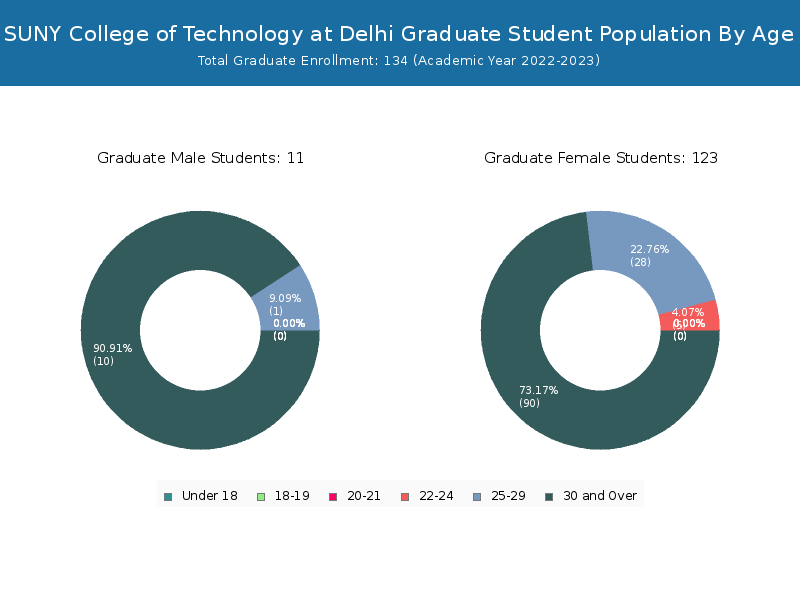
Student Age Distribution
There are 1,966 students under 25 years old, and 646 students over 25 years old out of 2,612 total students.
SUNY Delhi has 1,961 undergraduate students aged under 25 and 517 students aged 25 and over.
It has 5 graduate students aged under 25 and 129 students aged 25 and over.
| Age | Total | Men | Women |
|---|---|---|---|
| Under 18 | 138 | 67 | 71 |
| 18-19 | 933 | 395 | 538 |
| 20-21 | 613 | 292 | 321 |
| 22-24 | 282 | 155 | 127 |
| 25-29 | 212 | 160 | 52 |
| 30-34 | 155 | 129 | 26 |
| 35-39 | 111 | 91 | 20 |
| 40-49 | 116 | 99 | 17 |
| 50-64 | 52 | 39 | 13 |
| Age | Total | Men | Women |
|---|---|---|---|
| Under 18 | 138 | 67 | 71 |
| 18-19 | 933 | 395 | 538 |
| 20-21 | 613 | 292 | 321 |
| 22-24 | 277 | 150 | 127 |
| 25-29 | 183 | 132 | 51 |
| 30-34 | 127 | 103 | 24 |
| 35-39 | 86 | 68 | 18 |
| 40-49 | 91 | 76 | 15 |
| 50-64 | 30 | 21 | 9 |
| Age | Total | Men | Women |
|---|
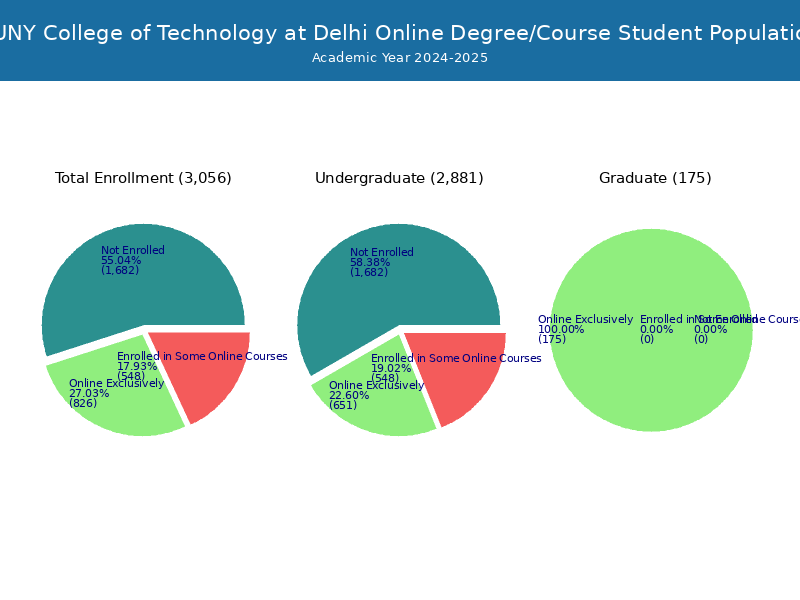
Online Student Enrollment
Distance learning, also called online education, is very attractive to students, especially who want to continue education and work in field. At SUNY College of Technology at Delhi, 725 students are enrolled exclusively in online courses and 606 students are enrolled in some online courses.
704 students lived in New York or jurisdiction in which the school is located are enrolled exclusively in online courses and 21 students live in other State or outside of the United States.
| All Students | Enrolled Exclusively Online Courses | Enrolled in Some Online Courses | |
|---|---|---|---|
| All Students | 2,612 | 725 | 606 |
| Undergraduate | 2,478 | 591 | 606 |
| Graduate | 134 | 134 | 0 |
| New York Residents | Other States in U.S. | Outside of U.S. | |
|---|---|---|---|
| All Students | 704 | 21 | 0 |
| Undergraduate | 577 | 14 | 0 |
| Graduate | 127 | 7 | 0 |
Transfer-in Students (Undergraduate)
Among 2,478 enrolled in undergraduate programs, 232 students have transferred-in from other institutions. The percentage of transfer-in students is 9.36%.153 students have transferred in as full-time status and 79 students transferred in as part-time status.
| Number of Students | |
|---|---|
| Regular Full-time | 1,868 |
| Transfer-in Full-time | 153 |
| Regular Part-time | 378 |
| Transfer-in Part-time | 79 |