Student Population by Gender
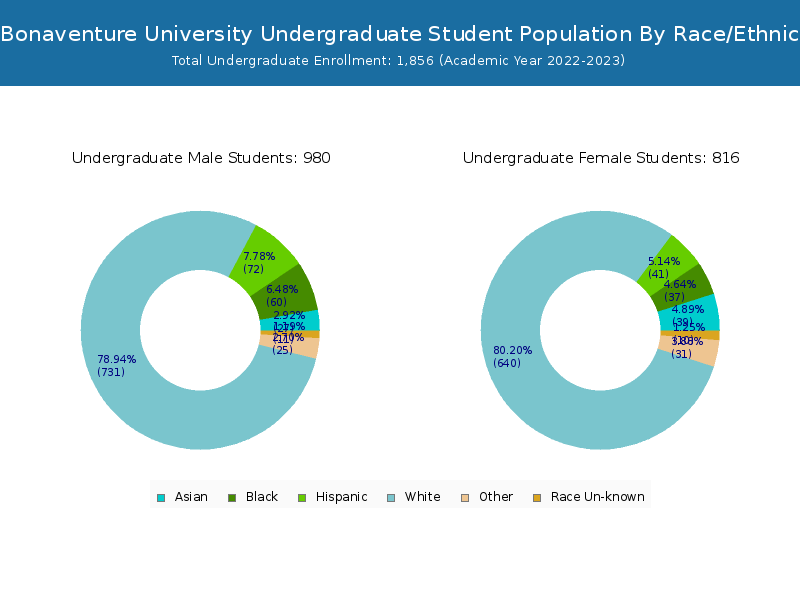
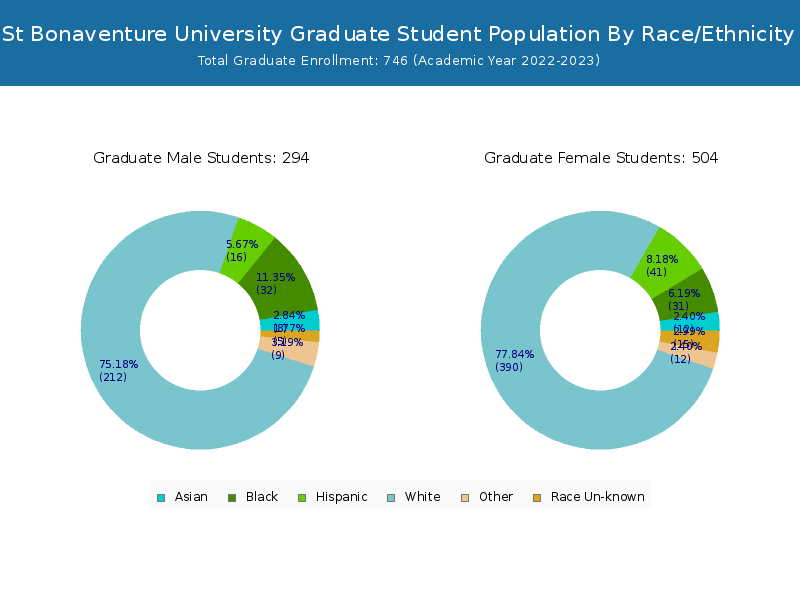
St Bonaventure University has a total of 2,602 enrolled students for the academic year 2022-2023. 1,856 students have enrolled in undergraduate programs and 746 students joined graduate programs.
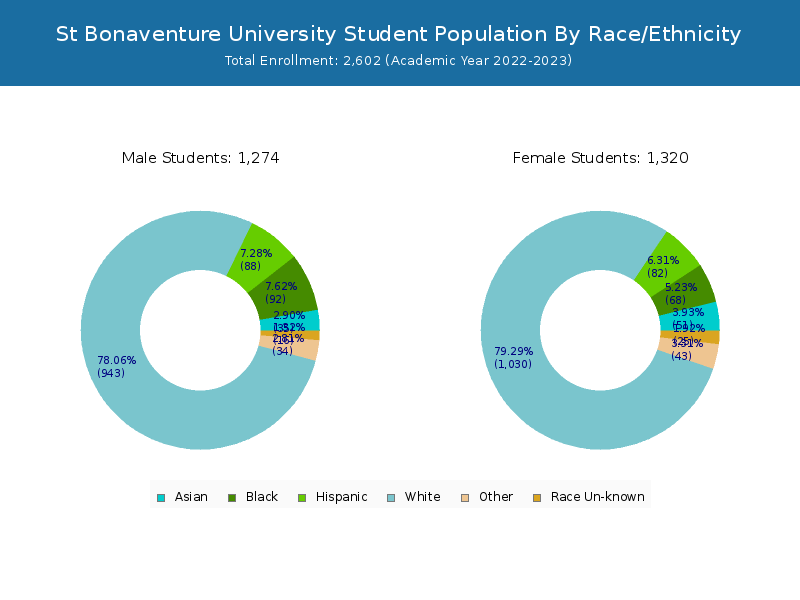
By gender, 1,294 male and 1,308 female students (the male-female ratio is 50:50) are attending the school. The gender distribution is based on the 2022-2023 data.
| Total | Undergraduate | Graduate | |
|---|---|---|---|
| Total | 2,602 | 1,856 | 746 |
| Men | 1,294 | 1,019 | 275 |
| Women | 1,308 | 837 | 471 |
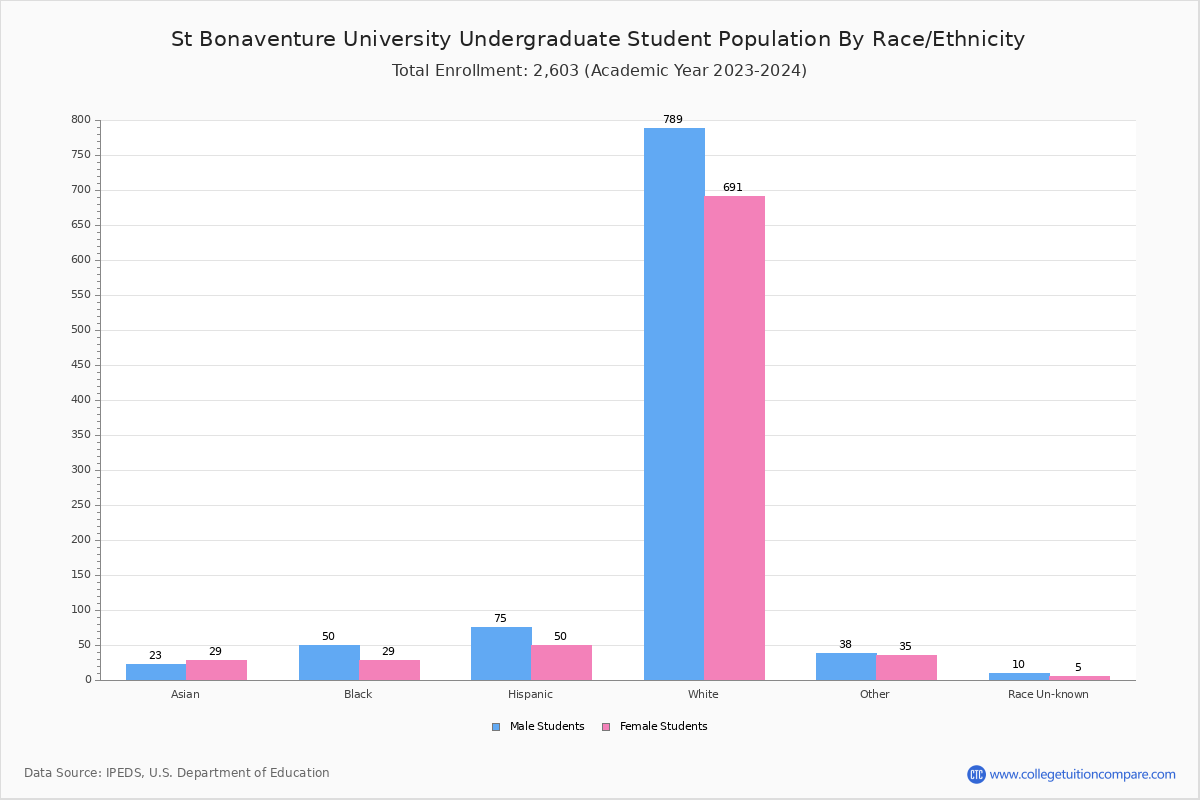
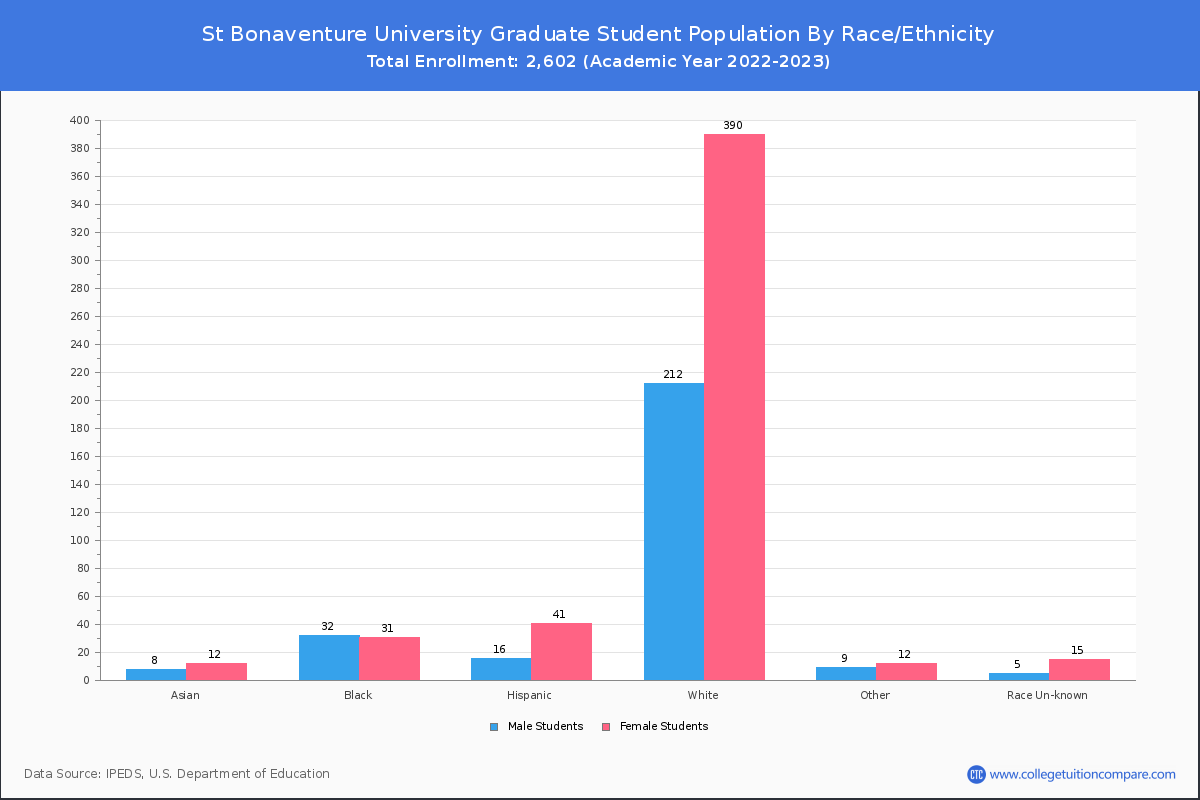
Student Distribution by Race/Ethnicity
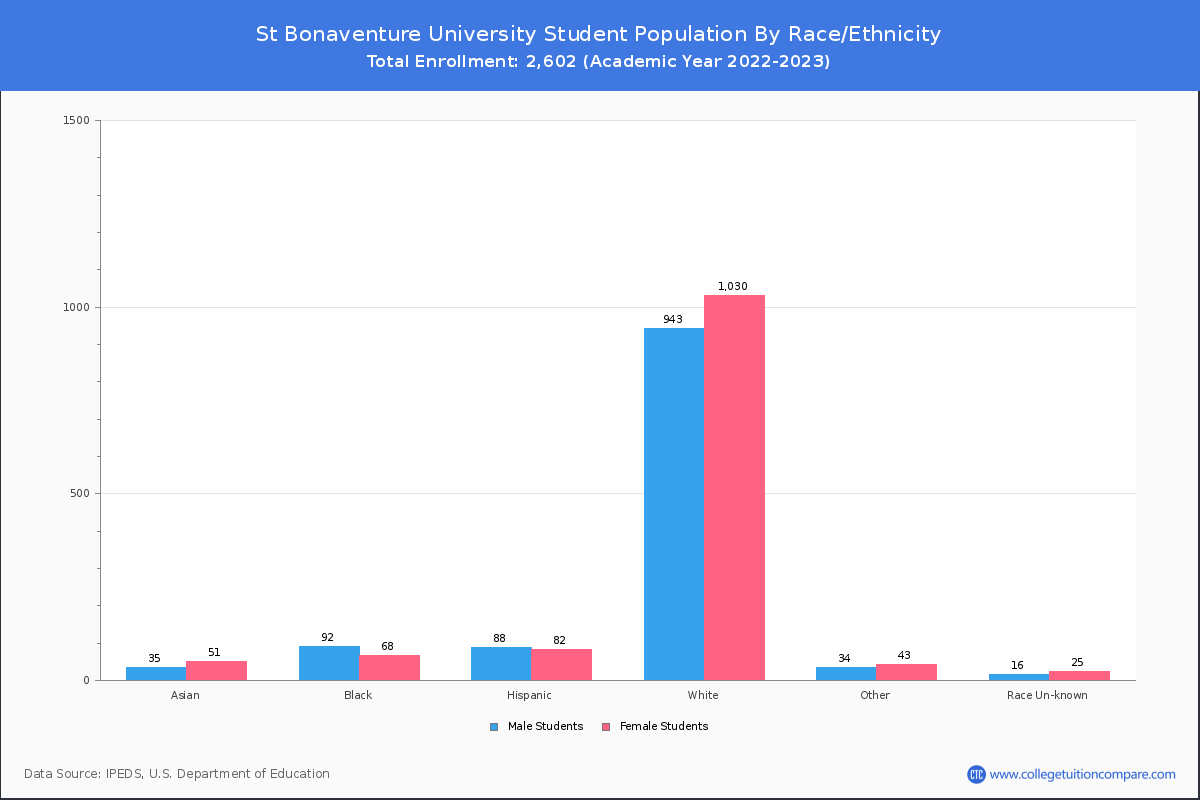
By race/ethnicity, 1,980 White, 144 Black, and 78 Asian students out of a total of 2,602 are attending at St Bonaventure University. Comprehensive enrollment statistic data by race/ethnicity is shown in the next chart (Academic year 2022-2023 data).
| Race | Total | Men | Women |
|---|---|---|---|
| American Indian or Native American | 9 | 4 | 5 |
| Asian | 78 | 33 | 45 |
| Black | 144 | 75 | 69 |
| Hispanic | 187 | 99 | 88 |
| Native Hawaiian or Other Pacific Islanders | 5 | 4 | 1 |
| White | 1,980 | 970 | 1,010 |
| Two or more races | 71 | 32 | 39 |
| Race Unknown | 40 | 18 | 22 |
| Race | Total | Men | Women |
|---|---|---|---|
| American Indian or Native American | 6 | 3 | 3 |
| Asian | 57 | 25 | 32 |
| Black | 90 | 54 | 36 |
| Hispanic | 120 | 74 | 46 |
| Native Hawaiian or Other Pacific Islanders | 5 | 4 | 1 |
| White | 1,429 | 774 | 655 |
| Two or more races | 55 | 24 | 31 |
| Race Unknown | 23 | 13 | 10 |
| Race | Total | Men | Women |
|---|---|---|---|
| American Indian or Native American | 0 | 0 | 0 |
| Asian | 0 | 0 | 0 |
| Black | 2 | 2 | 0 |
| Hispanic | 5 | 4 | 1 |
| Native Hawaiian or Other Pacific Islanders | 0 | 0 | 0 |
| White | 39 | 22 | 17 |
| Two or more races | 2 | 1 | 1 |
| Race Unknown | 1 | 1 | 0 |
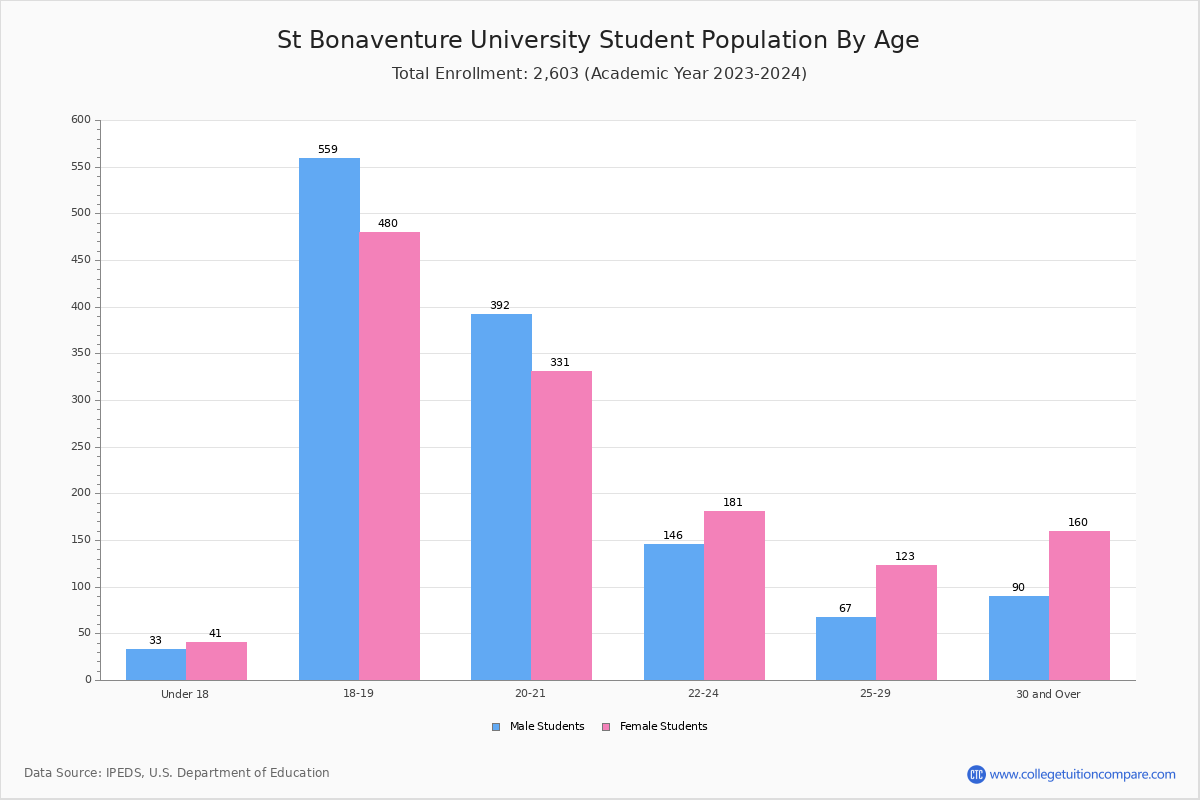
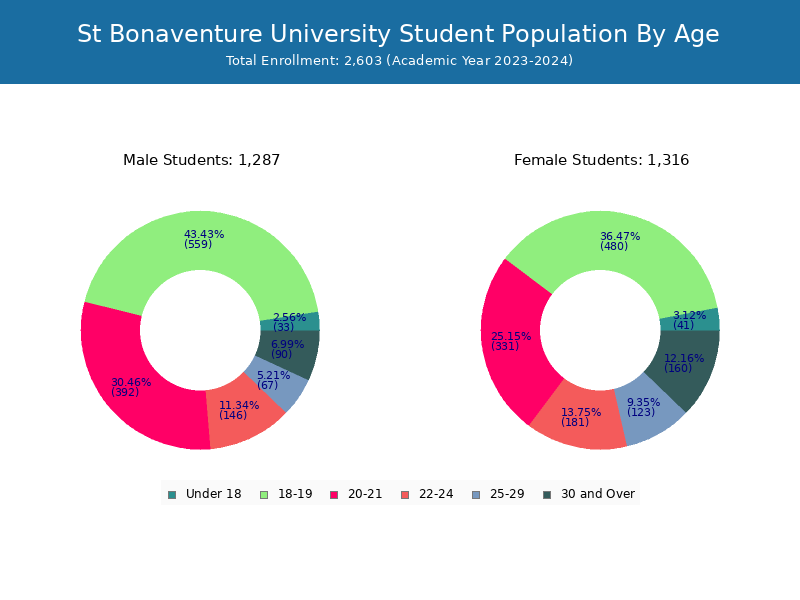
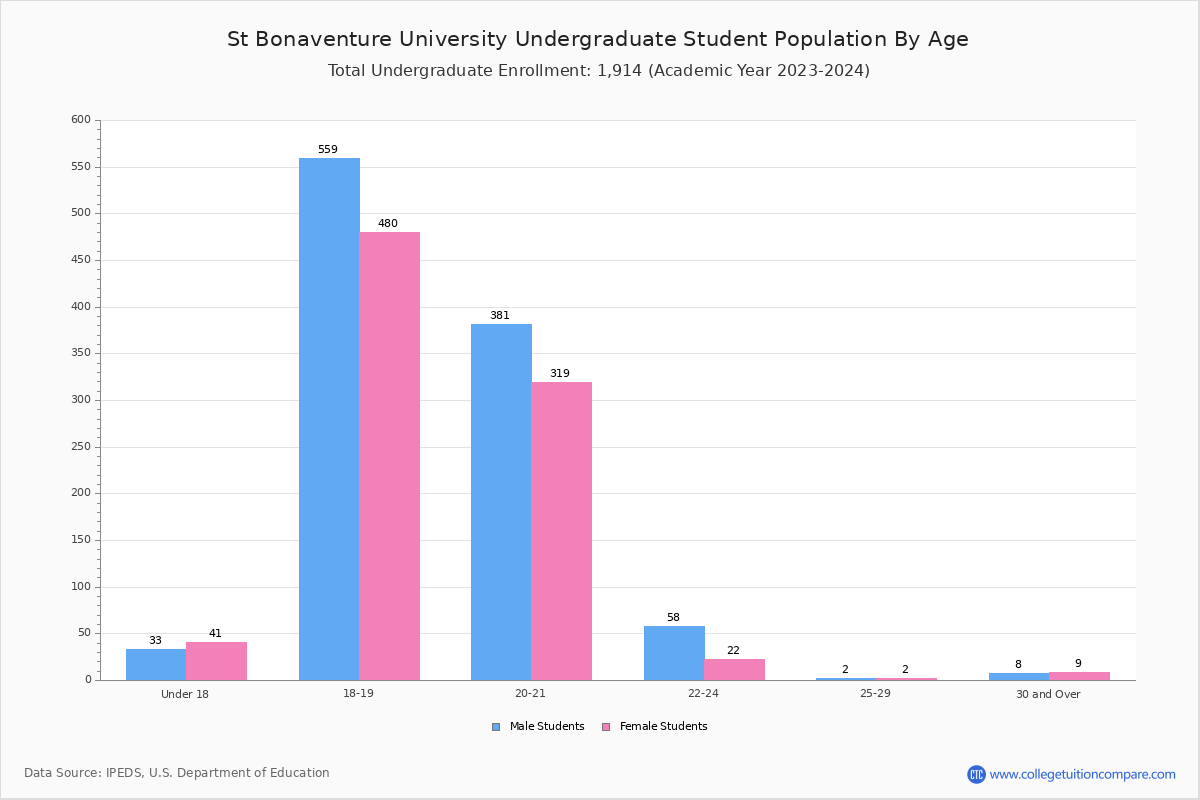
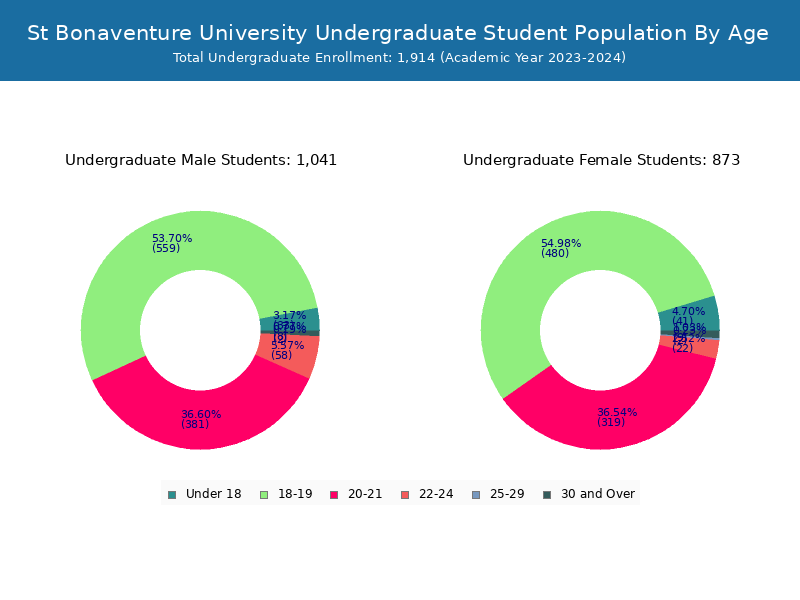
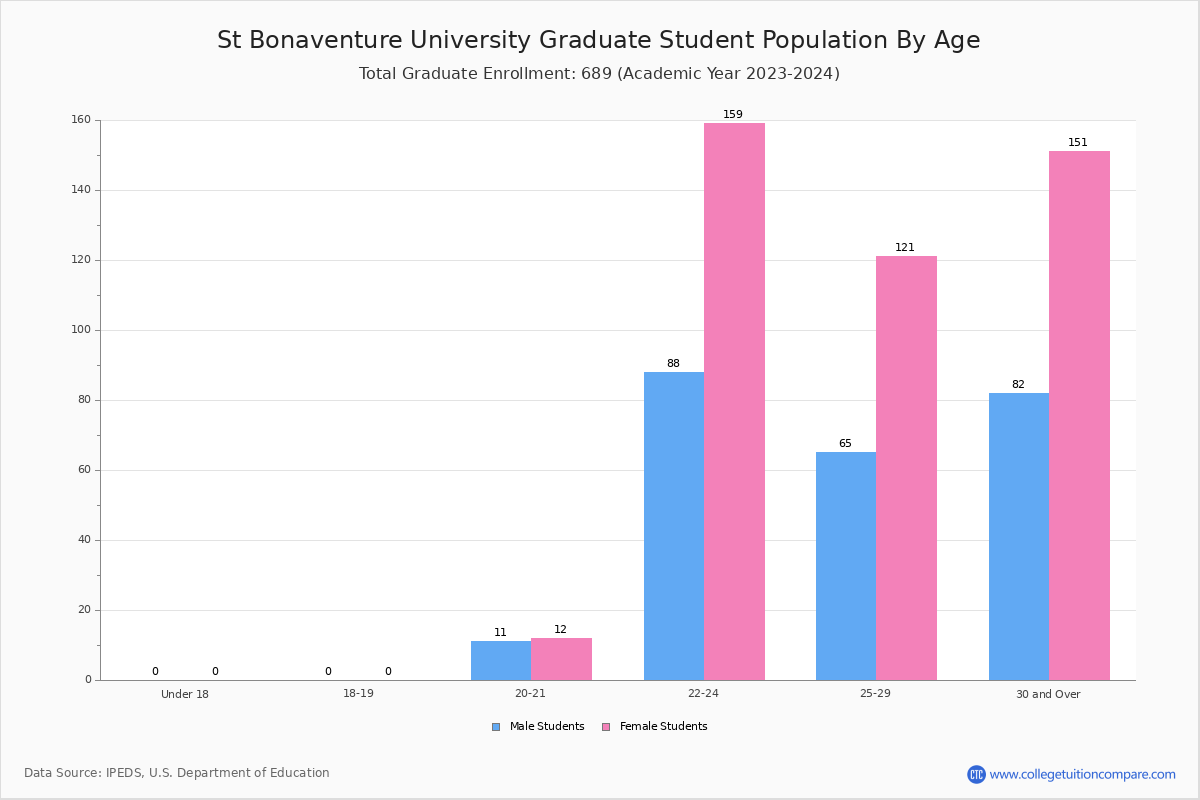
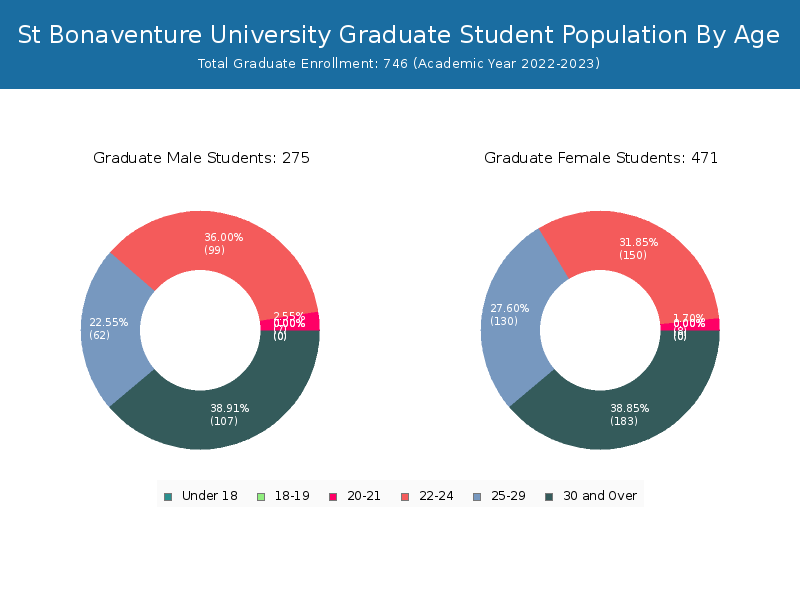
Student Age Distribution
There are 2,100 students under 25 years old, and 502 students over 25 years old out of 2,602 total students.
St. Bona has 1,836 undergraduate students aged under 25 and 20 students aged 25 and over.
It has 264 graduate students aged under 25 and 482 students aged 25 and over.
| Age | Total | Men | Women |
|---|---|---|---|
| Under 18 | 125 | 68 | 57 |
| 18-19 | 942 | 429 | 513 |
| 20-21 | 714 | 325 | 389 |
| 22-24 | 319 | 162 | 157 |
| 25-29 | 196 | 131 | 65 |
| 30-34 | 98 | 62 | 36 |
| 35-39 | 63 | 41 | 22 |
| 40-49 | 109 | 72 | 37 |
| 50-64 | 36 | 18 | 18 |
| Age | Total | Men | Women |
|---|---|---|---|
| Under 18 | 125 | 68 | 57 |
| 18-19 | 942 | 429 | 513 |
| 20-21 | 699 | 317 | 382 |
| 22-24 | 70 | 12 | 58 |
| 25-29 | 4 | 1 | 3 |
| 30-34 | 1 | 1 | 0 |
| 35-39 | 8 | 5 | 3 |
| 40-49 | 5 | 2 | 3 |
| 50-64 | 2 | 2 | 0 |
| Age | Total | Men | Women |
|---|
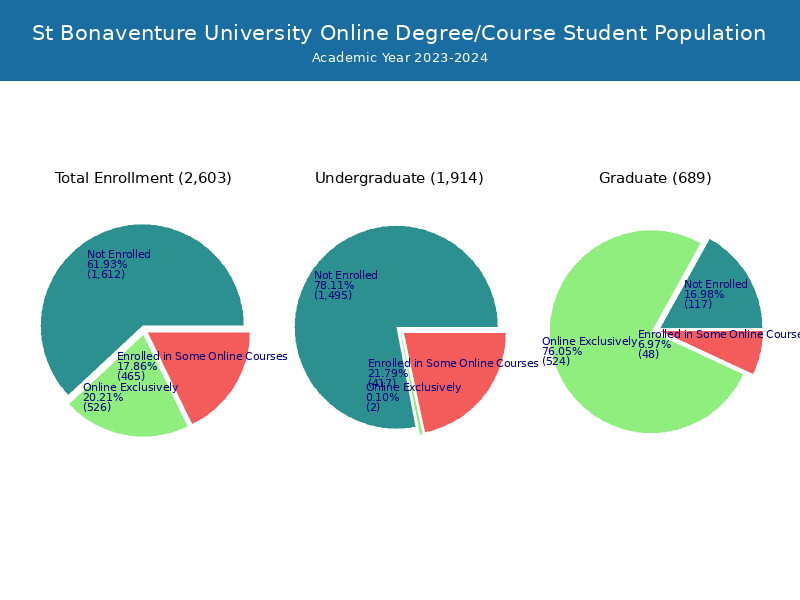
Online Student Enrollment
Distance learning, also called online education, is very attractive to students, especially who want to continue education and work in field. At St Bonaventure University, 548 students are enrolled exclusively in online courses and 424 students are enrolled in some online courses.
323 students lived in New York or jurisdiction in which the school is located are enrolled exclusively in online courses and 225 students live in other State or outside of the United States.
| All Students | Enrolled Exclusively Online Courses | Enrolled in Some Online Courses | |
|---|---|---|---|
| All Students | 2,602 | 548 | 424 |
| Undergraduate | 1,856 | 3 | 352 |
| Graduate | 746 | 545 | 72 |
| New York Residents | Other States in U.S. | Outside of U.S. | |
|---|---|---|---|
| All Students | 323 | 222 | 3 |
| Undergraduate | 1 | 2 | 0 |
| Graduate | 322 | 220 | 3 |
Transfer-in Students (Undergraduate)
Among 1,856 enrolled in undergraduate programs, 57 students have transferred-in from other institutions. The percentage of transfer-in students is 3.07%.54 students have transferred in as full-time status and 3 students transferred in as part-time status.
| Number of Students | |
|---|---|
| Regular Full-time | 1,717 |
| Transfer-in Full-time | 54 |
| Regular Part-time | 82 |
| Transfer-in Part-time | 3 |