Student Population by Gender
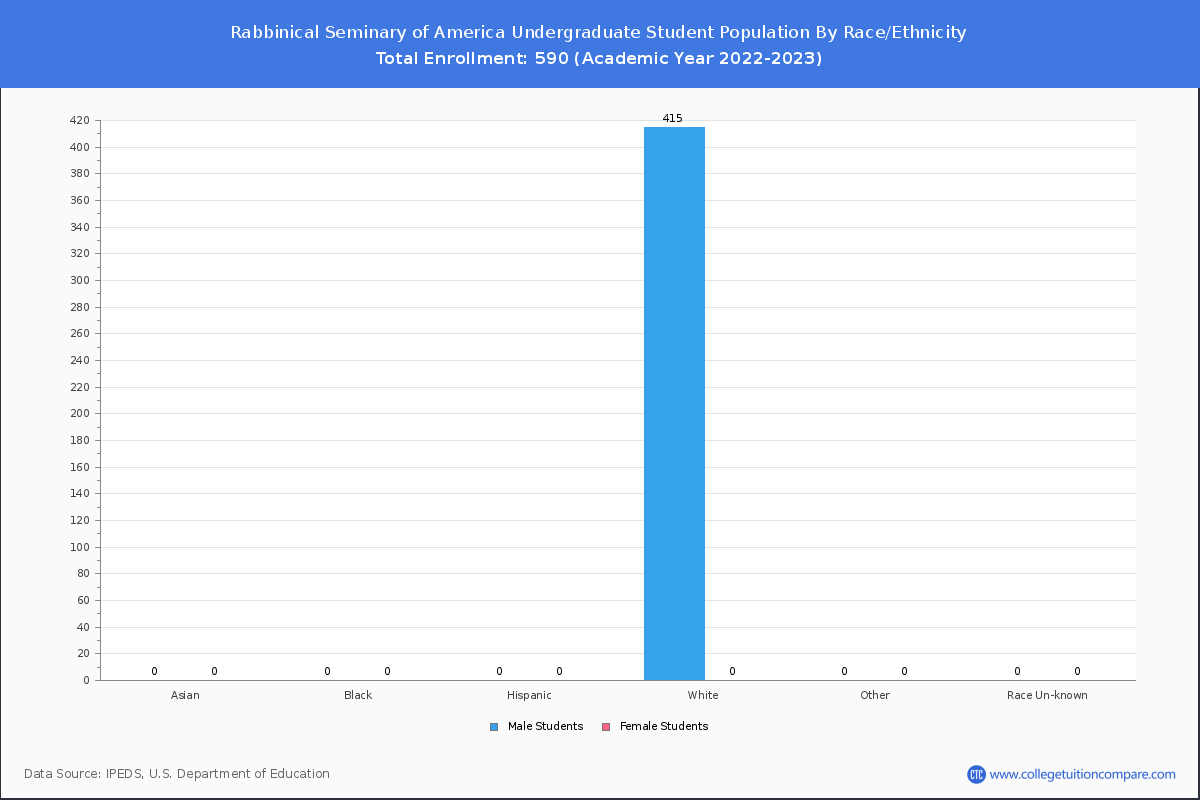
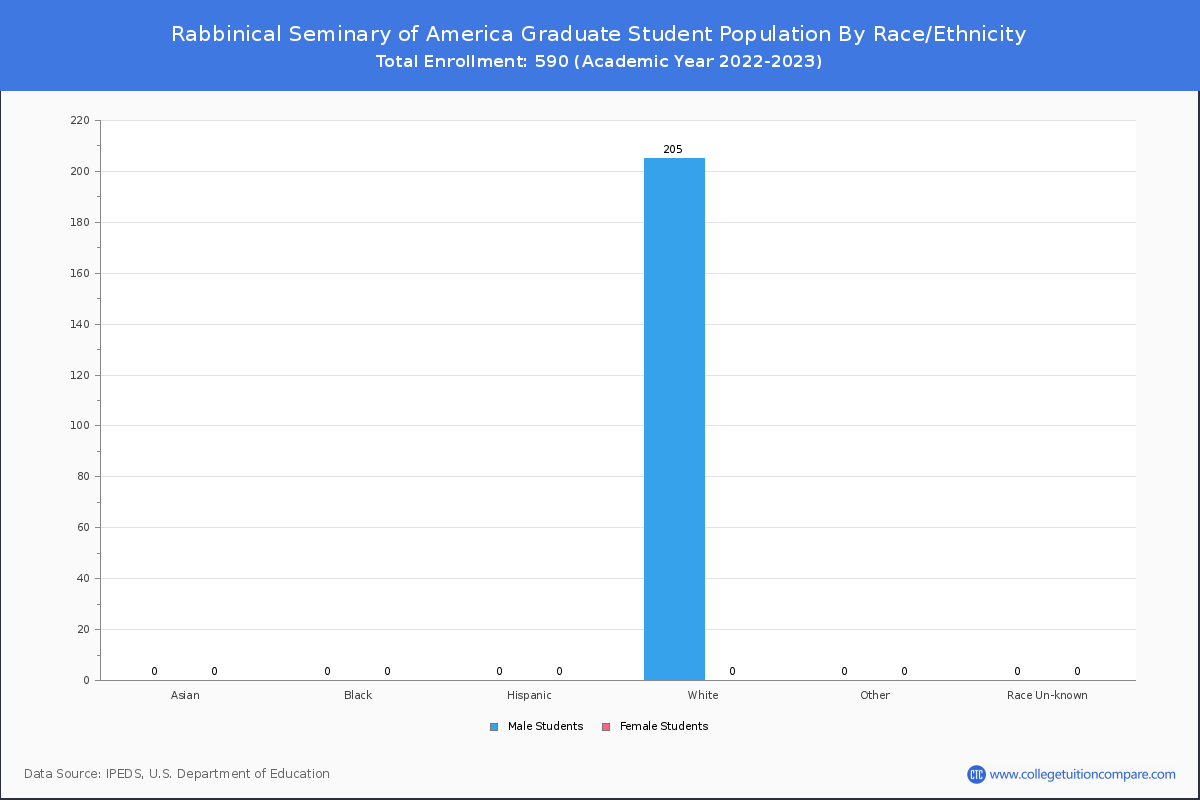
Rabbinical Seminary of America has a total of 590 enrolled students for the academic year 2022-2023. 346 students have enrolled in undergraduate programs and 244 students joined graduate programs.
By gender, all enrolled students are male at the school. The gender distribution is based on the 2022-2023 data.
| Total | Undergraduate | Graduate | |
|---|---|---|---|
| Total | 590 | 346 | 244 |
| Men | 590 | 346 | 244 |
| Women | 0 | 0 | 0 |


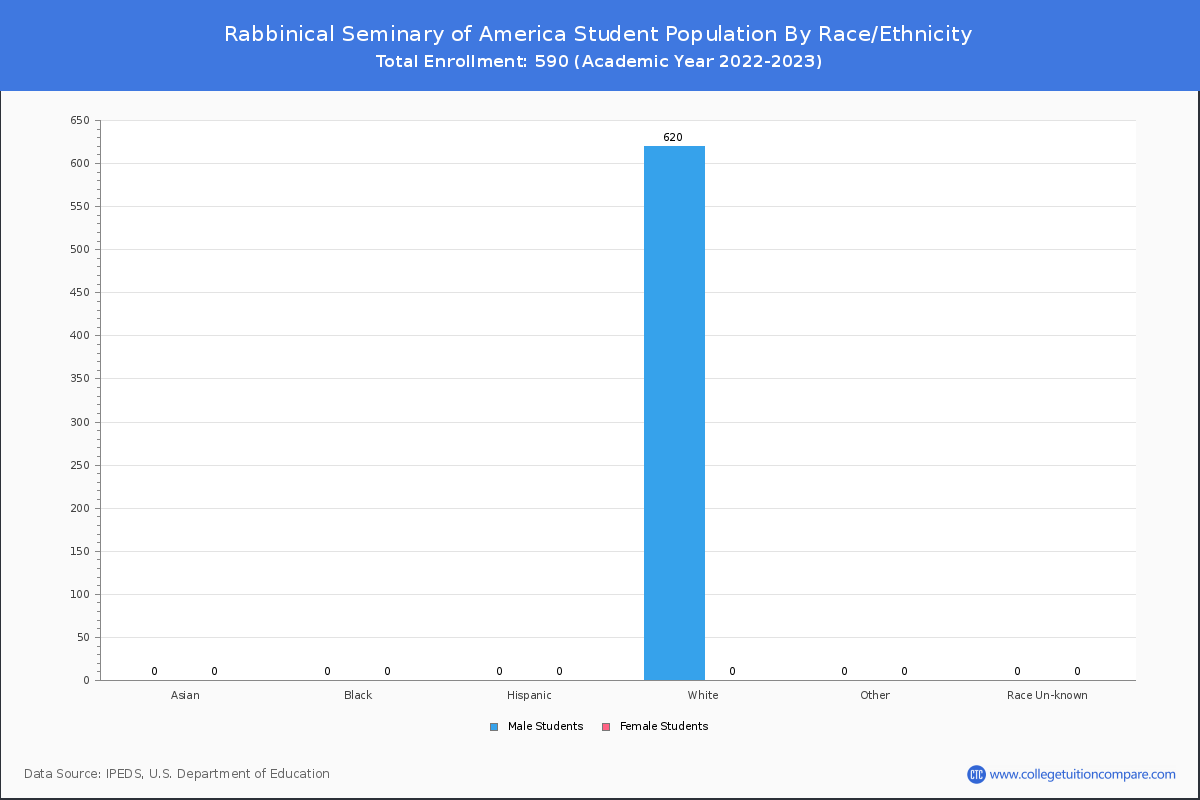
Student Distribution by Race/Ethnicity
By race/ethnicity, 590 White, and 0 Black students out of a total of 590 are attending at Rabbinical Seminary of America. Comprehensive enrollment statistic data by race/ethnicity is shown in the next chart (Academic year 2022-2023 data).
| Race | Total | Men | Women |
|---|---|---|---|
| American Indian or Native American | 0 | 0 | 0 |
| Asian | 0 | 0 | 0 |
| Black | 0 | 0 | 0 |
| Hispanic | 0 | 0 | 0 |
| Native Hawaiian or Other Pacific Islanders | 0 | 0 | 0 |
| White | 590 | 590 | 0 |
| Two or more races | 0 | 0 | 0 |
| Race Unknown | 0 | 0 | 0 |
| Race | Total | Men | Women |
|---|---|---|---|
| American Indian or Native American | 0 | 0 | 0 |
| Asian | 0 | 0 | 0 |
| Black | 0 | 0 | 0 |
| Hispanic | 0 | 0 | 0 |
| Native Hawaiian or Other Pacific Islanders | 0 | 0 | 0 |
| White | 346 | 346 | 0 |
| Two or more races | 0 | 0 | 0 |
| Race Unknown | 0 | 0 | 0 |
| Race | Total | Men | Women |
|---|---|---|---|
| American Indian or Native American | 0 | 0 | 0 |
| Asian | 0 | 0 | 0 |
| Black | 0 | 0 | 0 |
| Hispanic | 0 | 0 | 0 |
| Native Hawaiian or Other Pacific Islanders | 0 | 0 | 0 |
| White | 0 | 0 | 0 |
| Two or more races | 0 | 0 | 0 |
| Race Unknown | 0 | 0 | 0 |