Student Population by Gender
New York Medical College has a total of 1,454 enrolled students for the academic year 2022-2023. All 1,454 students are enrolled into graduate programs.
By gender, 608 male and 846 female students (the male-female ratio is 42:58) are attending the school. The gender distribution is based on the 2022-2023 data.
| Graduate | |
|---|---|
| Total | 1,454 |
| Men | 608 |
| Women | 846 |
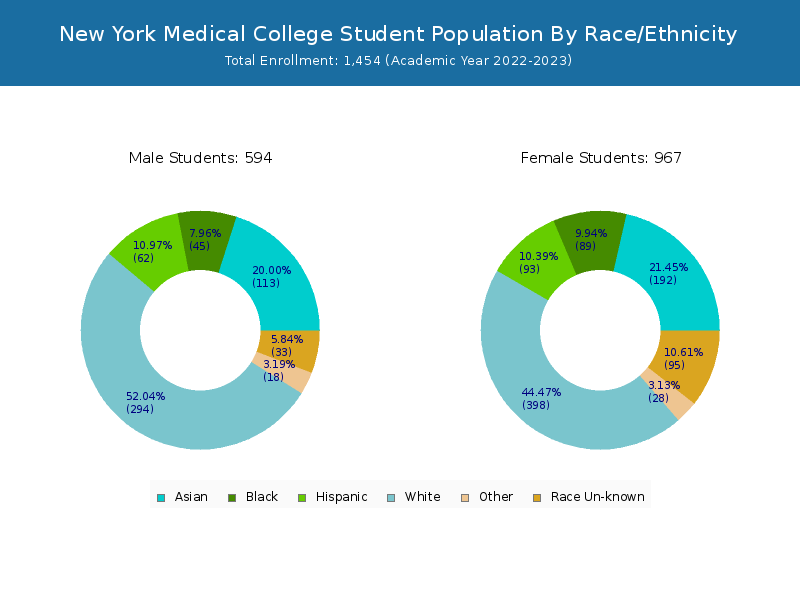
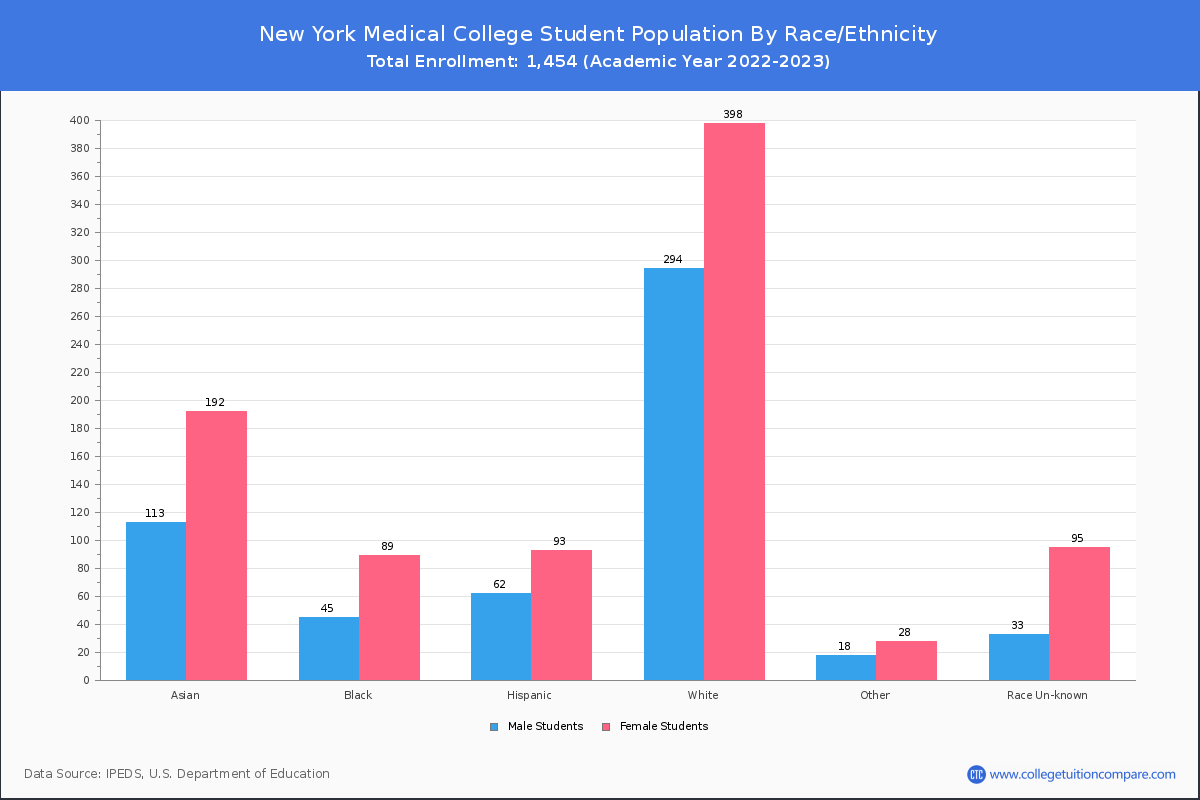
Student Distribution by Race/Ethnicity
By race/ethnicity, 652 White, 120 Black, and 285 Asian students out of a total of 1,454 are attending at New York Medical College. Comprehensive enrollment statistic data by race/ethnicity is shown in the next chart (Academic year 2022-2023 data).
| Race | Total | Men | Women |
|---|---|---|---|
| American Indian or Native American | 0 | 0 | 0 |
| Asian | 285 | 122 | 163 |
| Black | 120 | 44 | 76 |
| Hispanic | 180 | 83 | 97 |
| Native Hawaiian or Other Pacific Islanders | 0 | 0 | 0 |
| White | 652 | 279 | 373 |
| Two or more races | 46 | 20 | 26 |
| Race Unknown | 103 | 37 | 66 |
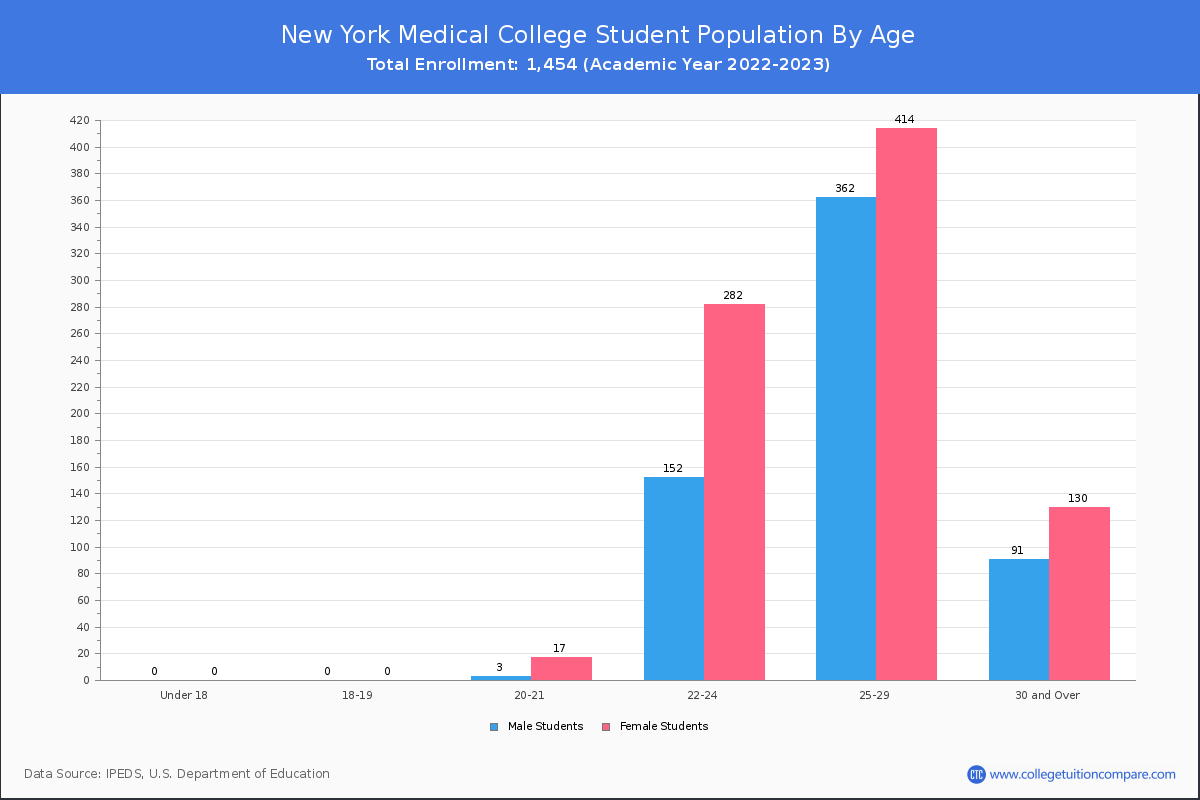
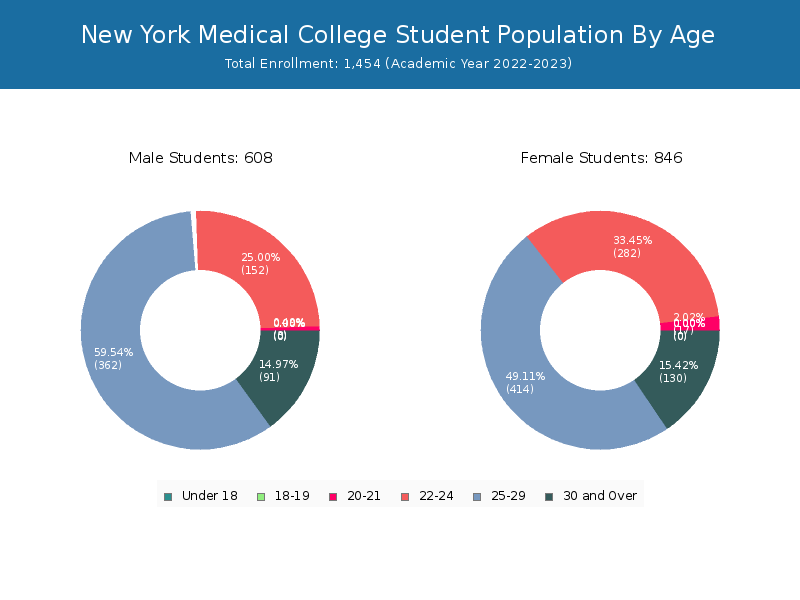
Student Age Distribution
There are 454 students under 25 years old, and 997 students over 25 years old out of 1,454 total students.
| Age | Total | Men | Women |
|---|
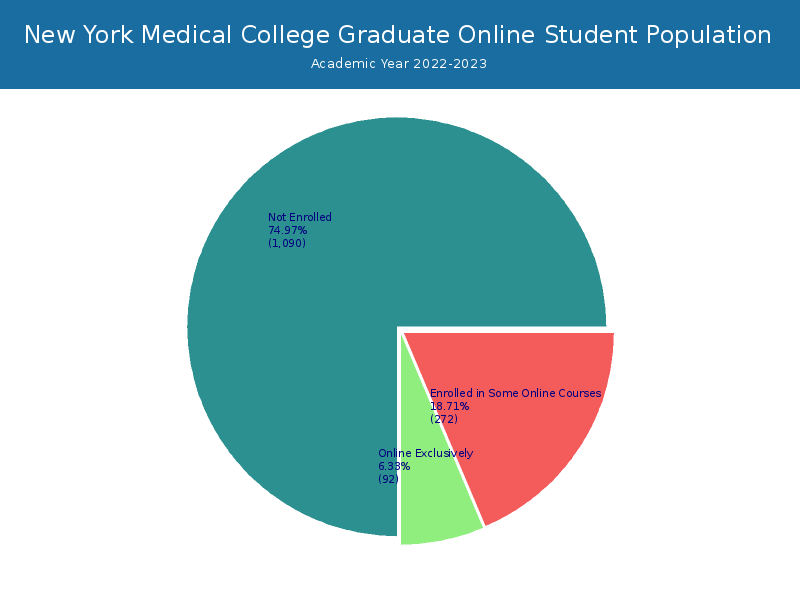
Online Student Enrollment
Distance learning, also called online education, is very attractive to students, especially who want to continue education and work in field. At New York Medical College, 92 students are enrolled exclusively in online courses and 272 students are enrolled in some online courses.
31 students lived in New York or jurisdiction in which the school is located are enrolled exclusively in online courses and 61 students live in other State or outside of the United States.
| All Students | Enrolled Exclusively Online Courses | Enrolled in Some Online Courses | |
|---|---|---|---|
| All Students | 1,454 | 92 | 272 |
| Undergraduate | Undergraduate Program Not Offered | ||
| Graduate | 1,454 | 92 | 272 |
| New York Residents | Other States in U.S. | Outside of U.S. | |
|---|---|---|---|
| All Students | 31 | 58 | 3 |
| Undergraduate | - | - | - |
| Graduate | 31 | 58 | 3 |