Student Population by Gender
The New School has a total of 10,108 enrolled students for the academic year 2022-2023. 7,171 students have enrolled in undergraduate programs and 2,937 students joined graduate programs.
By gender, 2,580 male and 7,528 female students (the male-female ratio is 26:74) are attending the school. The gender distribution is based on the 2022-2023 data.
| Total | Undergraduate | Graduate | |
|---|---|---|---|
| Total | 10,108 | 7,171 | 2,937 |
| Men | 2,580 | 1,665 | 915 |
| Women | 7,528 | 5,506 | 2,022 |
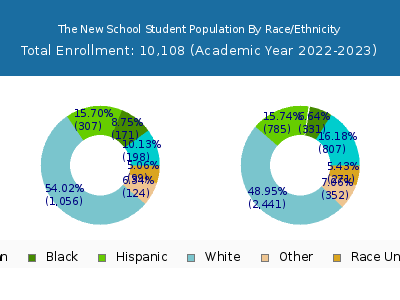
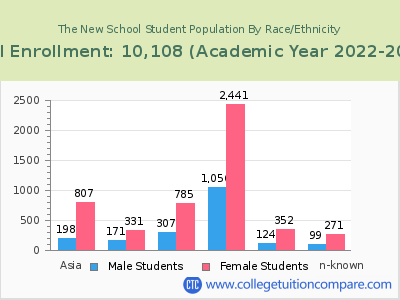
Student Distribution by Race/Ethnicity
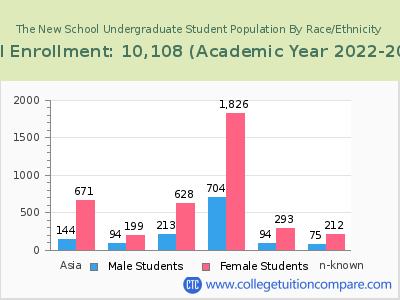
| Race | Total | Men | Women |
|---|---|---|---|
| American Indian or Native American | 9 | 3 | 6 |
| Asian | 982 | 189 | 793 |
| Black | 430 | 129 | 301 |
| Hispanic | 944 | 258 | 686 |
| Native Hawaiian or Other Pacific Islanders | 9 | 2 | 7 |
| White | 3,279 | 969 | 2,310 |
| Two or more races | 429 | 91 | 338 |
| Race Unknown | 257 | 70 | 187 |
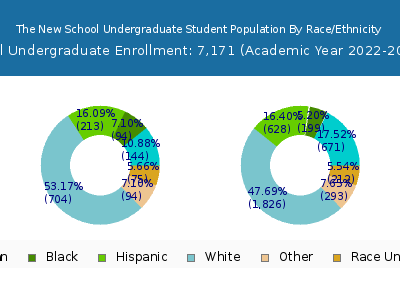
| Race | Total | Men | Women |
|---|---|---|---|
| American Indian or Native American | 7 | 2 | 5 |
| Asian | 801 | 139 | 662 |
| Black | 282 | 82 | 200 |
| Hispanic | 741 | 184 | 557 |
| Native Hawaiian or Other Pacific Islanders | 8 | 2 | 6 |
| White | 2,395 | 652 | 1,743 |
| Two or more races | 363 | 71 | 292 |
| Race Unknown | 213 | 56 | 157 |
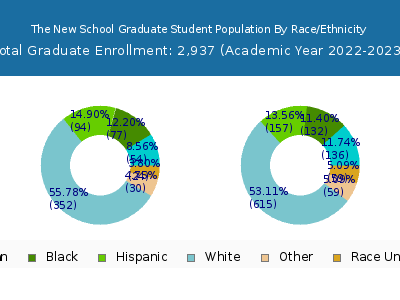
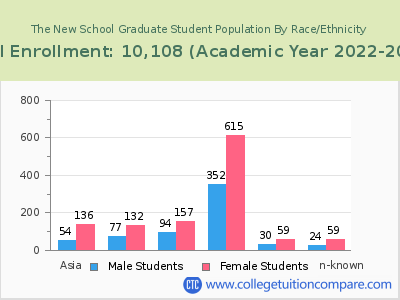
| Race | Total | Men | Women |
|---|---|---|---|
| American Indian or Native American | 0 | 0 | 0 |
| Asian | 34 | 5 | 29 |
| Black | 18 | 9 | 9 |
| Hispanic | 46 | 15 | 31 |
| Native Hawaiian or Other Pacific Islanders | 0 | 0 | 0 |
| White | 156 | 57 | 99 |
| Two or more races | 17 | 2 | 15 |
| Race Unknown | 3 | 1 | 2 |
Student Age Distribution
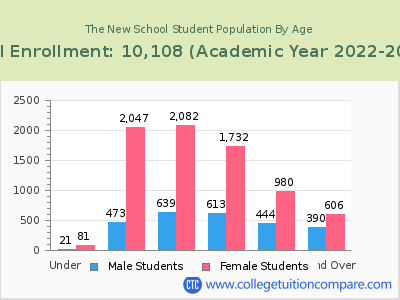
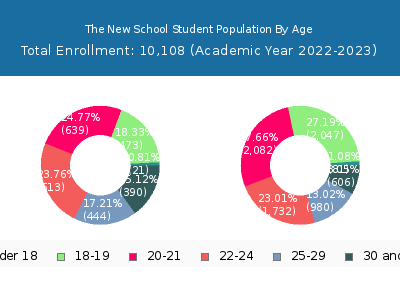
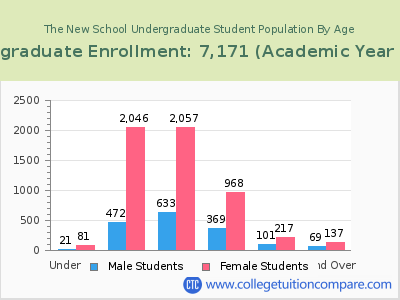
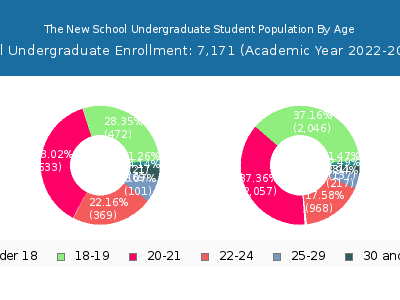
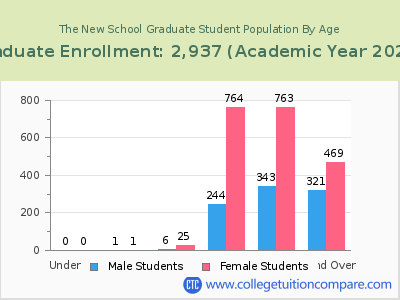
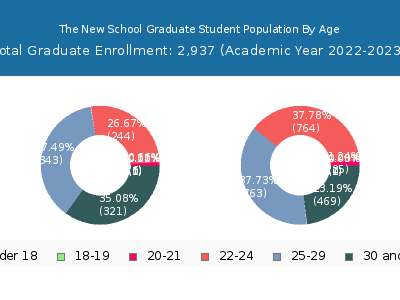
By age, The New School has 102 students under 18 years old and 6 students over 65 years old. There are 7,688 students under 25 years old, and 2,420 students over 25 years old out of 10,108 total students.
The New School has 6,647 undergraduate students aged under 25 and 524 students aged 25 and over.
It has 1,041 graduate students aged under 25 and 1,896 students aged 25 and over.
| Age | Total | Men | Women |
|---|---|---|---|
| Under 18 | 102 | 81 | 21 |
| 18-19 | 2,520 | 2,047 | 473 |
| 20-21 | 2,721 | 2,082 | 639 |
| 22-24 | 2,345 | 1,732 | 613 |
| 25-29 | 1,424 | 980 | 444 |
| 30-34 | 506 | 309 | 197 |
| 35-39 | 239 | 139 | 100 |
| 40-49 | 174 | 111 | 63 |
| 50-64 | 71 | 43 | 28 |
| Over 65 | 6 | 4 | 2 |
| Age | Total | Men | Women |
|---|---|---|---|
| Under 18 | 102 | 81 | 21 |
| 18-19 | 2,518 | 2,046 | 472 |
| 20-21 | 2,690 | 2,057 | 633 |
| 22-24 | 1,337 | 968 | 369 |
| 25-29 | 318 | 217 | 101 |
| 30-34 | 101 | 71 | 30 |
| 35-39 | 44 | 26 | 18 |
| 40-49 | 43 | 30 | 13 |
| 50-64 | 18 | 10 | 8 |
| Age | Total | Men | Women |
|---|
Online Student Enrollment
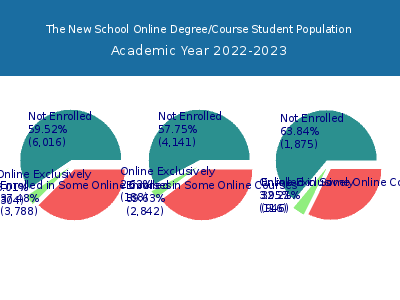
Distance learning, also called online education, is very attractive to students, especially who want to continue education and work in field. At The New School, 304 students are enrolled exclusively in online courses and 3,788 students are enrolled in some online courses.
106 students lived in New York or jurisdiction in which the school is located are enrolled exclusively in online courses and 198 students live in other State or outside of the United States.
| All Students | Enrolled Exclusively Online Courses | Enrolled in Some Online Courses | |
|---|---|---|---|
| All Students | 10,108 | 304 | 3,788 |
| Undergraduate | 7,171 | 188 | 2,842 |
| Graduate | 2,937 | 116 | 946 |
| New York Residents | Other States in U.S. | Outside of U.S. | |
|---|---|---|---|
| All Students | 106 | 161 | 37 |
| Undergraduate | 74 | 96 | 18 |
| Graduate | 32 | 65 | 19 |
Transfer-in Students (Undergraduate)
Among 7,171 enrolled in undergraduate programs, 398 students have transferred-in from other institutions. The percentage of transfer-in students is 5.55%.360 students have transferred in as full-time status and 38 students transferred in as part-time status.
| Number of Students | |
|---|---|
| Regular Full-time | 6,312 |
| Transfer-in Full-time | 360 |
| Regular Part-time | 461 |
| Transfer-in Part-time | 38 |
