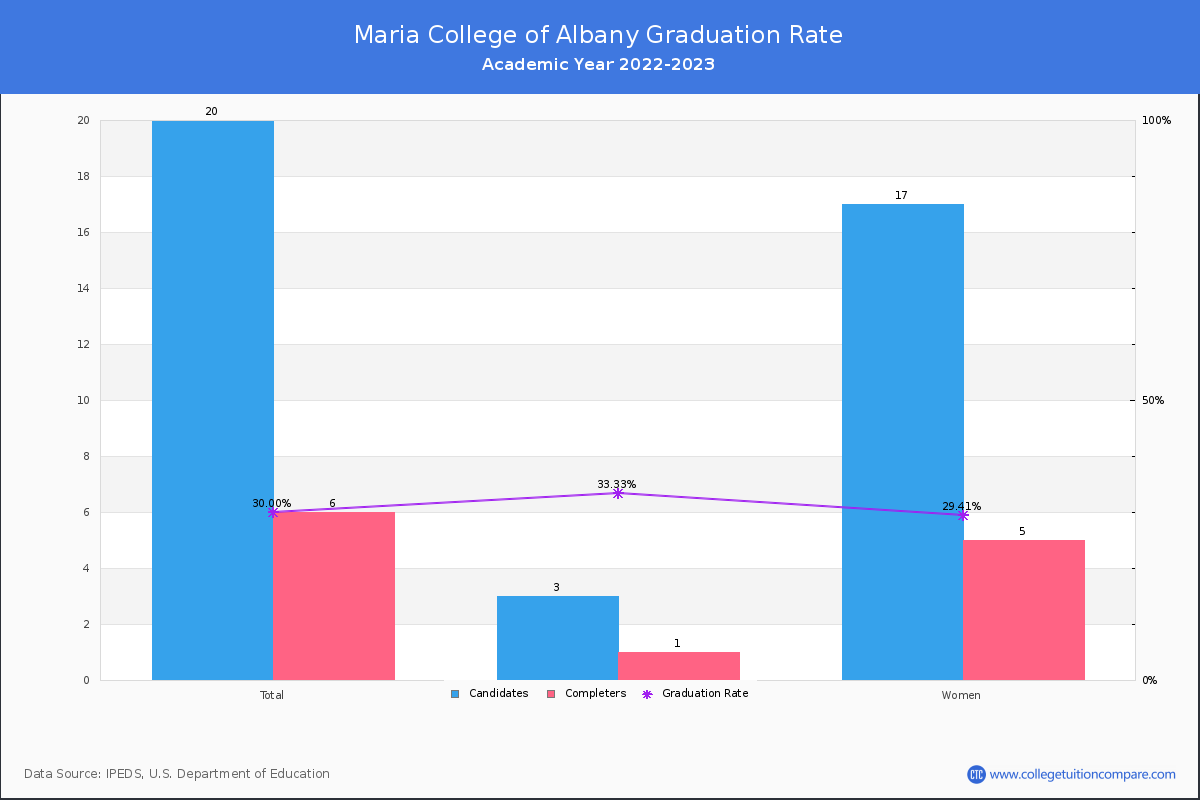
Graduation Rates in Reasonable Completion Time
For the academic year 2022-2023, 10 students out of 28 candidates have completed their courses within 150% normal time (i.e. in 6 years for 4-year BS degree) at Maria College of Albany.
By gender, 3 male and 7 female students graduated the school last year completing their jobs in the period. Its graduation rate is lower than the average rate when comparing similar colleges' rate of 61.00% (private (not-for-profit) health professions school).
| Candidates | Completers | Graduation Rates | |
|---|---|---|---|
| Total | 28 | 10 | 35.71% |
| Men | 6 | 3 | 50.00% |
| Women | 22 | 7 | 31.82% |
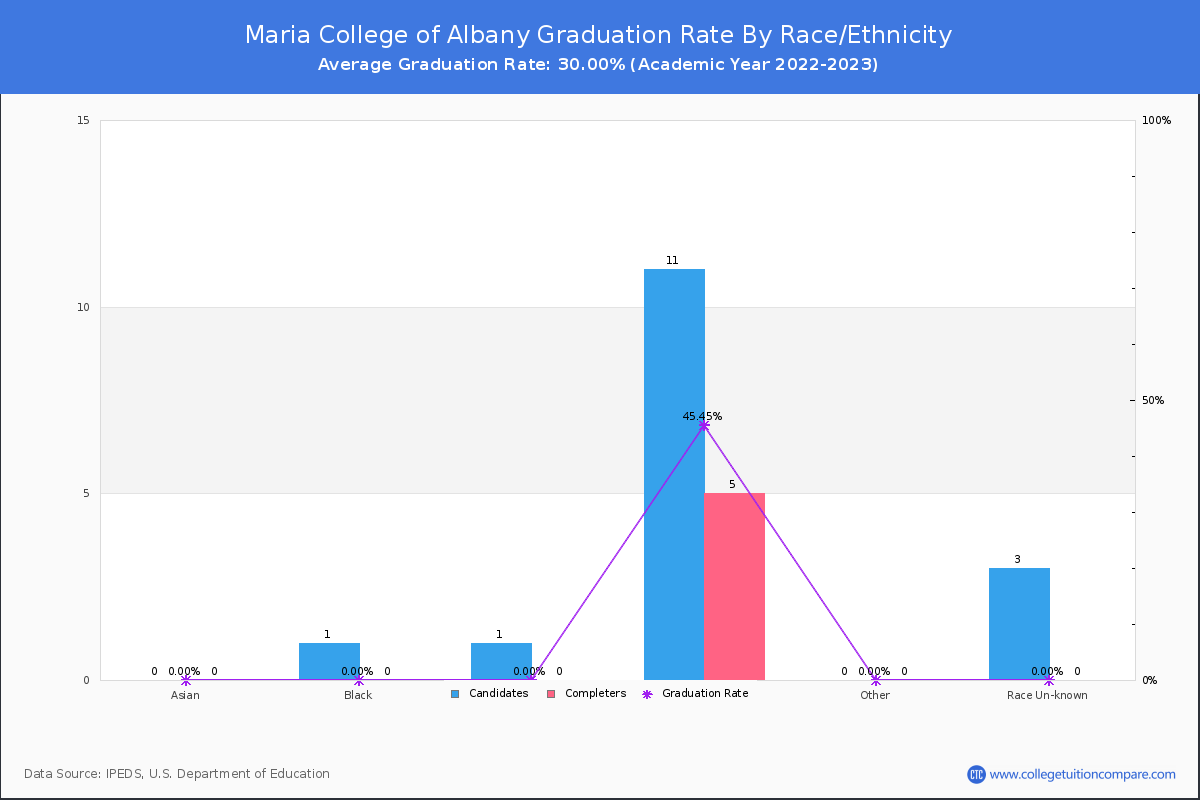
Graduation Rate By Race/Ethnicity
The following table shows graduation rate by race and at Maria College of Albany.
- Black (Non-Hispanic): 50.00%
- Hispanic: 0.00%
- White: 46.15%
- Unknown: 25.00%
| Total | Male | Female | |
|---|---|---|---|
| Black (Non-Hispanic) | 50.00%(1/2) | - | 100.00%(1/1) |
| Hispanic | 0.00%(-/1) | - | - |
| White | 46.15%(6/13) | - | 46.15%(6/13) |
| Unknown | 25.00%(2/8) | 50.00%(2/4) | - |
Transfer-out and Retention Rates
At Maria College of Albany, the transfer-out rate is 25.00%. Its transfer-out rate is relatively higher than the average rate when comparing similar colleges' rate of 21.44%.
Maria College of Albany's retention rate is 100% last year. Its retention rate is much higher than the average rate when comparing similar colleges' rate of 70.31%.
Non-Resident Alien Graduation Rate
A non-resident alien student is not a US citizen/green card holder and studies with a student visa, such as an F visa, in the United States. At Maria College of Albany, 1 of 4 non-resident alien students completed their studies and the graduation rate was 25.00%.