Student Population by Gender
Maria College of Albany has a total of 805 enrolled students for the academic year 2022-2023. 761 students have enrolled in undergraduate programs and 44 students joined graduate programs.
By gender, 91 male and 714 female students (the male-female ratio is 11:89) are attending the school. The gender distribution is based on the 2022-2023 data.
| Total | Undergraduate | Graduate | |
|---|---|---|---|
| Total | 805 | 761 | 44 |
| Men | 91 | 87 | 4 |
| Women | 714 | 674 | 40 |
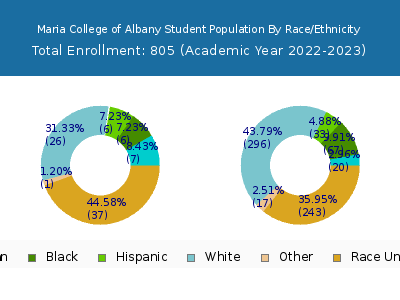
Student Distribution by Race/Ethnicity
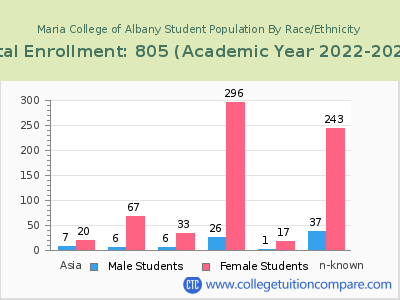
| Race | Total | Men | Women |
|---|---|---|---|
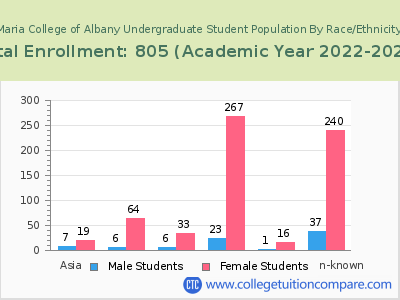
| American Indian or Native American | 3 | 0 | 3 |
| Asian | 40 | 9 | 31 |
| Black | 132 | 13 | 119 |
| Hispanic | 60 | 9 | 51 |
| Native Hawaiian or Other Pacific Islanders | 0 | 0 | 0 |
| White | 361 | 30 | 331 |
| Two or more races | 22 | 2 | 20 |
| Race Unknown | 153 | 16 | 137 |
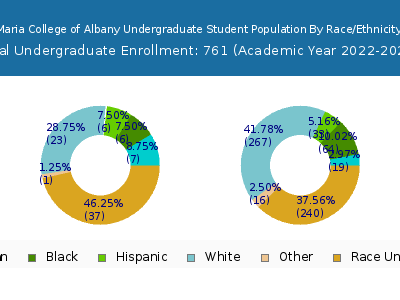
| Race | Total | Men | Women |
|---|---|---|---|
| American Indian or Native American | 3 | 0 | 3 |
| Asian | 39 | 9 | 30 |
| Black | 127 | 13 | 114 |
| Hispanic | 59 | 9 | 50 |
| Native Hawaiian or Other Pacific Islanders | 0 | 0 | 0 |
| White | 330 | 28 | 302 |
| Two or more races | 21 | 2 | 19 |
| Race Unknown | 149 | 15 | 134 |
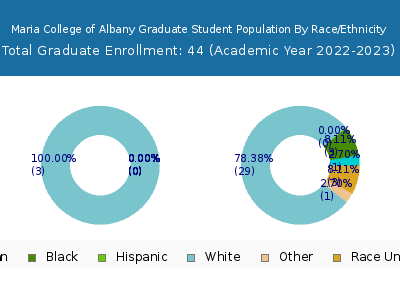
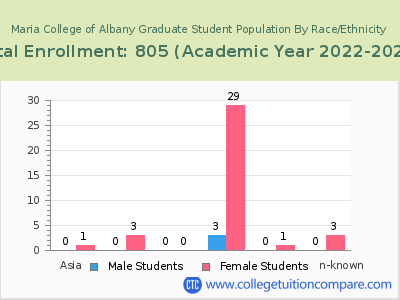
| Race | Total | Men | Women |
|---|---|---|---|
| American Indian or Native American | 1 | 0 | 1 |
| Asian | 12 | 3 | 9 |
| Black | 54 | 4 | 50 |
| Hispanic | 22 | 1 | 21 |
| Native Hawaiian or Other Pacific Islanders | 0 | 0 | 0 |
| White | 131 | 13 | 118 |
| Two or more races | 12 | 1 | 11 |
| Race Unknown | 13 | 1 | 12 |
Student Age Distribution
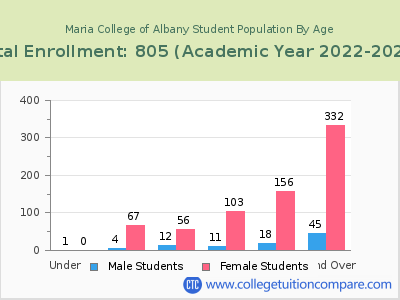
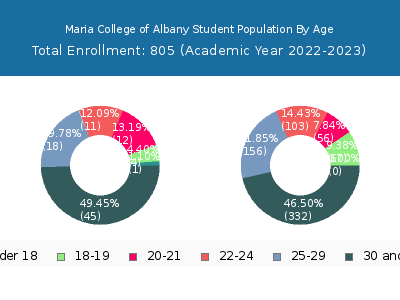
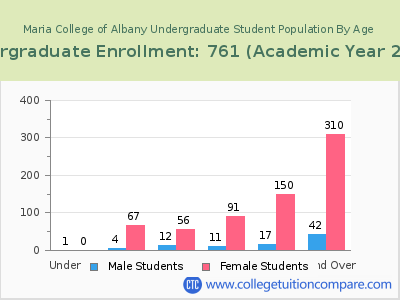
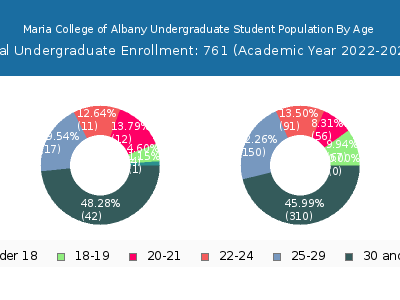
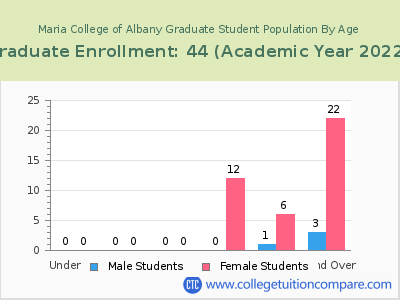
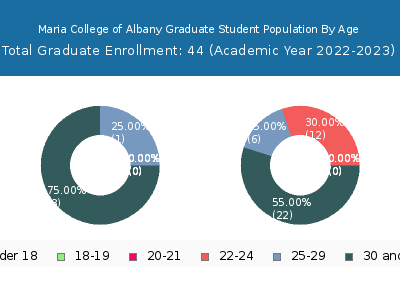
By age, Maria College of Albany has 1 students under 18 years old and 1 students over 65 years old. There are 254 students under 25 years old, and 551 students over 25 years old out of 805 total students.
In undergraduate programs, 1 students are younger than 18 and 1 students are older than 65. Maria College of Albany has 242 undergraduate students aged under 25 and 519 students aged 25 and over.
It has 12 graduate students aged under 25 and 32 students aged 25 and over.
| Age | Total | Men | Women |
|---|---|---|---|
| Under 18 | 1 | 0 | 1 |
| 18-19 | 71 | 67 | 4 |
| 20-21 | 68 | 56 | 12 |
| 22-24 | 114 | 103 | 11 |
| 25-29 | 174 | 156 | 18 |
| 30-34 | 151 | 134 | 17 |
| 35-39 | 87 | 81 | 6 |
| 40-49 | 96 | 80 | 16 |
| 50-64 | 42 | 36 | 6 |
| Over 65 | 1 | 1 | 0 |
| Age | Total | Men | Women |
|---|---|---|---|
| Under 18 | 1 | 0 | 1 |
| 18-19 | 71 | 67 | 4 |
| 20-21 | 68 | 56 | 12 |
| 22-24 | 102 | 91 | 11 |
| 25-29 | 167 | 150 | 17 |
| 30-34 | 140 | 123 | 17 |
| 35-39 | 83 | 77 | 6 |
| 40-49 | 89 | 76 | 13 |
| 50-64 | 39 | 33 | 6 |
| Over 65 | 1 | 1 | 0 |
| Age | Total | Men | Women |
|---|
Online Student Enrollment
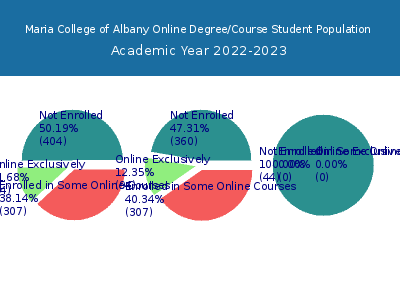
Distance learning, also called online education, is very attractive to students, especially who want to continue education and work in field. At Maria College of Albany, 94 students are enrolled exclusively in online courses and 307 students are enrolled in some online courses.
91 students lived in New York or jurisdiction in which the school is located are enrolled exclusively in online courses and 3 students live in other State or outside of the United States.
| All Students | Enrolled Exclusively Online Courses | Enrolled in Some Online Courses | |
|---|---|---|---|
| All Students | 805 | 94 | 307 |
| Undergraduate | 761 | 94 | 307 |
| Graduate | 44 | 0 | 0 |
| New York Residents | Other States in U.S. | Outside of U.S. | |
|---|---|---|---|
| All Students | 91 | 3 | 0 |
| Undergraduate | 91 | 3 | 0 |
| Graduate | 0 | - | 0 |
Transfer-in Students (Undergraduate)
Among 761 enrolled in undergraduate programs, 255 students have transferred-in from other institutions. The percentage of transfer-in students is 33.51%.54 students have transferred in as full-time status and 201 students transferred in as part-time status.
| Number of Students | |
|---|---|
| Regular Full-time | 123 |
| Transfer-in Full-time | 54 |
| Regular Part-time | 383 |
| Transfer-in Part-time | 201 |
