Student Population by Gender
Manhattanville College has a total of 2,240 enrolled students for the academic year 2022-2023. 1,290 students have enrolled in undergraduate programs and 950 students joined graduate programs.
By gender, 822 male and 1,418 female students (the male-female ratio is 37:63) are attending the school. The gender distribution is based on the 2022-2023 data.
| Total | Undergraduate | Graduate | |
|---|---|---|---|
| Total | 2,240 | 1,290 | 950 |
| Men | 822 | 520 | 302 |
| Women | 1,418 | 770 | 648 |
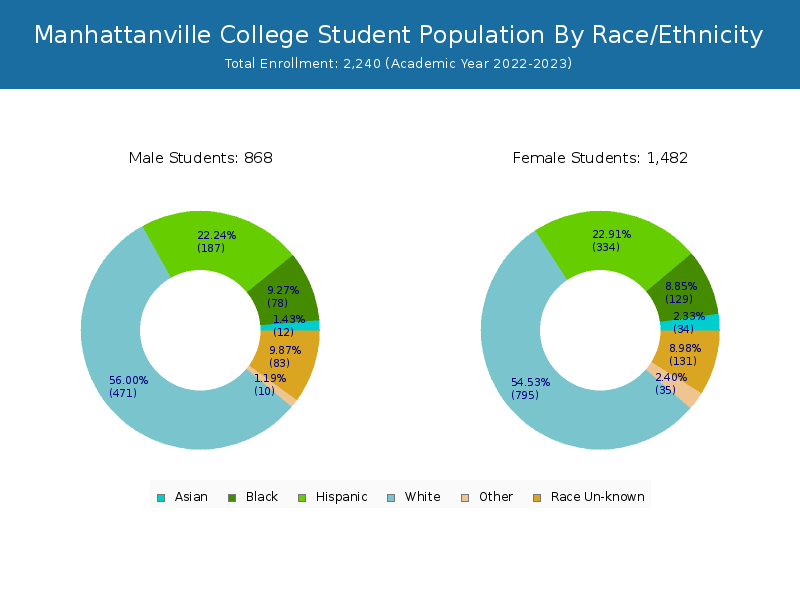
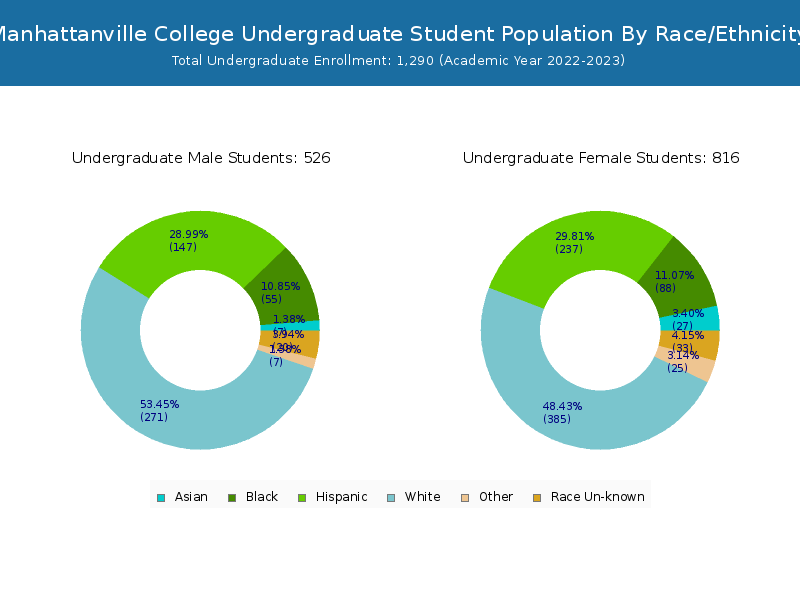
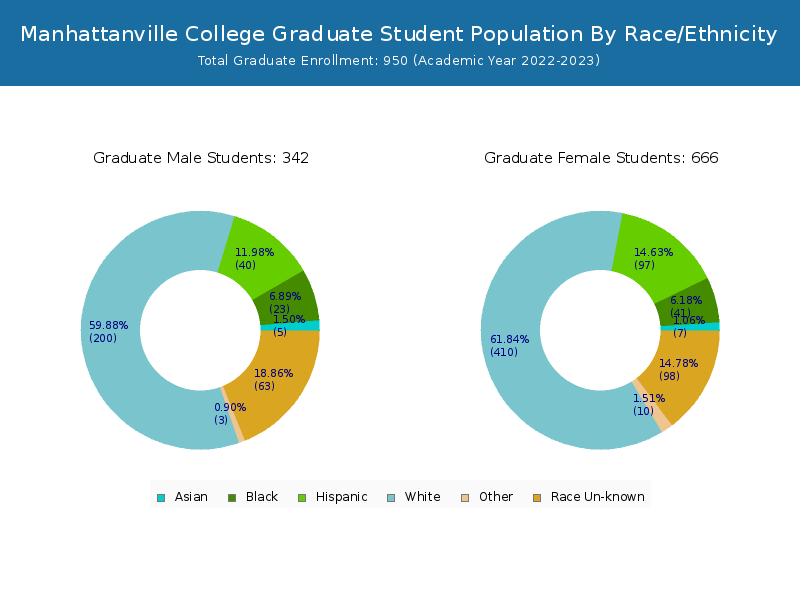
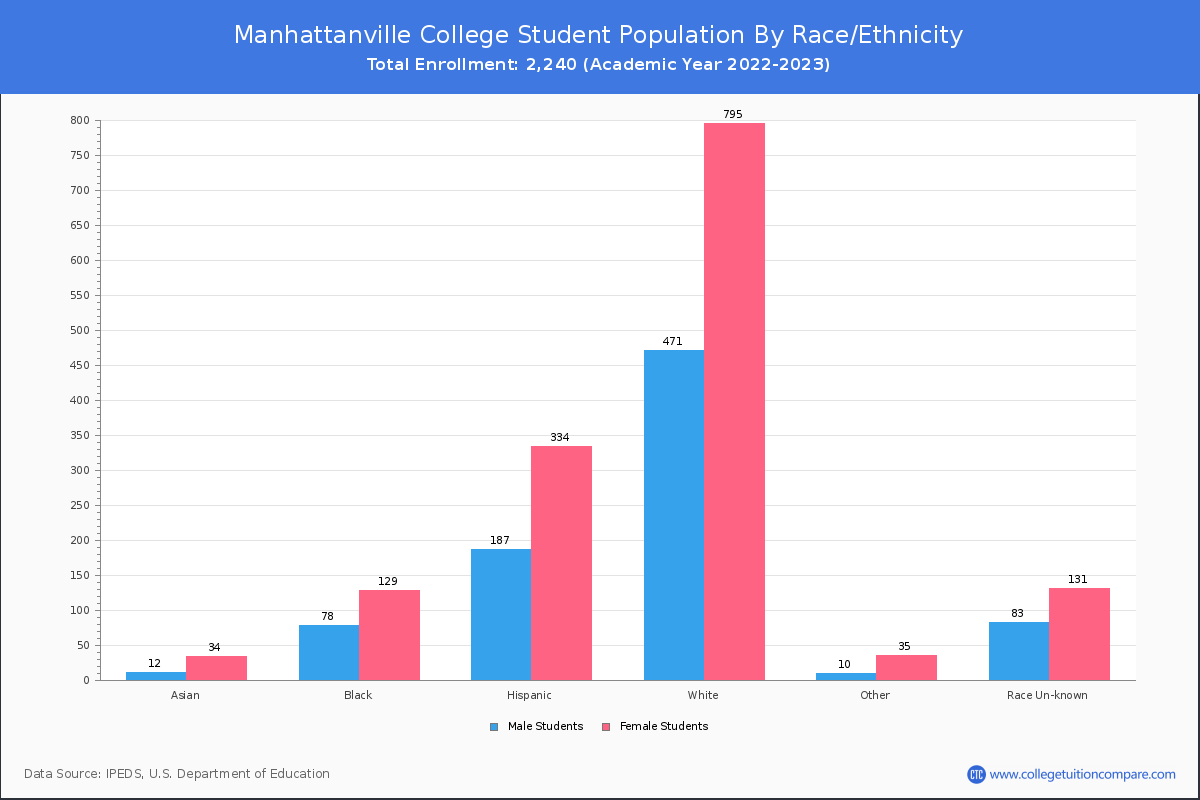
Student Distribution by Race/Ethnicity
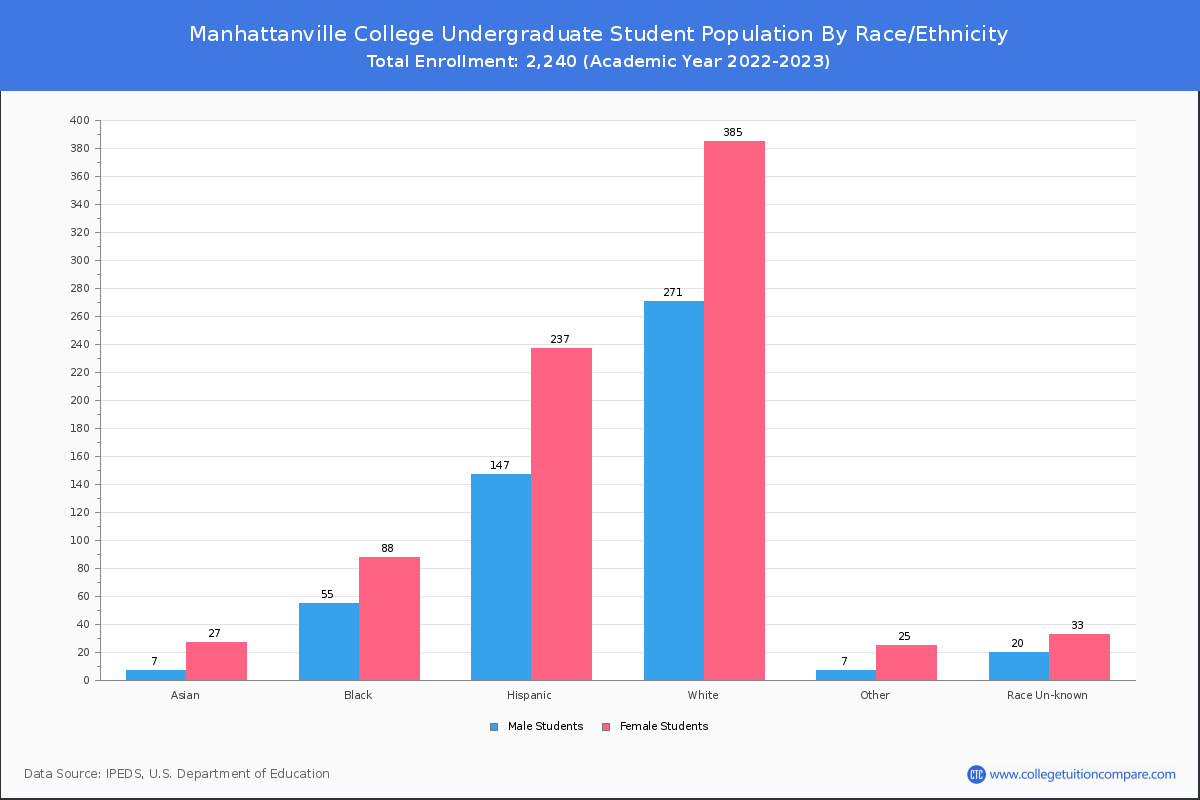
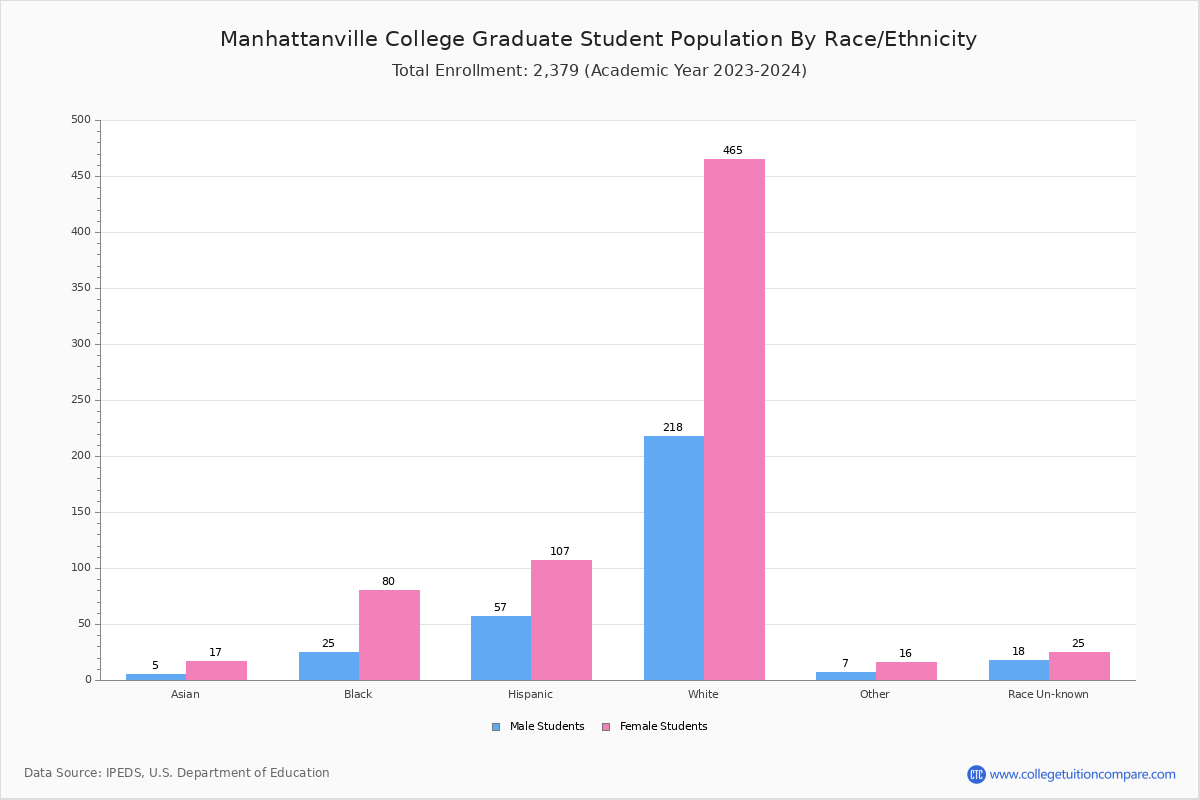
By race/ethnicity, 1,249 White, 196 Black, and 48 Asian students out of a total of 2,240 are attending at Manhattanville College. Comprehensive enrollment statistic data by race/ethnicity is shown in the next chart (Academic year 2022-2023 data).
| Race | Total | Men | Women |
|---|---|---|---|
| American Indian or Native American | 1 | 0 | 1 |
| Asian | 48 | 18 | 30 |
| Black | 196 | 70 | 126 |
| Hispanic | 546 | 208 | 338 |
| Native Hawaiian or Other Pacific Islanders | 4 | 0 | 4 |
| White | 1,249 | 452 | 797 |
| Two or more races | 39 | 11 | 28 |
| Race Unknown | 104 | 40 | 64 |
| Race | Total | Men | Women |
|---|---|---|---|
| American Indian or Native American | 1 | 0 | 1 |
| Asian | 29 | 11 | 18 |
| Black | 125 | 49 | 76 |
| Hispanic | 405 | 163 | 242 |
| Native Hawaiian or Other Pacific Islanders | 2 | 0 | 2 |
| White | 628 | 257 | 371 |
| Two or more races | 26 | 8 | 18 |
| Race Unknown | 33 | 15 | 18 |
| Race | Total | Men | Women |
|---|---|---|---|
| American Indian or Native American | 0 | 0 | 0 |
| Asian | 7 | 3 | 4 |
| Black | 20 | 5 | 15 |
| Hispanic | 40 | 14 | 26 |
| Native Hawaiian or Other Pacific Islanders | 0 | 0 | 0 |
| White | 55 | 18 | 37 |
| Two or more races | 2 | 1 | 1 |
| Race Unknown | 3 | 1 | 2 |
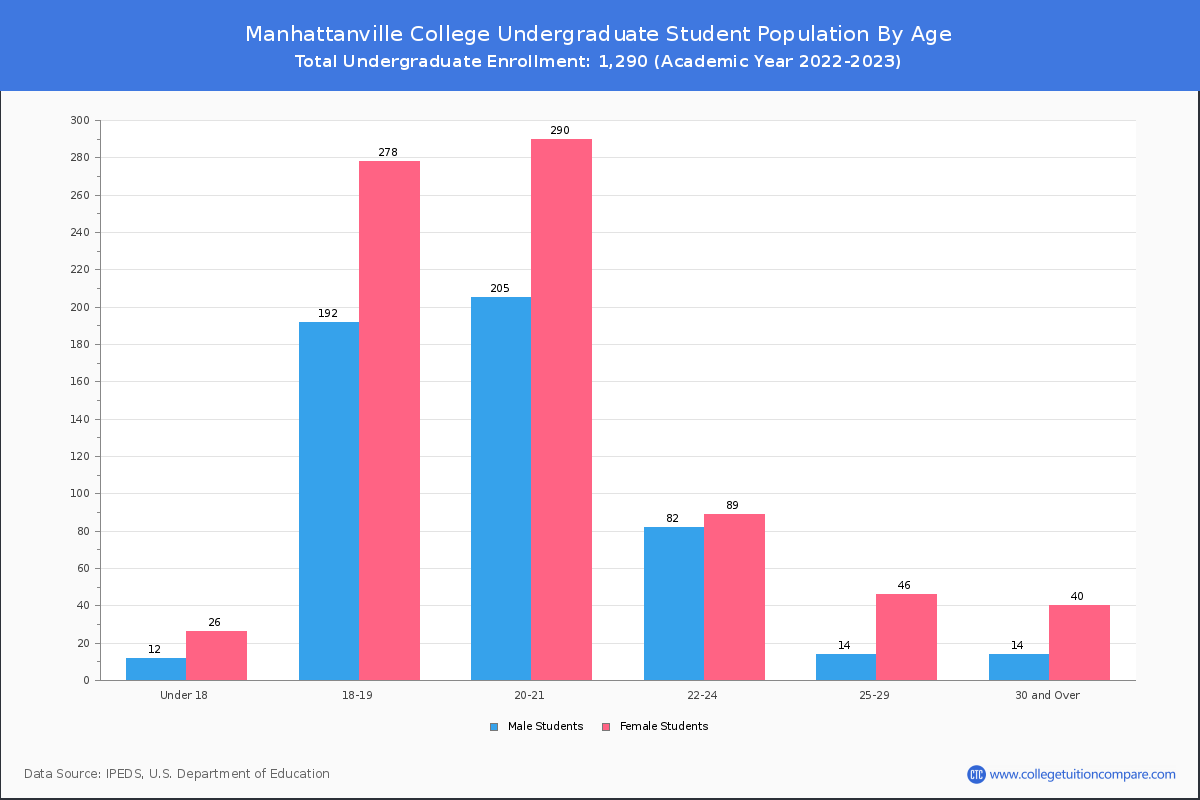
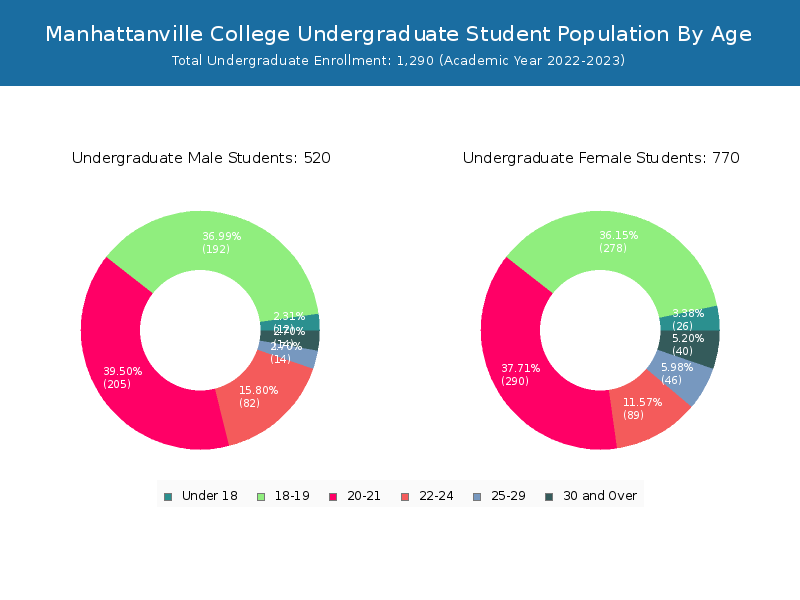
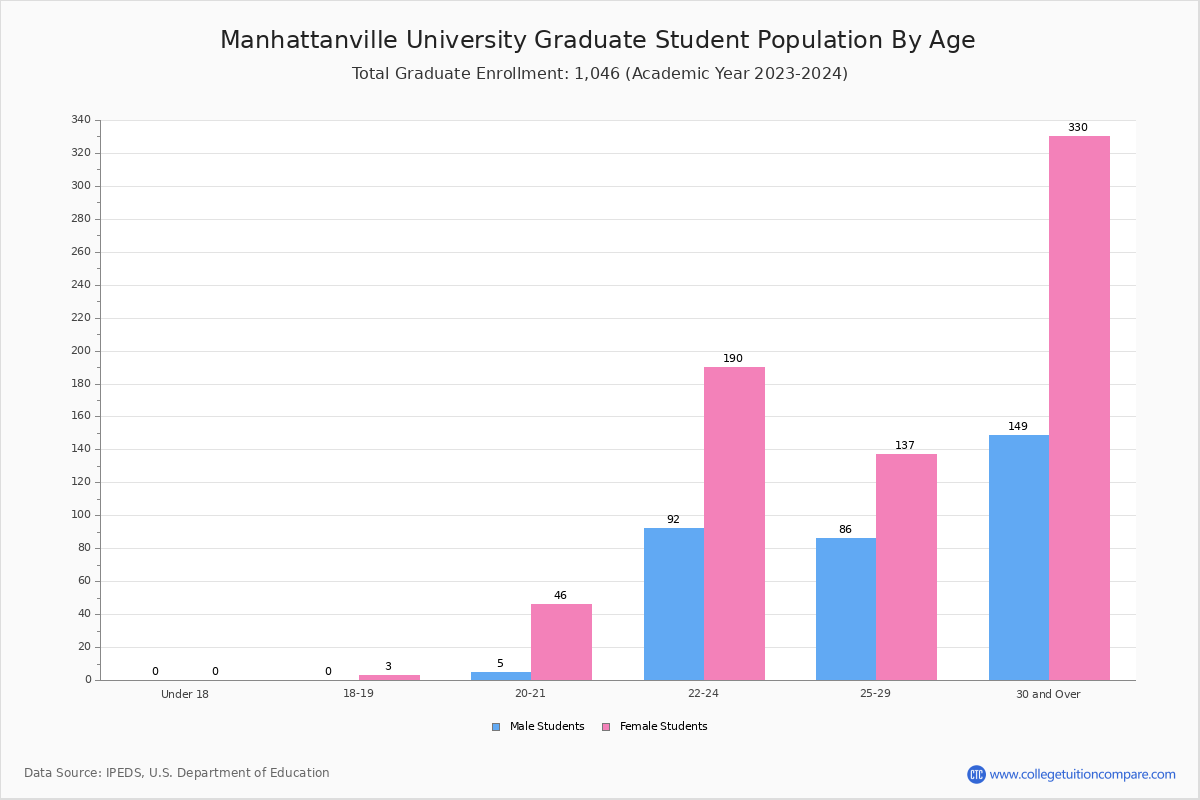
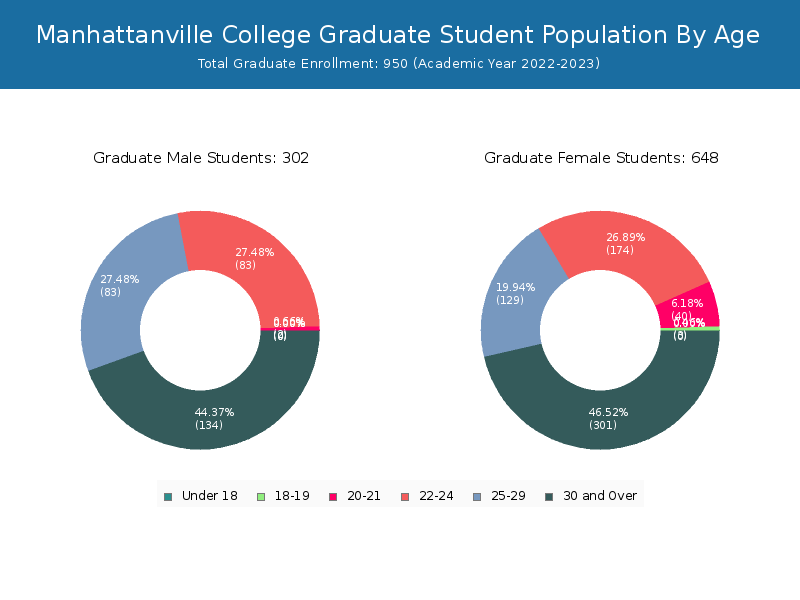
Student Age Distribution
By age, Manhattanville has 38 students under 18 years old and 5 students over 65 years old. There are 1,476 students under 25 years old, and 761 students over 25 years old out of 2,240 total students.
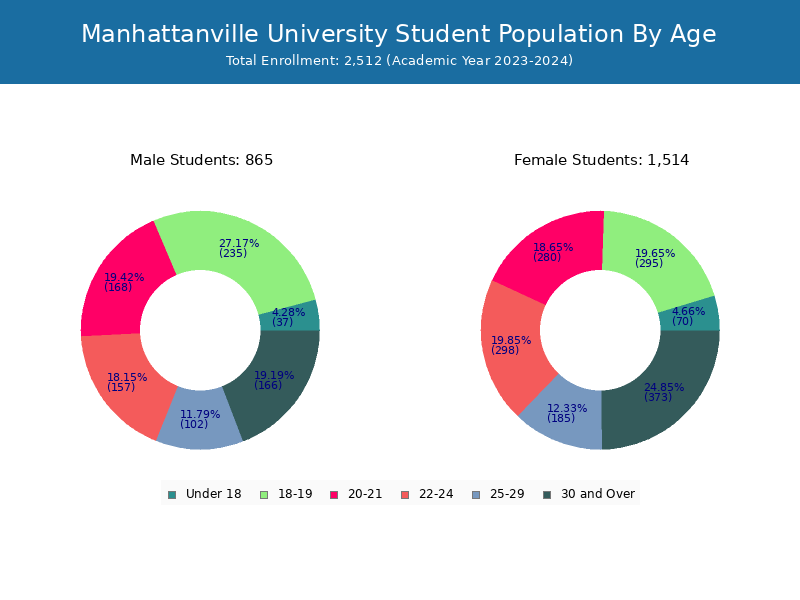
Manhattanville has 1,174 undergraduate students aged under 25 and 114 students aged 25 and over.
It has 302 graduate students aged under 25 and 647 students aged 25 and over.
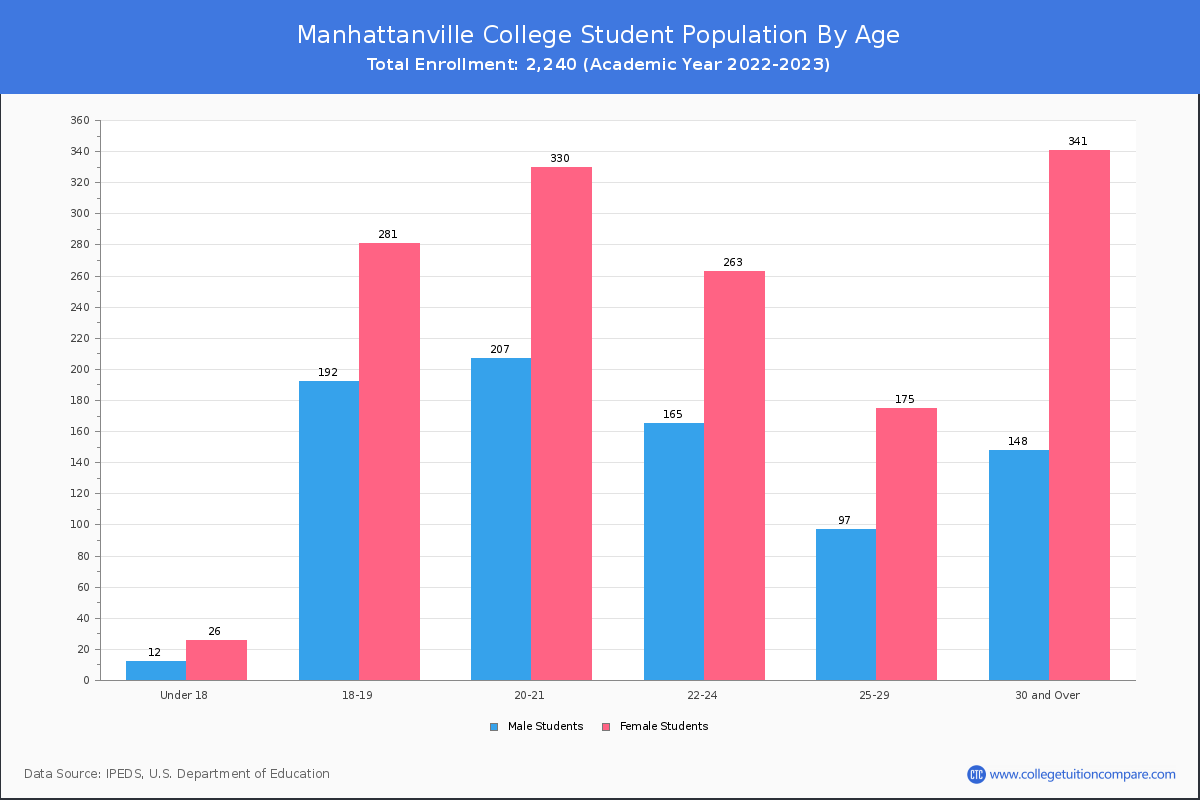
| Age | Total | Men | Women |
|---|---|---|---|
| Under 18 | 38 | 26 | 12 |
| 18-19 | 473 | 281 | 192 |
| 20-21 | 537 | 330 | 207 |
| 22-24 | 428 | 263 | 165 |
| 25-29 | 272 | 175 | 97 |
| 30-34 | 156 | 98 | 58 |
| 35-39 | 87 | 63 | 24 |
| 40-49 | 150 | 110 | 40 |
| 50-64 | 91 | 66 | 25 |
| Over 65 | 5 | 4 | 1 |
| Age | Total | Men | Women |
|---|---|---|---|
| Under 18 | 38 | 26 | 12 |
| 18-19 | 470 | 278 | 192 |
| 20-21 | 495 | 290 | 205 |
| 22-24 | 171 | 89 | 82 |
| 25-29 | 60 | 46 | 14 |
| 30-34 | 24 | 17 | 7 |
| 35-39 | 15 | 13 | 2 |
| 40-49 | 10 | 7 | 3 |
| 50-64 | 5 | 3 | 2 |
| Age | Total | Men | Women |
|---|
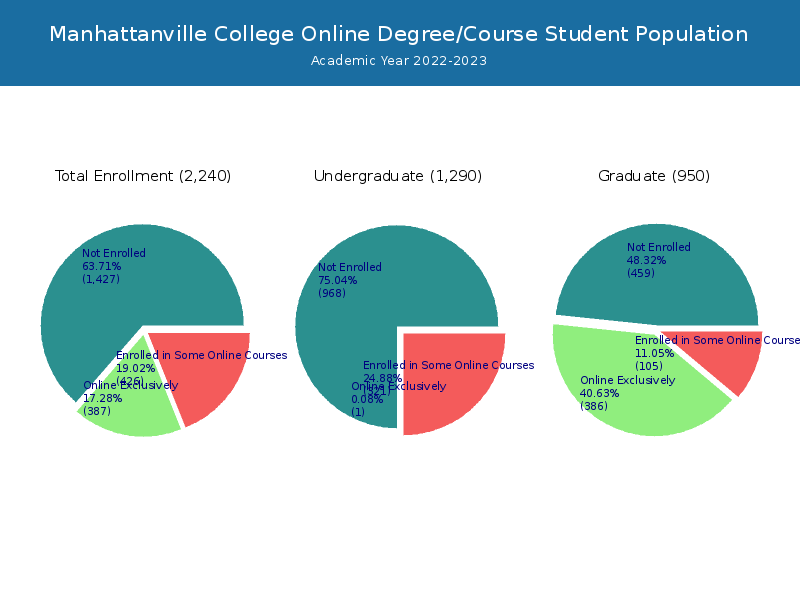
Online Student Enrollment
Distance learning, also called online education, is very attractive to students, especially who want to continue education and work in field. At Manhattanville College, 387 students are enrolled exclusively in online courses and 426 students are enrolled in some online courses.
335 students lived in New York or jurisdiction in which the school is located are enrolled exclusively in online courses and 52 students live in other State or outside of the United States.
| All Students | Enrolled Exclusively Online Courses | Enrolled in Some Online Courses | |
|---|---|---|---|
| All Students | 2,240 | 387 | 426 |
| Undergraduate | 1,290 | 1 | 321 |
| Graduate | 950 | 386 | 105 |
| New York Residents | Other States in U.S. | Outside of U.S. | |
|---|---|---|---|
| All Students | 335 | 52 | 0 |
| Undergraduate | 1 | - | 0 |
| Graduate | 334 | 52 | 0 |
Transfer-in Students (Undergraduate)
Among 1,290 enrolled in undergraduate programs, 130 students have transferred-in from other institutions. The percentage of transfer-in students is 10.08%.124 students have transferred in as full-time status and 6 students transferred in as part-time status.
| Number of Students | |
|---|---|
| Regular Full-time | 1,120 |
| Transfer-in Full-time | 124 |
| Regular Part-time | 40 |
| Transfer-in Part-time | 6 |