Student Population by Gender
Hobart and William Smith Colleges has a total of 1,607 enrolled students for the academic year 2022-2023. 1,559 students have enrolled in undergraduate programs and 48 students joined graduate programs.
By gender, 793 male and 814 female students (the male-female ratio is 49:51) are attending the school. The gender distribution is based on the 2022-2023 data.
| Total | Undergraduate | Graduate | |
|---|---|---|---|
| Total | 1,607 | 1,559 | 48 |
| Men | 793 | 763 | 30 |
| Women | 814 | 796 | 18 |
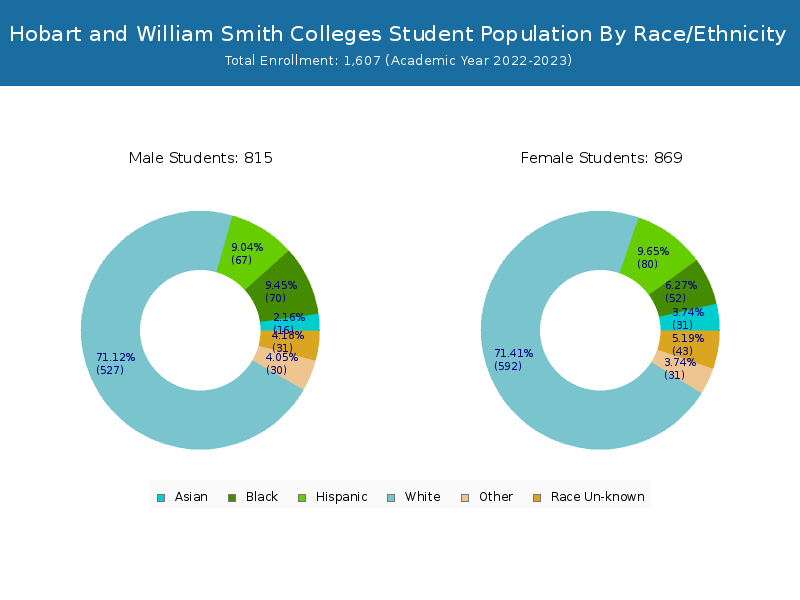
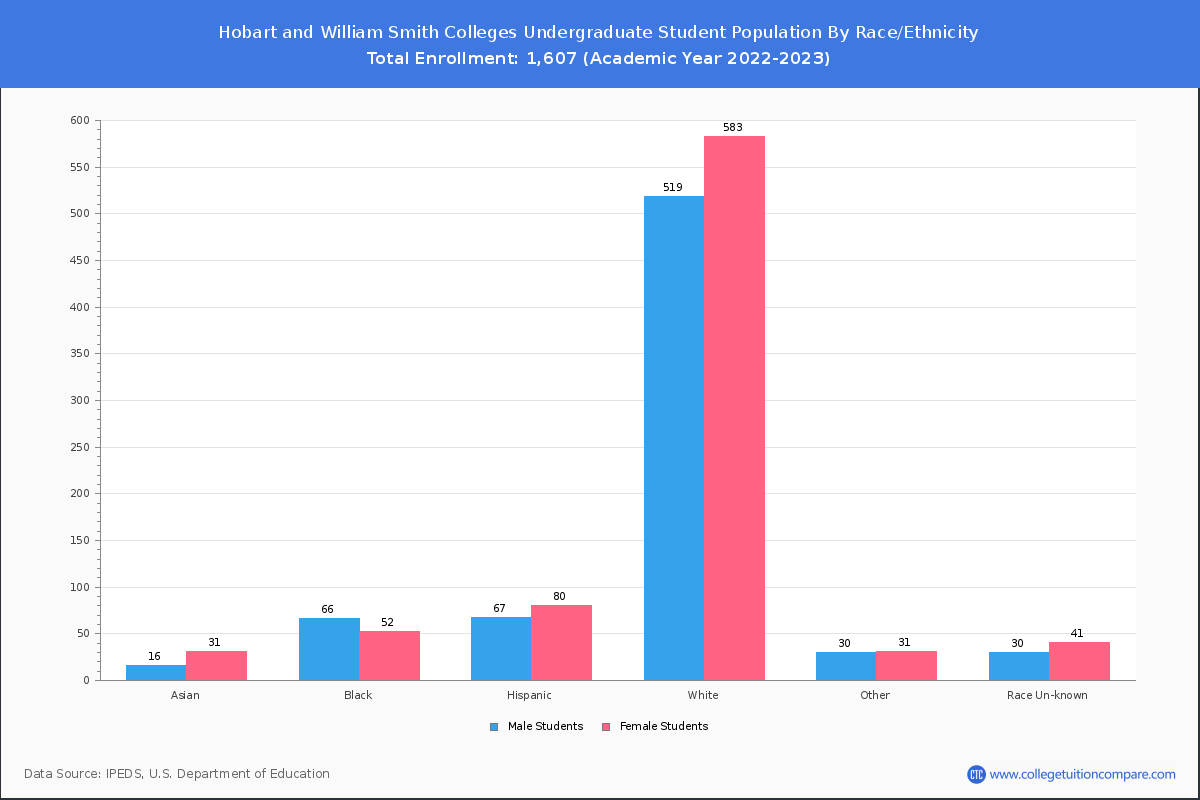
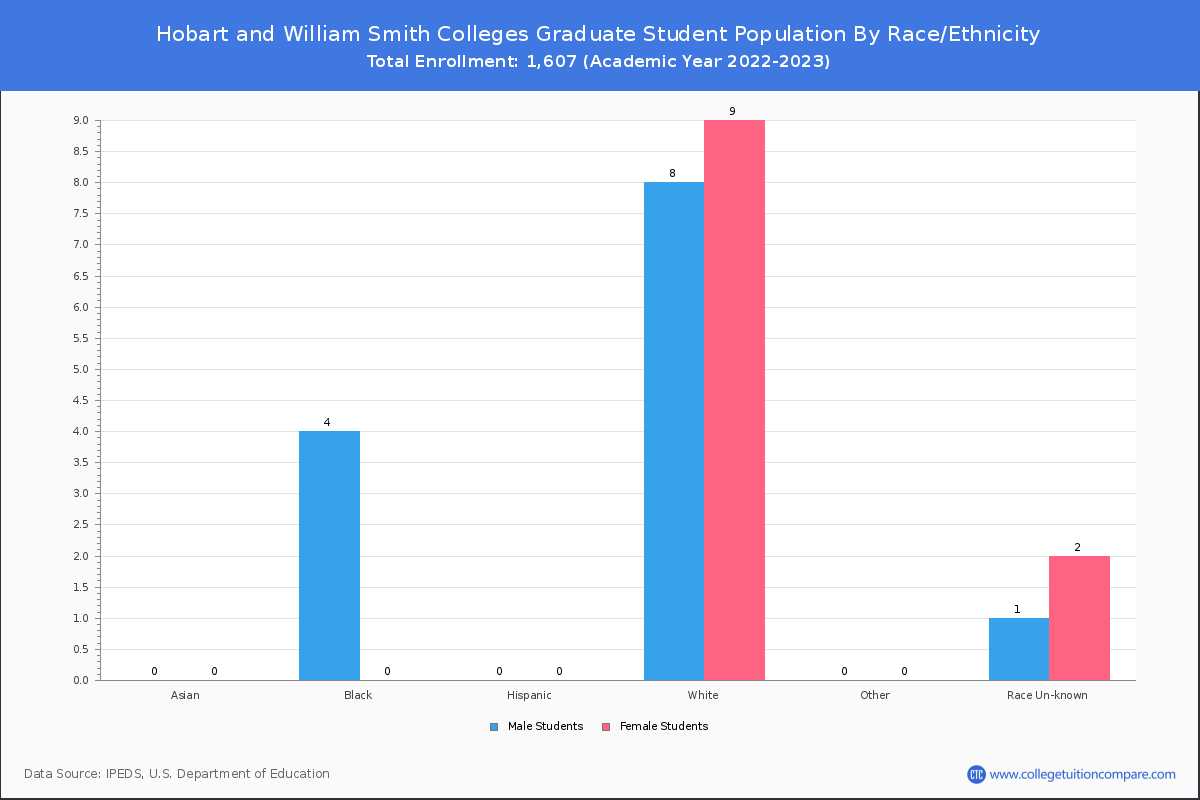
Student Distribution by Race/Ethnicity
By race/ethnicity, 1,051 White, 111 Black, and 36 Asian students out of a total of 1,607 are attending at Hobart and William Smith Colleges. Comprehensive enrollment statistic data by race/ethnicity is shown in the next chart (Academic year 2022-2023 data).
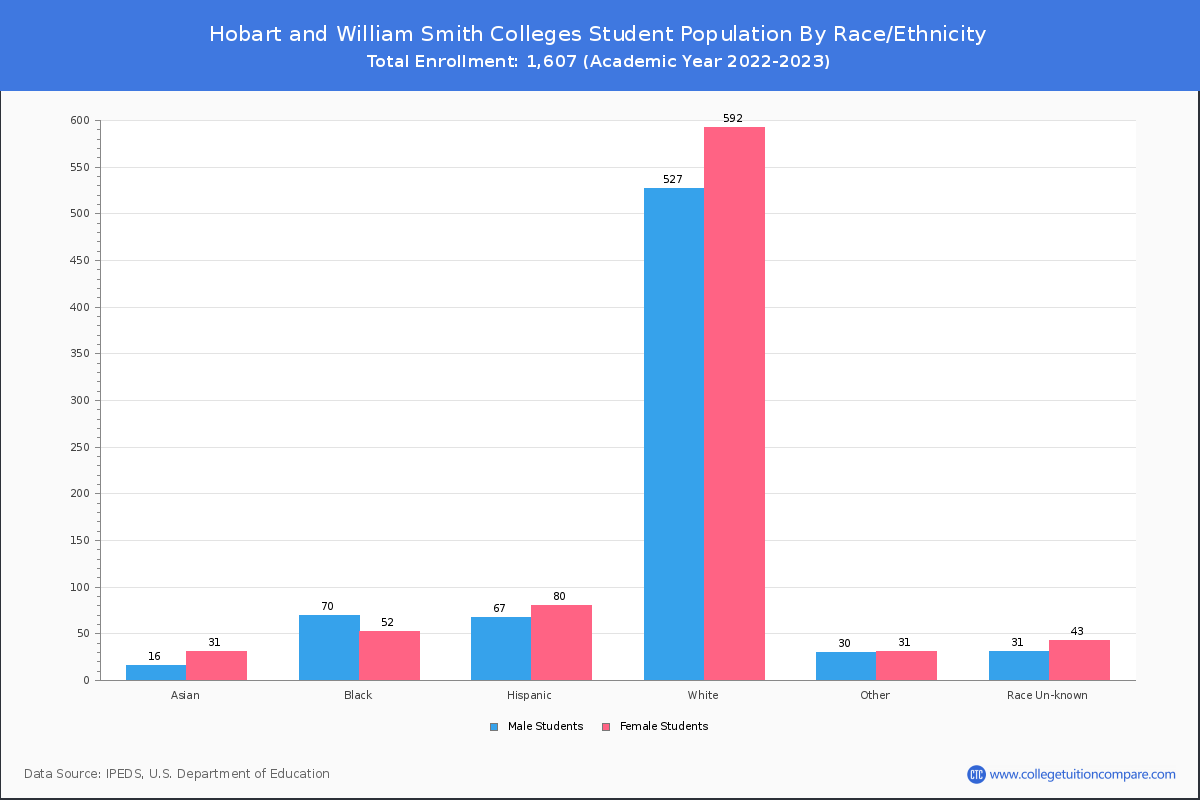
| Race | Total | Men | Women |
|---|---|---|---|
| American Indian or Native American | 2 | 2 | 0 |
| Asian | 36 | 11 | 25 |
| Black | 111 | 58 | 53 |
| Hispanic | 150 | 72 | 78 |
| Native Hawaiian or Other Pacific Islanders | 1 | 0 | 1 |
| White | 1,051 | 516 | 535 |
| Two or more races | 58 | 29 | 29 |
| Race Unknown | 65 | 27 | 38 |
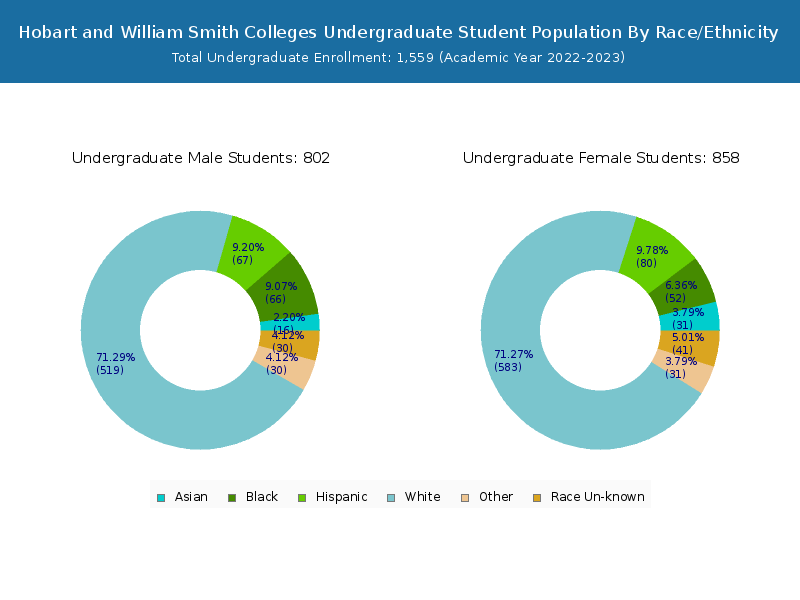
| Race | Total | Men | Women |
|---|---|---|---|
| American Indian or Native American | 2 | 2 | 0 |
| Asian | 36 | 11 | 25 |
| Black | 106 | 56 | 50 |
| Hispanic | 144 | 69 | 75 |
| Native Hawaiian or Other Pacific Islanders | 1 | 0 | 1 |
| White | 1,026 | 500 | 526 |
| Two or more races | 55 | 26 | 29 |
| Race Unknown | 57 | 22 | 35 |
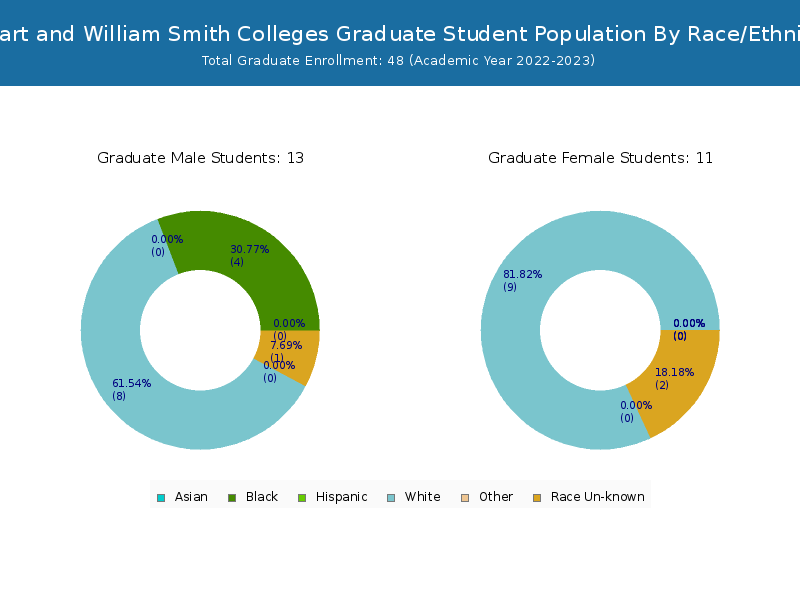
| Race | Total | Men | Women |
|---|---|---|---|
| American Indian or Native American | 0 | 0 | 0 |
| Asian | 0 | 0 | 0 |
| Black | 0 | 0 | 0 |
| Hispanic | 2 | 2 | 0 |
| Native Hawaiian or Other Pacific Islanders | 0 | 0 | 0 |
| White | 17 | 7 | 10 |
| Two or more races | 3 | 2 | 1 |
| Race Unknown | 0 | 0 | 0 |
Transfer-in Students (Undergraduate)
Among 1,559 enrolled in undergraduate programs, 27 students have transferred-in from other institutions. The percentage of transfer-in students is 1.73%.
| Number of Students | |
|---|---|
| Regular Full-time | 1,520 |
| Transfer-in Full-time | 27 |