Student Population by Gender
Cornell University has a total of 25,898 enrolled students for the academic year 2022-2023. 15,735 students have enrolled in undergraduate programs and 10,163 students joined graduate programs.
By gender, 12,213 male and 13,685 female students (the male-female ratio is 47:53) are attending the school. The gender distribution is based on the 2022-2023 data.
| Total | Undergraduate | Graduate | |
|---|---|---|---|
| Total | 25,898 | 15,735 | 10,163 |
| Men | 12,213 | 7,162 | 5,051 |
| Women | 13,685 | 8,573 | 5,112 |
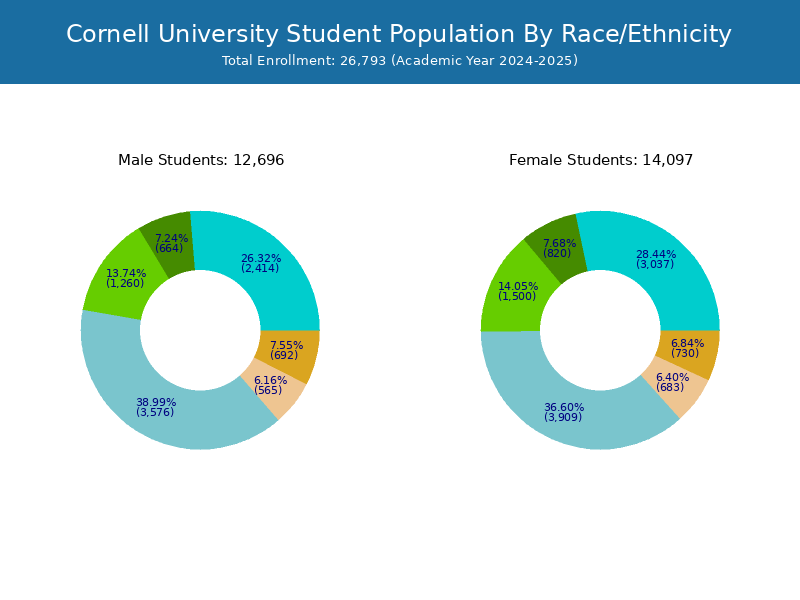
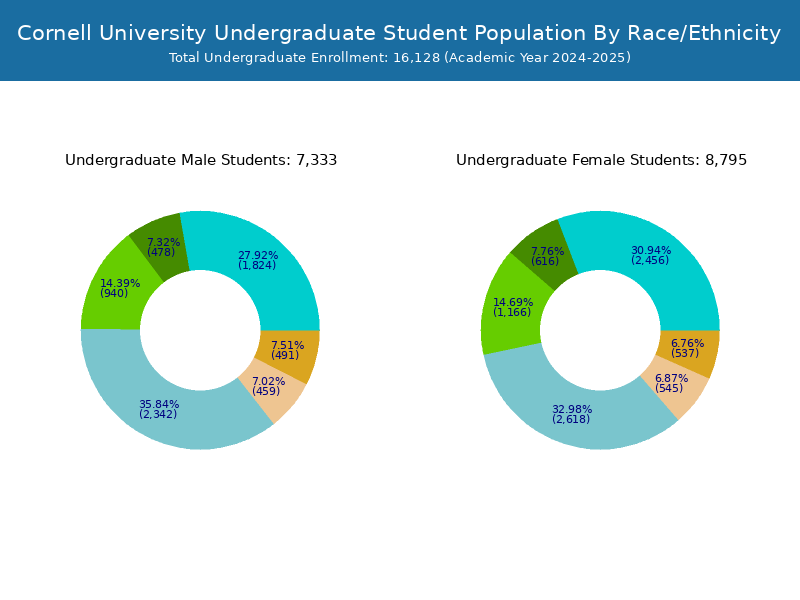
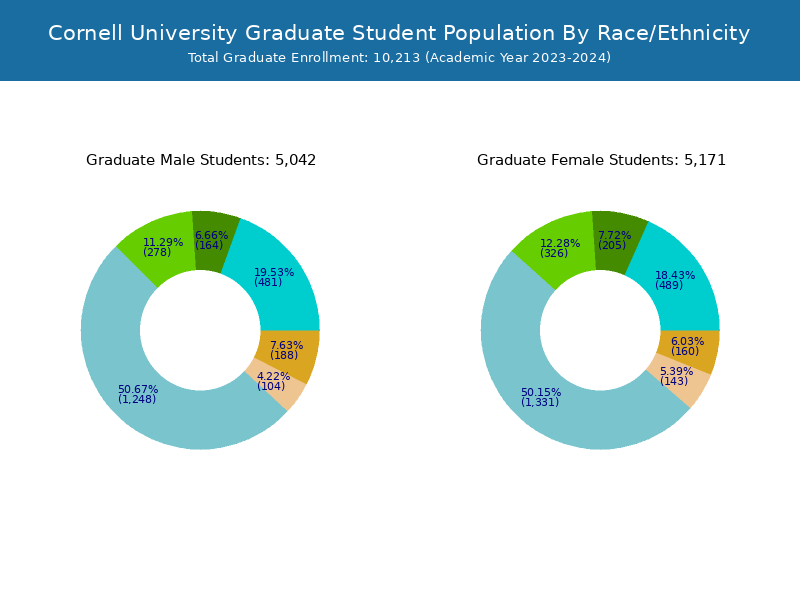
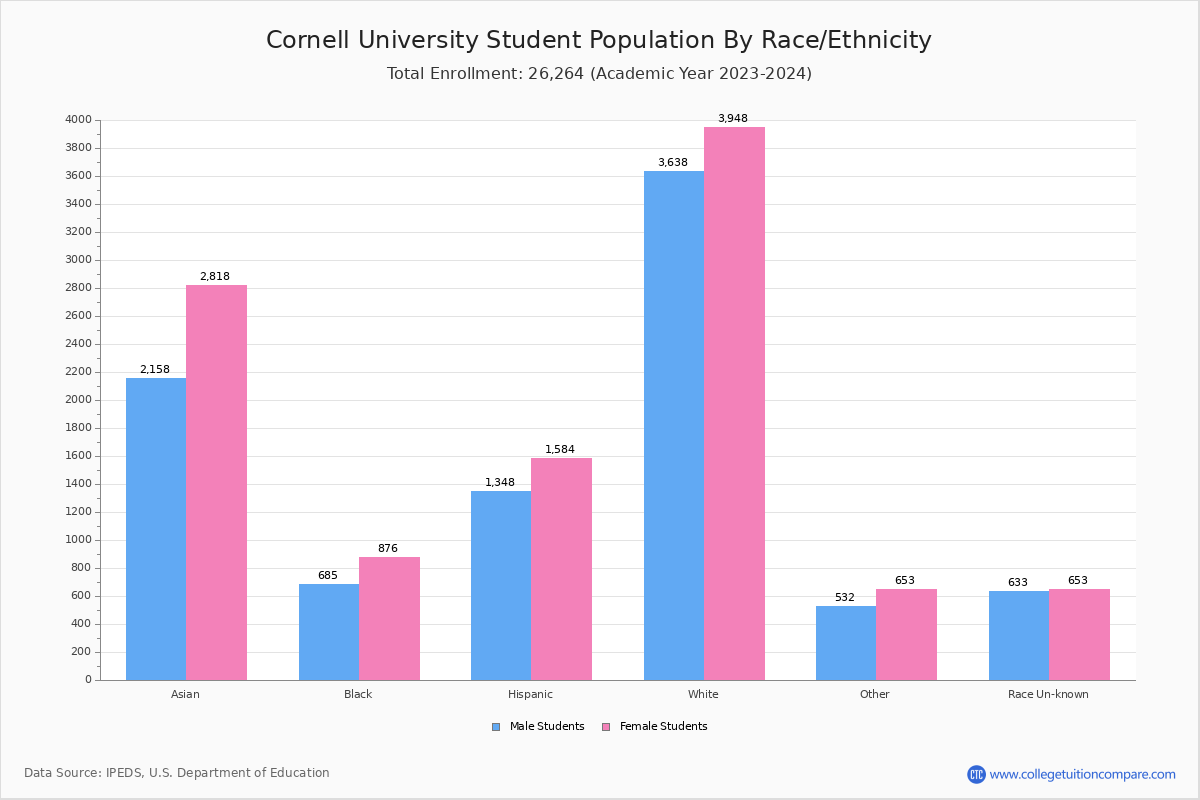
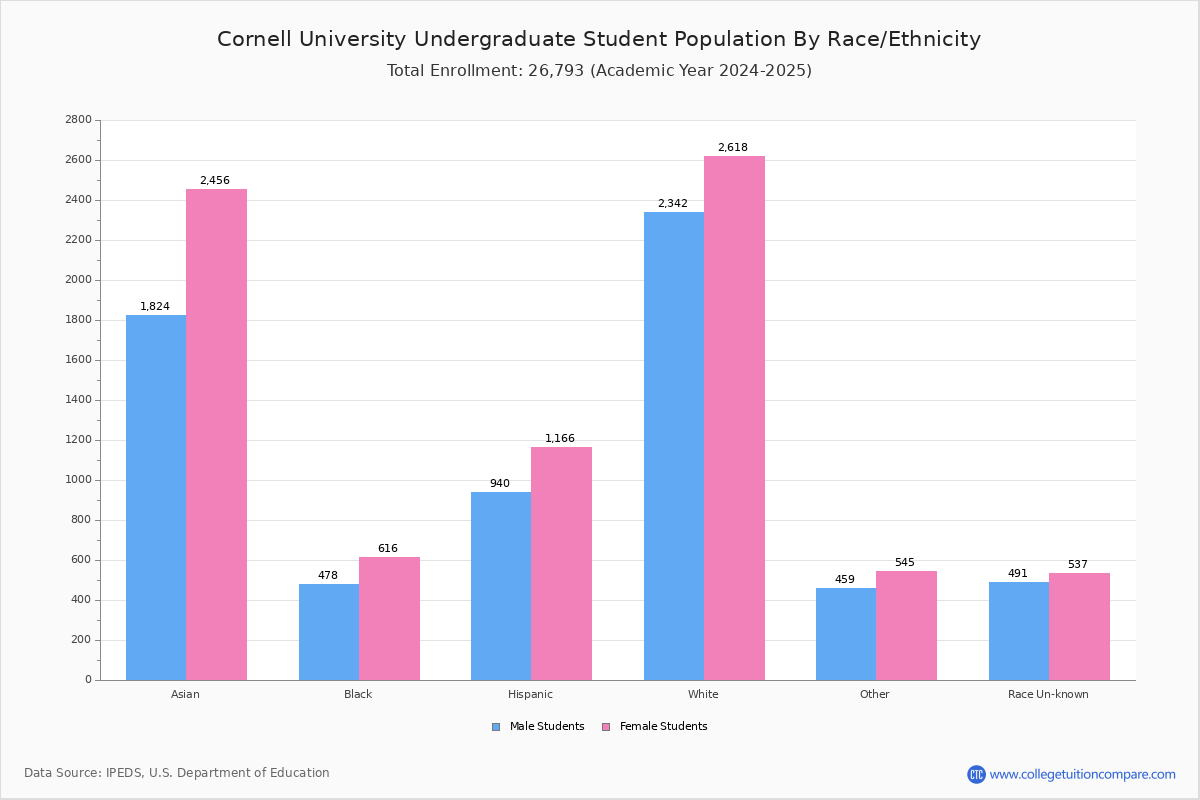
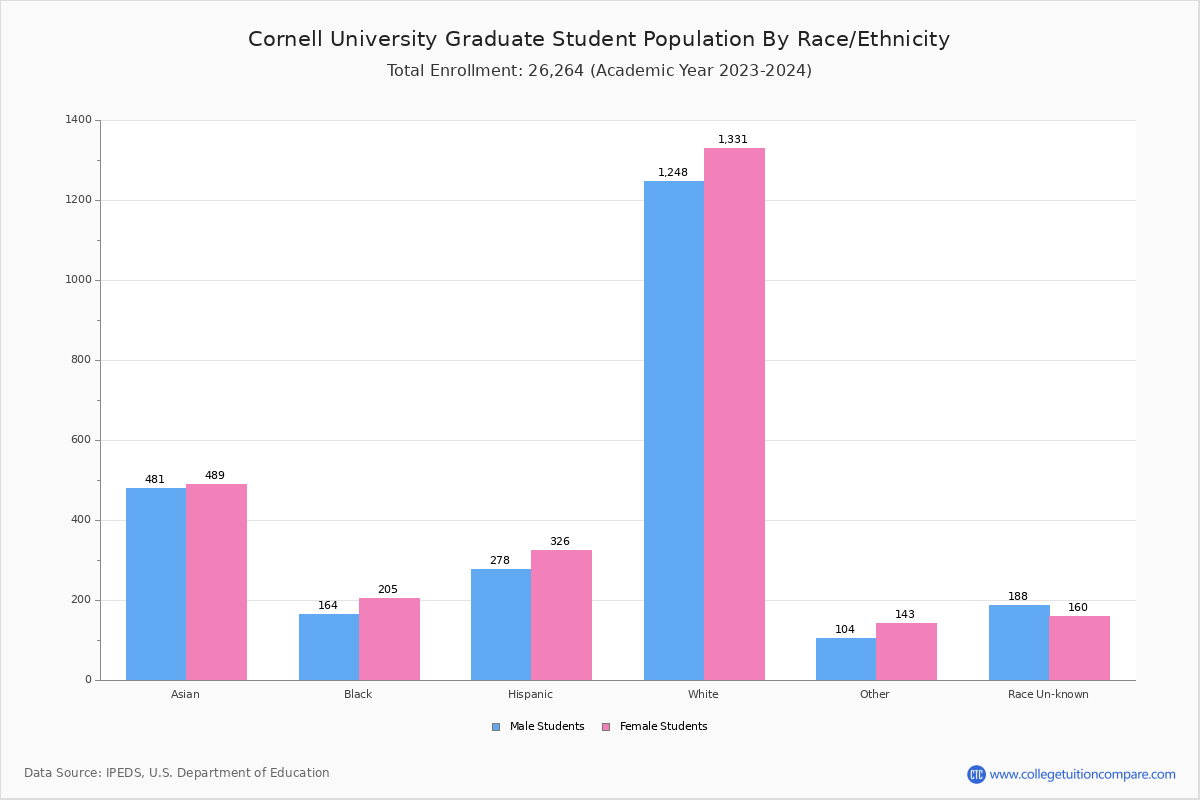
Student Distribution by Race/Ethnicity
By race/ethnicity, 7,840 White, 1,523 Black, and 4,637 Asian students out of a total of 25,898 are attending at Cornell University. Comprehensive enrollment statistic data by race/ethnicity is shown in the next chart (Academic year 2022-2023 data).
| Race | Total | Men | Women |
|---|---|---|---|
| American Indian or Native American | 61 | 31 | 30 |
| Asian | 4,637 | 1,988 | 2,649 |
| Black | 1,523 | 680 | 843 |
| Hispanic | 2,900 | 1,393 | 1,507 |
| Native Hawaiian or Other Pacific Islanders | 22 | 12 | 10 |
| White | 7,840 | 3,840 | 4,000 |
| Two or more races | 1,113 | 492 | 621 |
| Race Unknown | 1,367 | 648 | 719 |
| Race | Total | Men | Women |
|---|---|---|---|
| American Indian or Native American | 40 | 22 | 18 |
| Asian | 3,670 | 1,526 | 2,144 |
| Black | 1,150 | 507 | 643 |
| Hispanic | 2,311 | 1,111 | 1,200 |
| Native Hawaiian or Other Pacific Islanders | 21 | 11 | 10 |
| White | 5,147 | 2,484 | 2,663 |
| Two or more races | 862 | 381 | 481 |
| Race Unknown | 943 | 427 | 516 |
| Race | Total | Men | Women |
|---|---|---|---|
| American Indian or Native American | 0 | 0 | 0 |
| Asian | 274 | 107 | 167 |
| Black | 17 | 8 | 9 |
| Hispanic | 50 | 20 | 30 |
| Native Hawaiian or Other Pacific Islanders | 0 | 0 | 0 |
| White | 176 | 80 | 96 |
| Two or more races | 30 | 13 | 17 |
| Race Unknown | 31 | 16 | 15 |
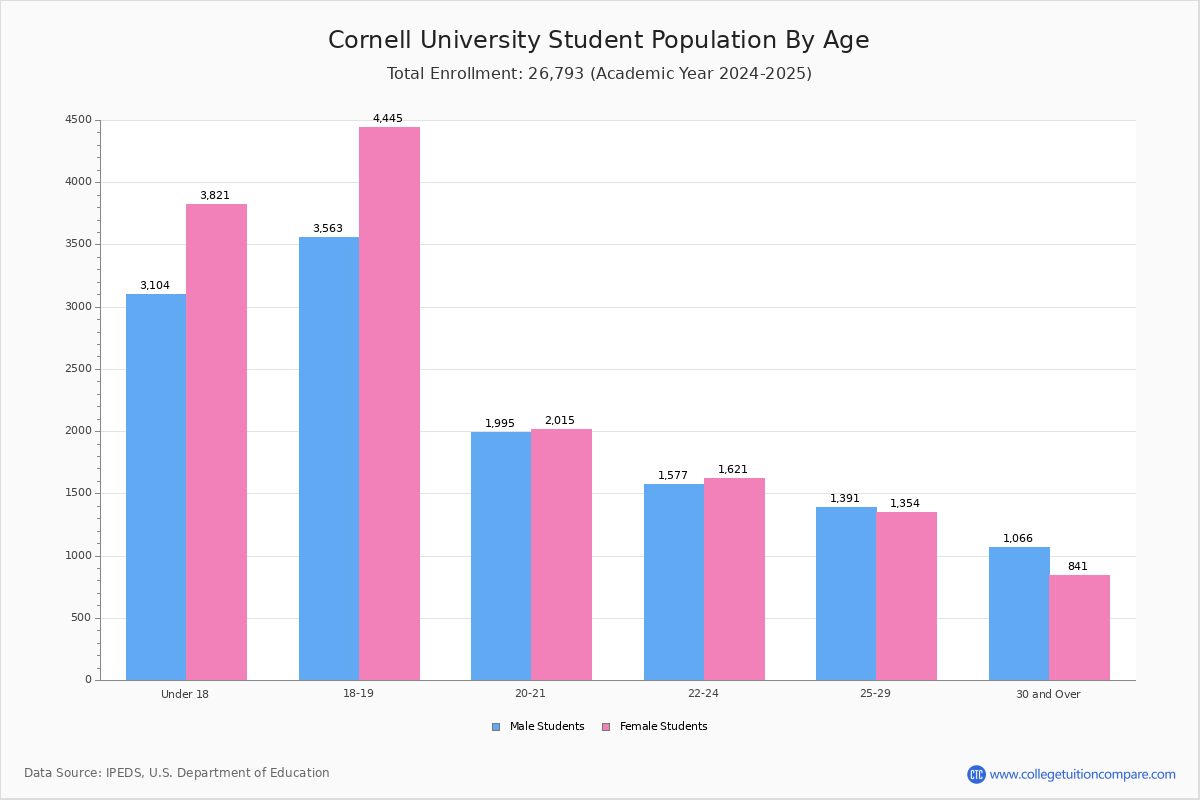
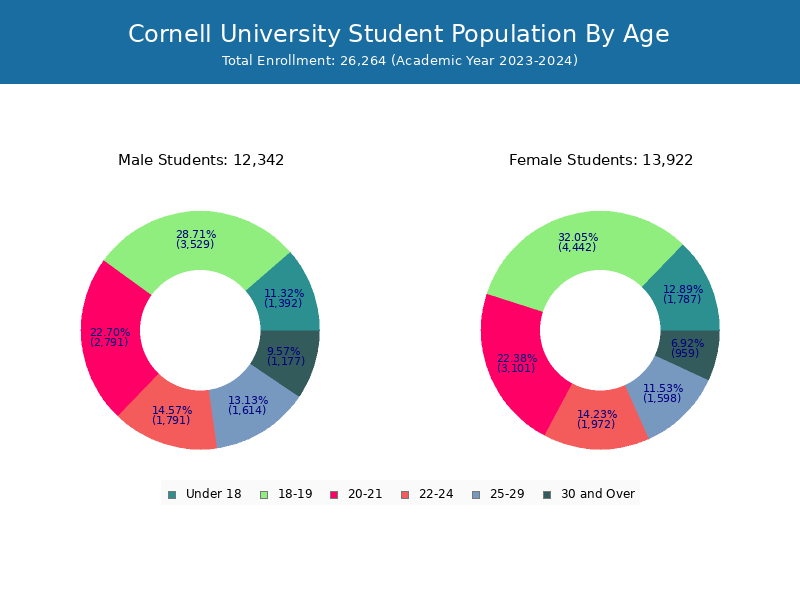
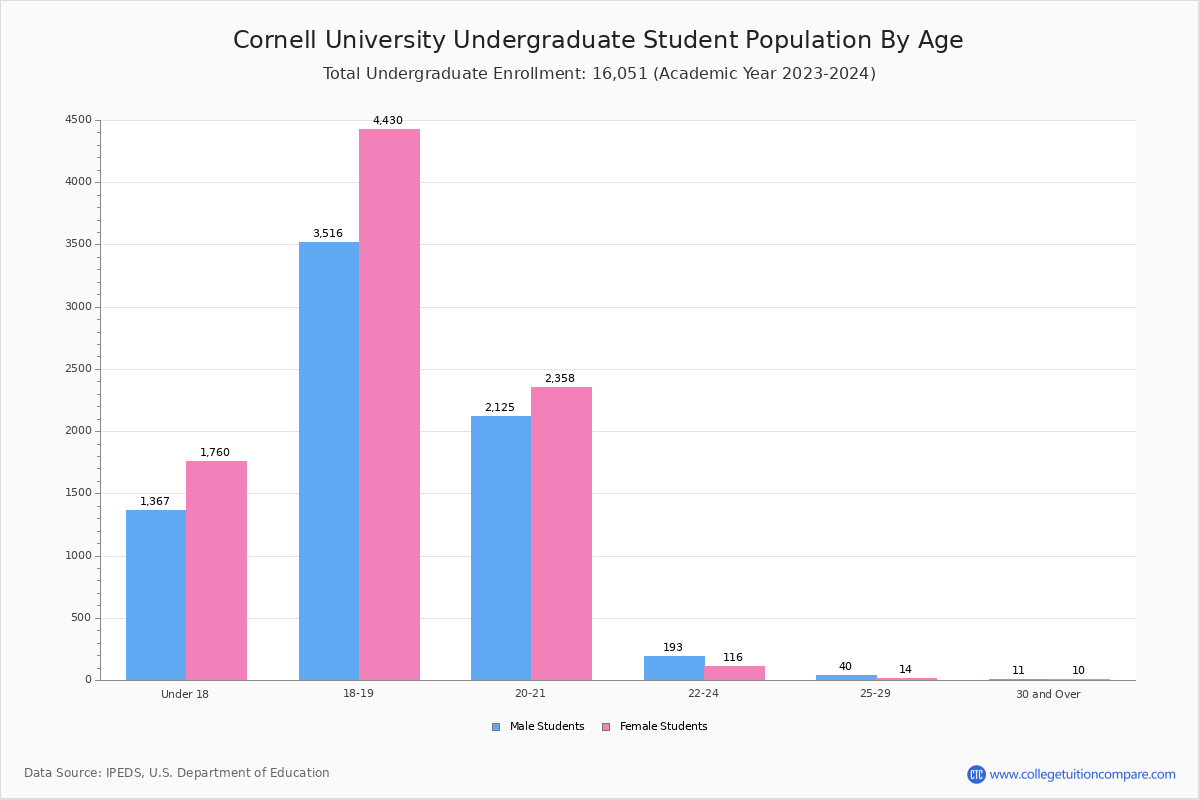
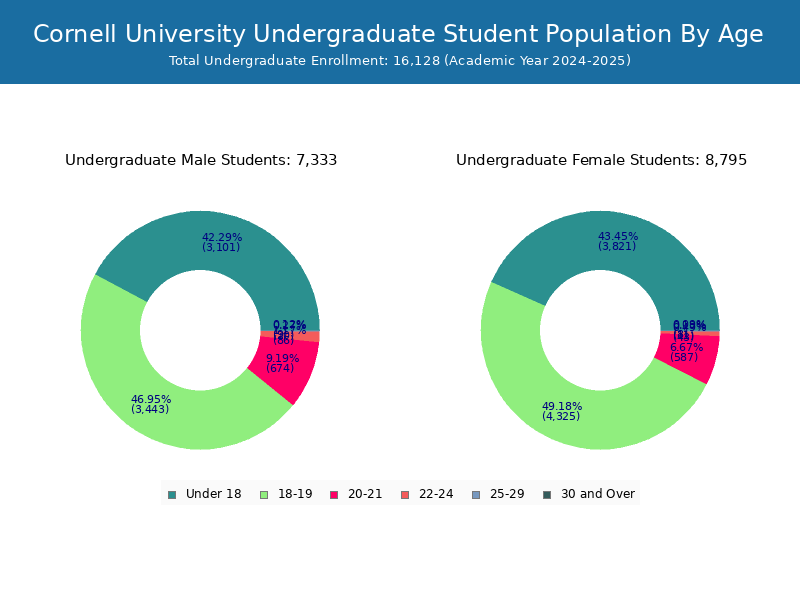
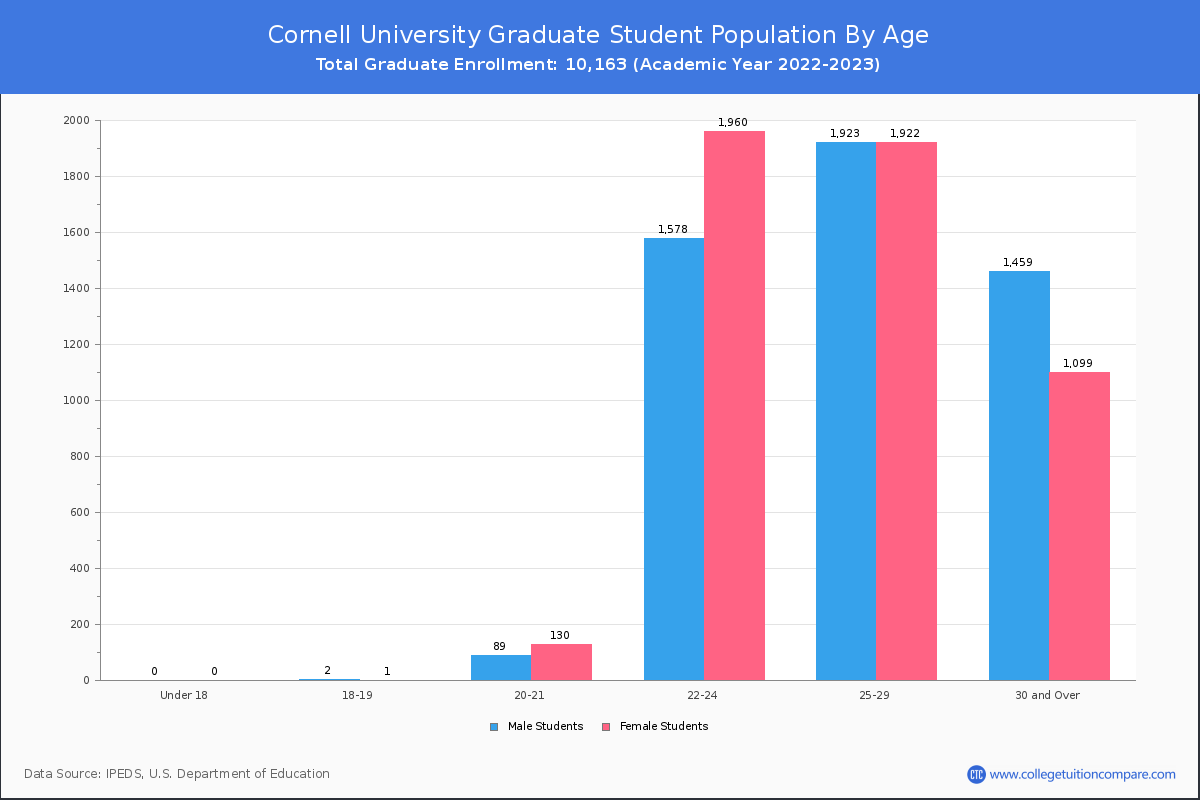
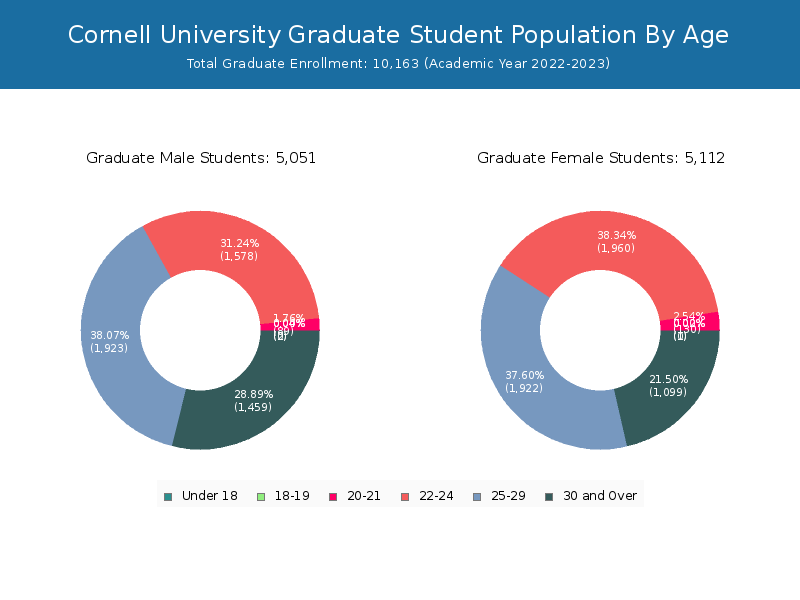
Student Age Distribution
By age, Cornell has 188 students under 18 years old and 5 students over 65 years old. There are 19,352 students under 25 years old, and 6,546 students over 25 years old out of 25,898 total students.
Cornell has 15,592 undergraduate students aged under 25 and 143 students aged 25 and over.
It has 3,760 graduate students aged under 25 and 6,403 students aged 25 and over.
| Age | Total | Men | Women |
|---|---|---|---|
| Under 18 | 188 | 122 | 66 |
| 18-19 | 6,866 | 3,875 | 2,991 |
| 20-21 | 7,495 | 4,087 | 3,408 |
| 22-24 | 4,803 | 2,540 | 2,263 |
| 25-29 | 3,953 | 1,951 | 2,002 |
| 30-34 | 1,573 | 680 | 893 |
| 35-39 | 580 | 235 | 345 |
| 40-49 | 337 | 145 | 192 |
| 50-64 | 98 | 48 | 50 |
| Over 65 | 5 | 2 | 3 |
| Age | Total | Men | Women |
|---|---|---|---|
| Under 18 | 188 | 122 | 66 |
| 18-19 | 6,863 | 3,874 | 2,989 |
| 20-21 | 7,276 | 3,957 | 3,319 |
| 22-24 | 1,265 | 580 | 685 |
| 25-29 | 108 | 29 | 79 |
| 30-34 | 16 | 4 | 12 |
| 35-39 | 10 | 3 | 7 |
| 40-49 | 7 | 3 | 4 |
| 50-64 | 2 | 1 | 1 |
| Age | Total | Men | Women |
|---|
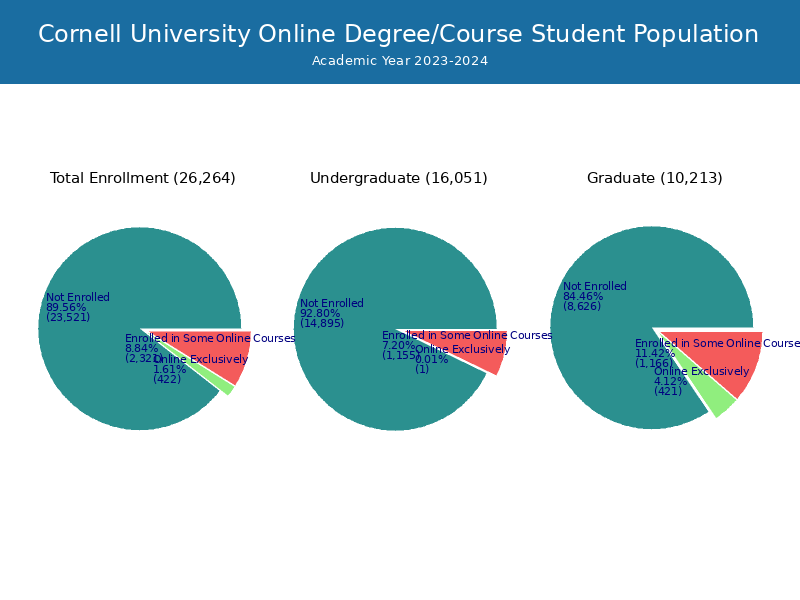
Online Student Enrollment
Distance learning, also called online education, is very attractive to students, especially who want to continue education and work in field. At Cornell University, 382 students are enrolled exclusively in online courses and 2,692 students are enrolled in some online courses.
60 students lived in New York or jurisdiction in which the school is located are enrolled exclusively in online courses and 322 students live in other State or outside of the United States.
| All Students | Enrolled Exclusively Online Courses | Enrolled in Some Online Courses | |
|---|---|---|---|
| All Students | 25,898 | 382 | 2,692 |
| Undergraduate | 15,735 | 0 | 812 |
| Graduate | 10,163 | 382 | 1,880 |
| New York Residents | Other States in U.S. | Outside of U.S. | |
|---|---|---|---|
| All Students | 60 | 297 | 25 |
| Undergraduate | 0 | - | 0 |
| Graduate | 60 | 297 | 25 |
Transfer-in Students (Undergraduate)
Among 15,735 enrolled in undergraduate programs, 631 students have transferred-in from other institutions. The percentage of transfer-in students is 4.01%.
| Number of Students | |
|---|---|
| Regular Full-time | 15,054 |
| Transfer-in Full-time | 631 |