Student Population by Gender
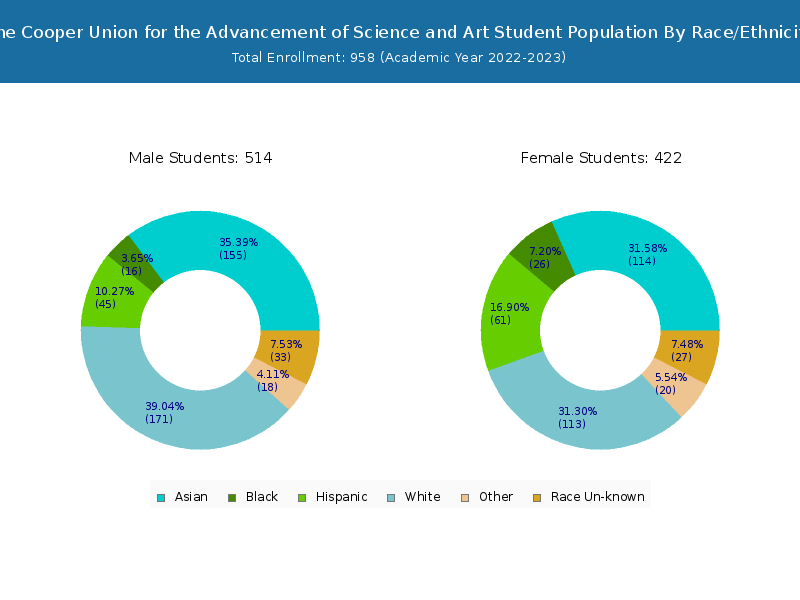
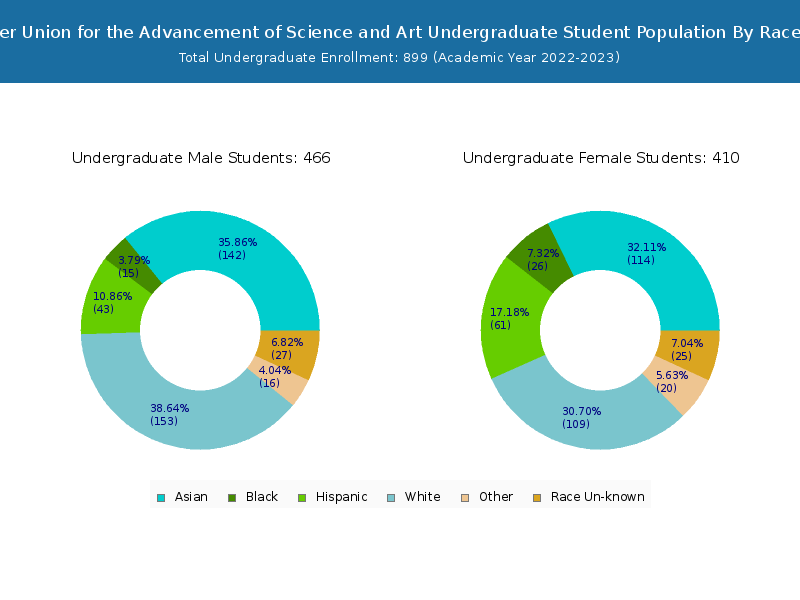
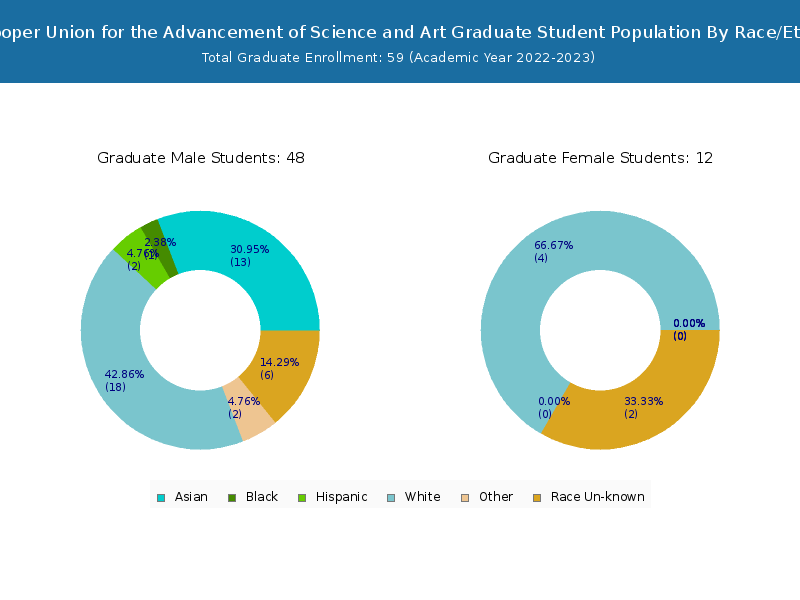
The Cooper Union for the Advancement of Science and Art has a total of 958 enrolled students for the academic year 2022-2023. 899 students have enrolled in undergraduate programs and 59 students joined graduate programs.
By gender, 490 male and 468 female students (the male-female ratio is 51:49) are attending the school. The gender distribution is based on the 2022-2023 data.
| Total | Undergraduate | Graduate | |
|---|---|---|---|
| Total | 958 | 899 | 59 |
| Men | 490 | 443 | 47 |
| Women | 468 | 456 | 12 |
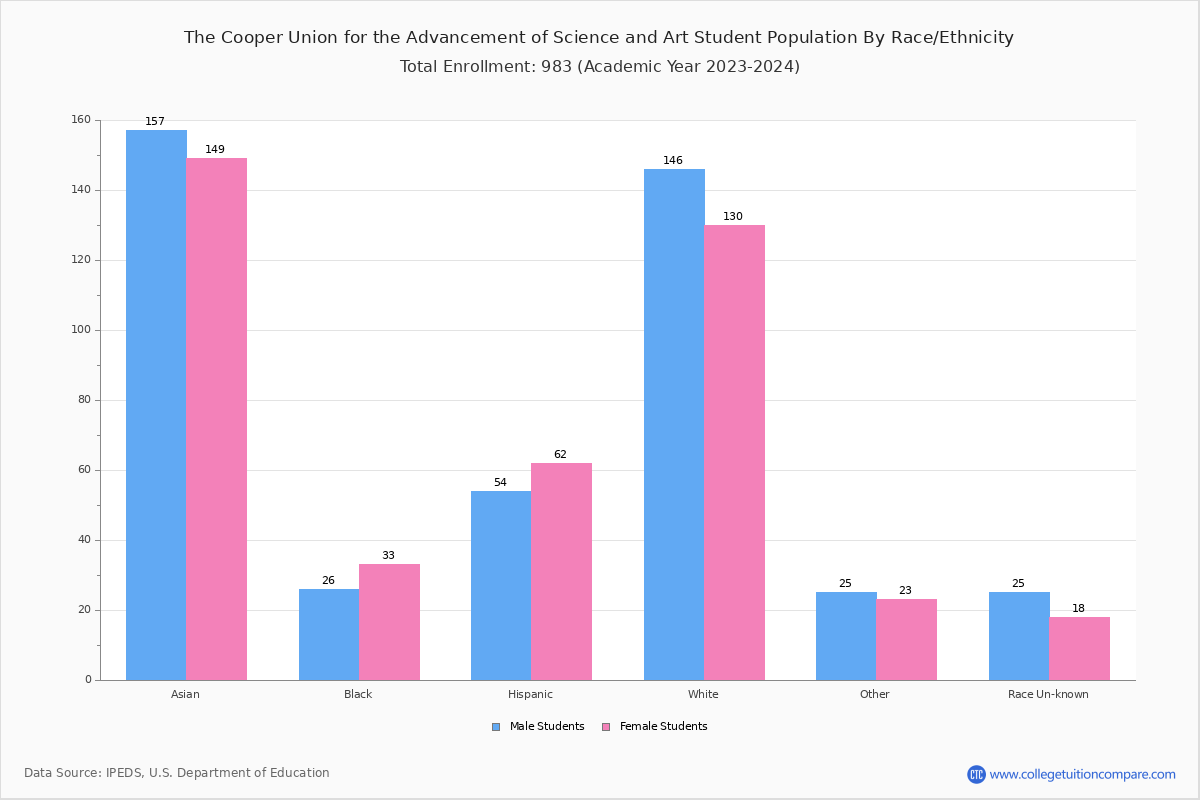
Student Distribution by Race/Ethnicity
By race/ethnicity, 272 White, 46 Black, and 292 Asian students out of a total of 958 are attending at The Cooper Union for the Advancement of Science and Art. Comprehensive enrollment statistic data by race/ethnicity is shown in the next chart (Academic year 2022-2023 data).
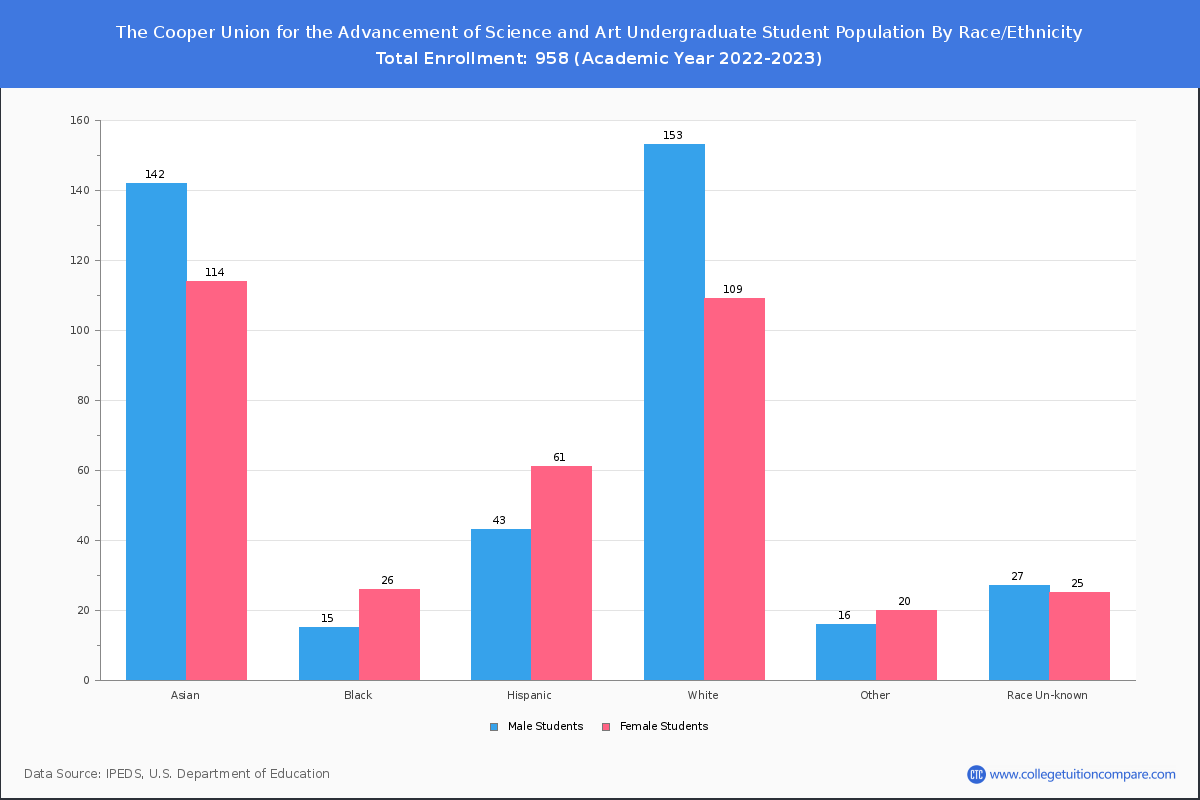
| Race | Total | Men | Women |
|---|---|---|---|
| American Indian or Native American | 0 | 0 | 0 |
| Asian | 292 | 154 | 138 |
| Black | 46 | 19 | 27 |
| Hispanic | 113 | 49 | 64 |
| Native Hawaiian or Other Pacific Islanders | 0 | 0 | 0 |
| White | 272 | 145 | 127 |
| Two or more races | 44 | 25 | 19 |
| Race Unknown | 58 | 30 | 28 |
| Race | Total | Men | Women |
|---|---|---|---|
| American Indian or Native American | 0 | 0 | 0 |
| Asian | 275 | 138 | 137 |
| Black | 45 | 18 | 27 |
| Hispanic | 111 | 47 | 64 |
| Native Hawaiian or Other Pacific Islanders | 0 | 0 | 0 |
| White | 254 | 131 | 123 |
| Two or more races | 42 | 23 | 19 |
| Race Unknown | 52 | 24 | 28 |
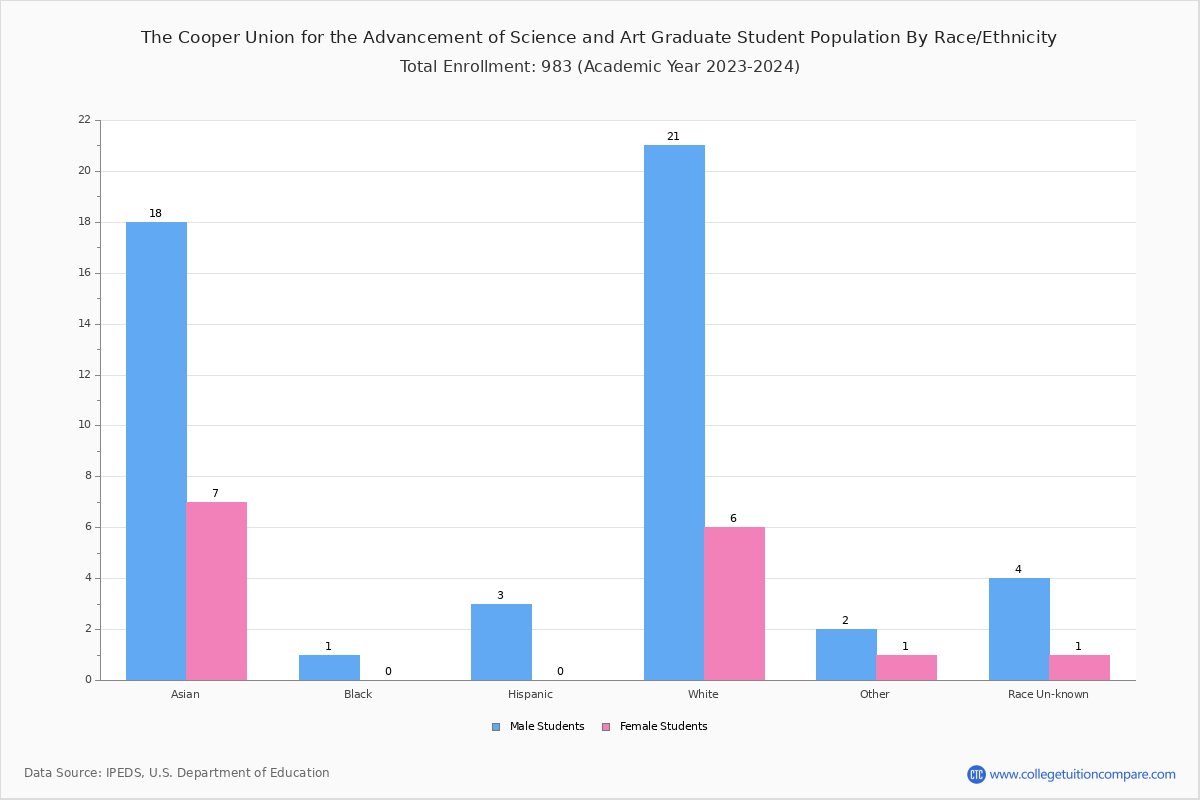
| Race | Total | Men | Women |
|---|---|---|---|
| American Indian or Native American | 0 | 0 | 0 |
| Asian | 1 | 0 | 1 |
| Black | 2 | 0 | 2 |
| Hispanic | 4 | 1 | 3 |
| Native Hawaiian or Other Pacific Islanders | 0 | 0 | 0 |
| White | 5 | 2 | 3 |
| Two or more races | 0 | 0 | 0 |
| Race Unknown | 0 | 0 | 0 |
Student Age Distribution
There are 912 students under 25 years old, and 35 students over 25 years old out of 958 total students.
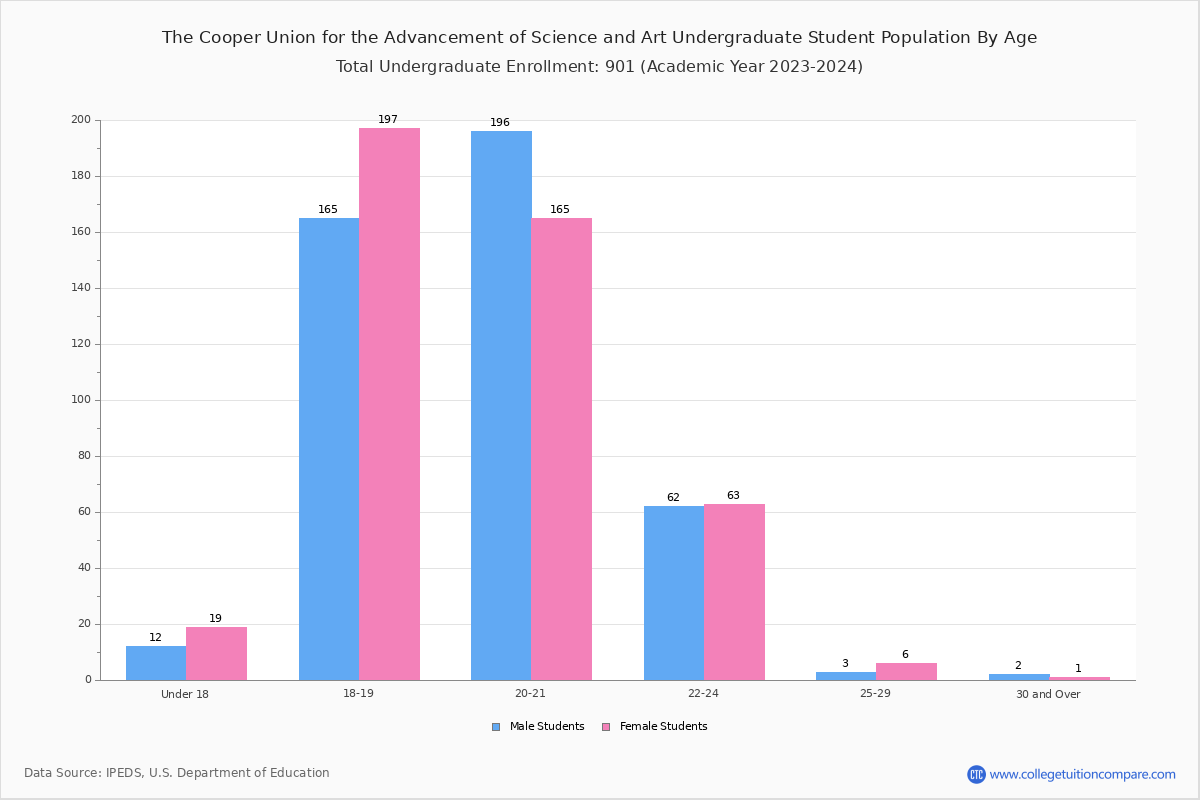
The Cooper Union has 871 undergraduate students aged under 25 and 18 students aged 25 and over.
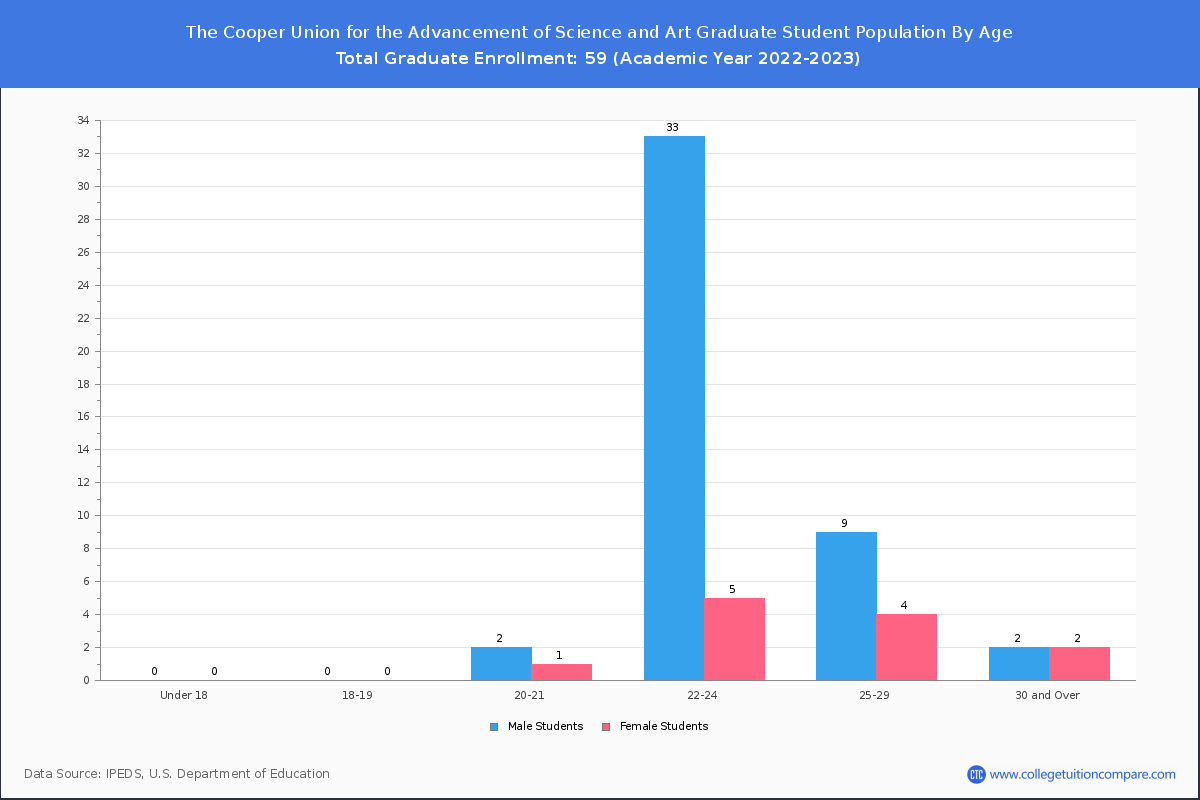
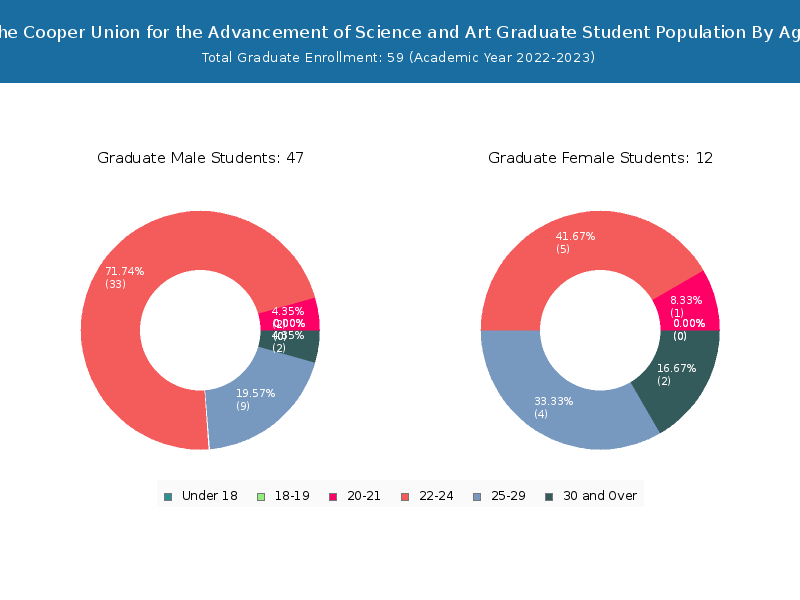
It has 41 graduate students aged under 25 and 17 students aged 25 and over.
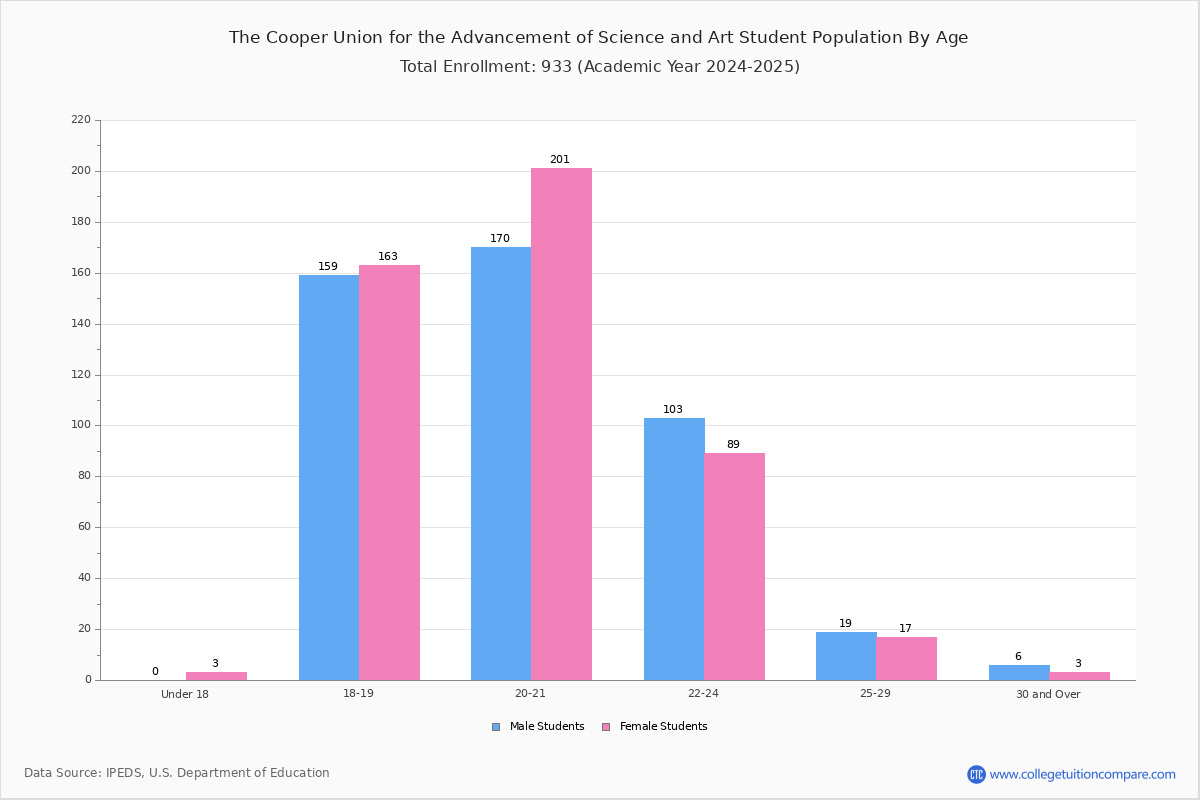

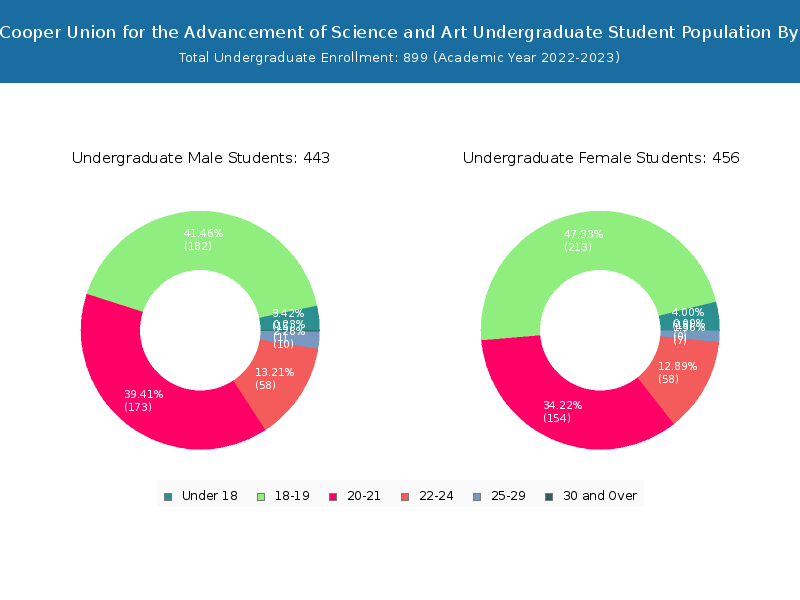
| Age | Total | Men | Women |
|---|---|---|---|
| Under 18 | 33 | 18 | 15 |
| 18-19 | 395 | 213 | 182 |
| 20-21 | 330 | 155 | 175 |
| 22-24 | 154 | 63 | 91 |
| 25-29 | 30 | 11 | 19 |
| 30-34 | 3 | 1 | 2 |
| 35-39 | 2 | 1 | 1 |
| Age | Total | Men | Women |
|---|---|---|---|
| Under 18 | 33 | 18 | 15 |
| 18-19 | 395 | 213 | 182 |
| 20-21 | 327 | 154 | 173 |
| 22-24 | 116 | 58 | 58 |
| 25-29 | 17 | 7 | 10 |
| Age | Total | Men | Women |
|---|
Transfer-in Students (Undergraduate)
Among 899 enrolled in undergraduate programs, 16 students have transferred-in from other institutions. The percentage of transfer-in students is 1.78%.
| Number of Students | |
|---|---|
| Regular Full-time | 882 |
| Transfer-in Full-time | 16 |