Student Population by Gender
Colgate University has a total of 3,141 enrolled students for the academic year 2022-2023. 3,130 students have enrolled in undergraduate programs and 11 students joined graduate programs.
By gender, 1,394 male and 1,747 female students (the male-female ratio is 44:56) are attending the school. The gender distribution is based on the 2022-2023 data.
| Total | Undergraduate | Graduate | |
|---|---|---|---|
| Total | 3,141 | 3,130 | 11 |
| Men | 1,394 | 1,392 | 2 |
| Women | 1,747 | 1,738 | 9 |
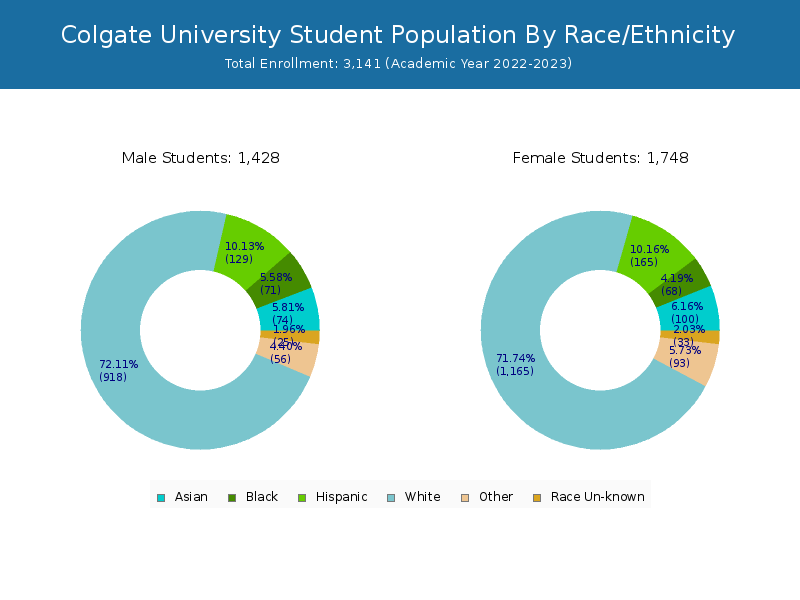
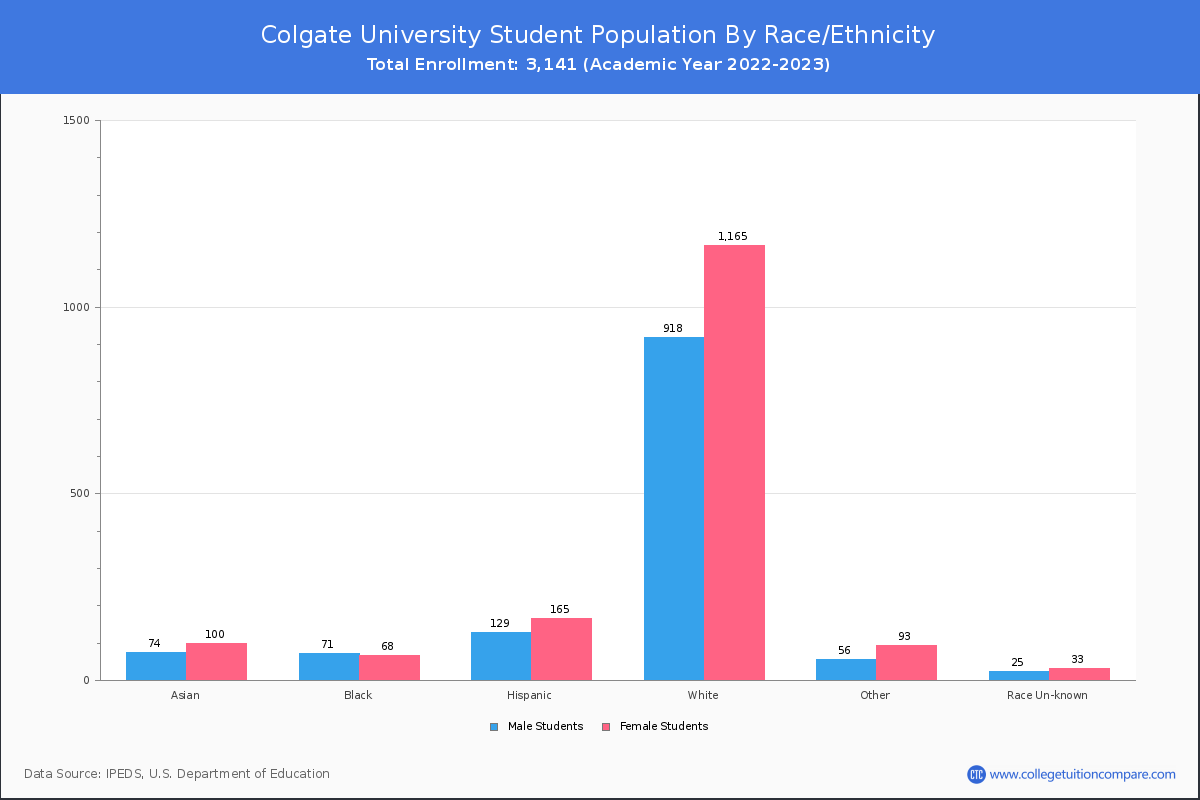
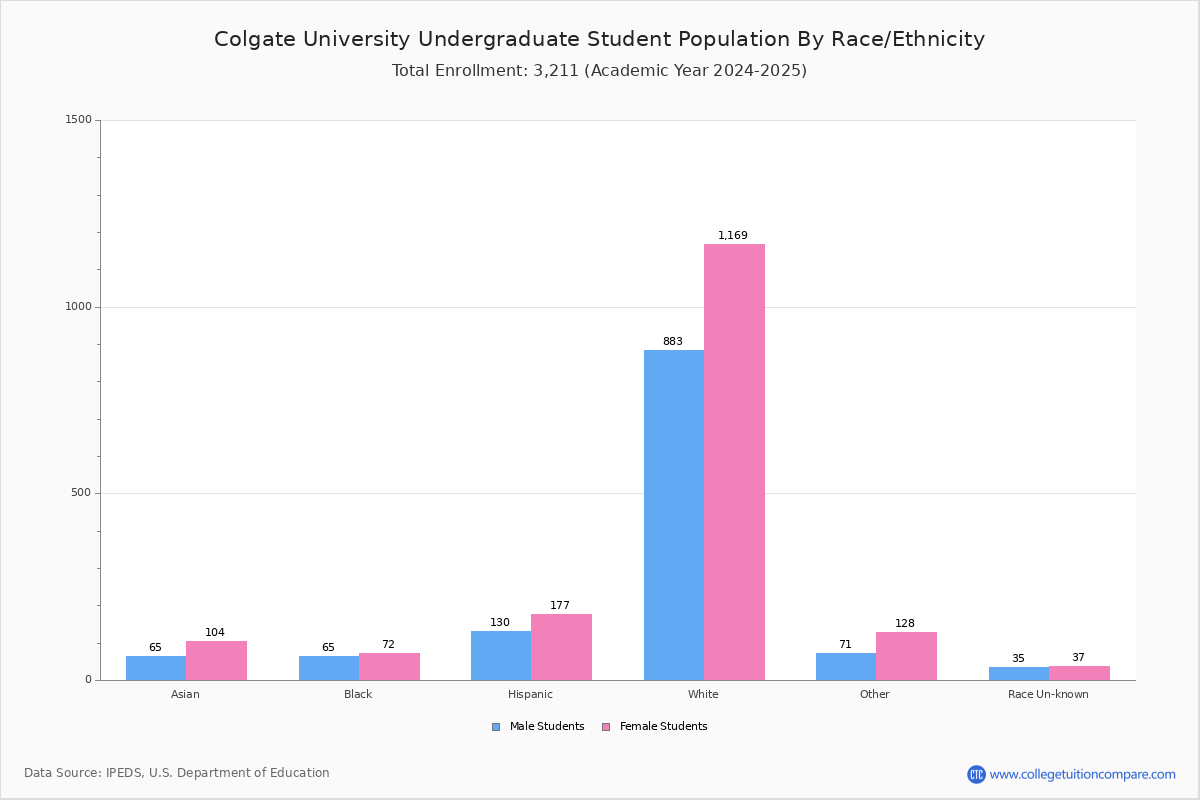
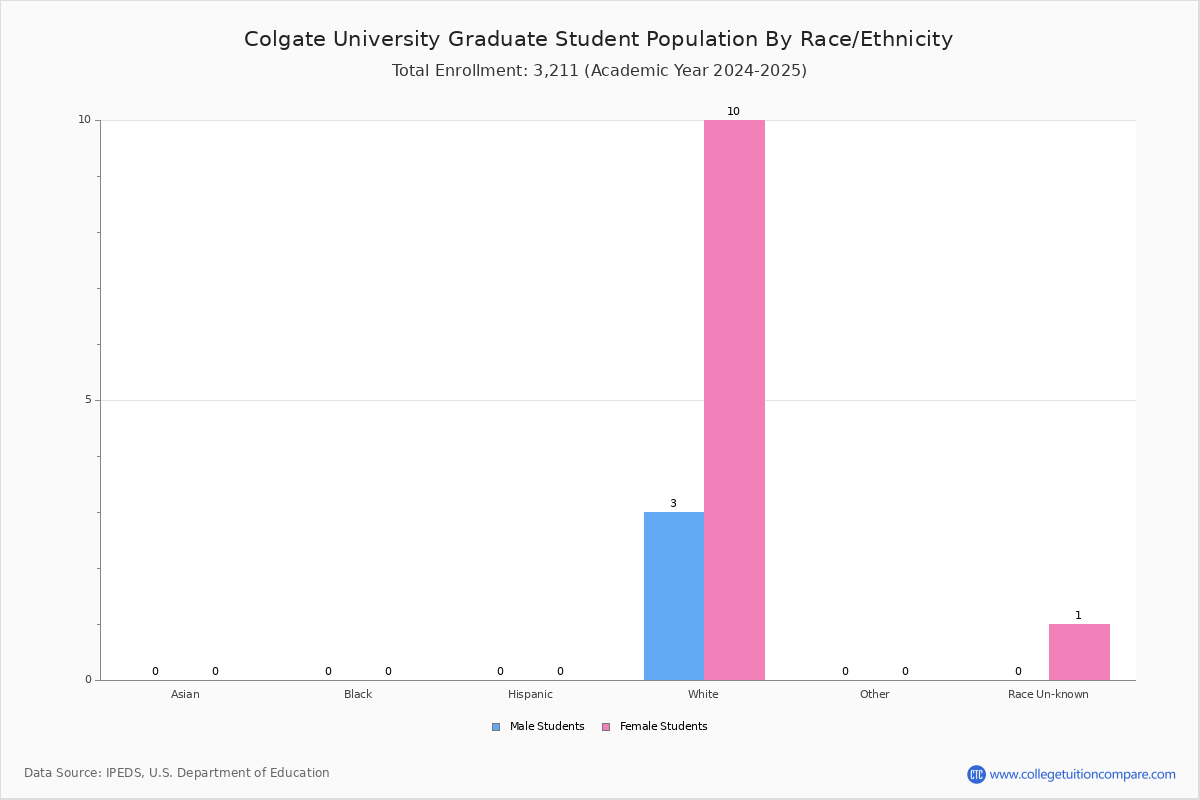
Student Distribution by Race/Ethnicity
By race/ethnicity, 2,022 White, 147 Black, and 181 Asian students out of a total of 3,141 are attending at Colgate University. Comprehensive enrollment statistic data by race/ethnicity is shown in the next chart (Academic year 2022-2023 data).
| Race | Total | Men | Women |
|---|---|---|---|
| American Indian or Native American | 3 | 0 | 3 |
| Asian | 181 | 72 | 109 |
| Black | 147 | 71 | 76 |
| Hispanic | 291 | 125 | 166 |
| Native Hawaiian or Other Pacific Islanders | 5 | 0 | 5 |
| White | 2,022 | 901 | 1,121 |
| Two or more races | 155 | 54 | 101 |
| Race Unknown | 58 | 24 | 34 |
| Race | Total | Men | Women |
|---|---|---|---|
| American Indian or Native American | 3 | 0 | 3 |
| Asian | 180 | 72 | 108 |
| Black | 146 | 70 | 76 |
| Hispanic | 291 | 125 | 166 |
| Native Hawaiian or Other Pacific Islanders | 5 | 0 | 5 |
| White | 2,013 | 900 | 1,113 |
| Two or more races | 155 | 54 | 101 |
| Race Unknown | 58 | 24 | 34 |
| Race | Total | Men | Women |
|---|---|---|---|
| American Indian or Native American | 0 | 0 | 0 |
| Asian | 0 | 0 | 0 |
| Black | 2 | 1 | 1 |
| Hispanic | 0 | 0 | 0 |
| Native Hawaiian or Other Pacific Islanders | 0 | 0 | 0 |
| White | 12 | 7 | 5 |
| Two or more races | 1 | 1 | 0 |
| Race Unknown | 0 | 0 | 0 |
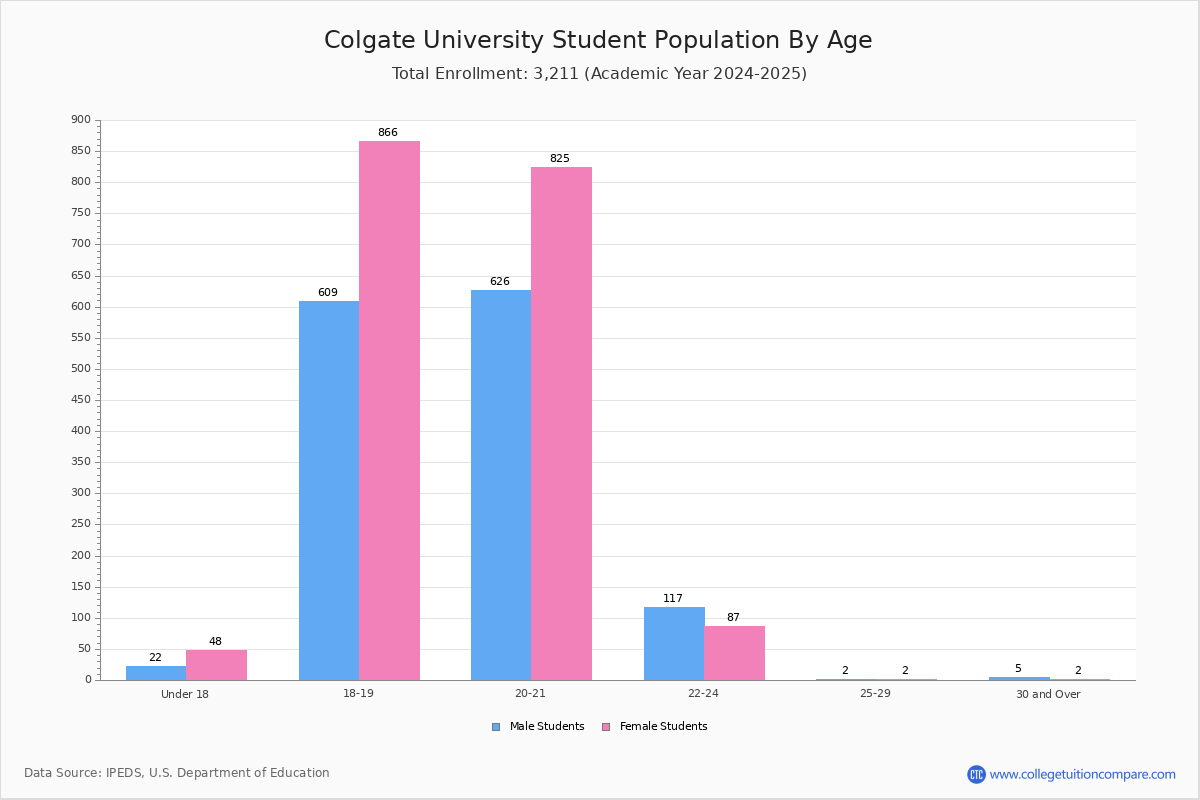
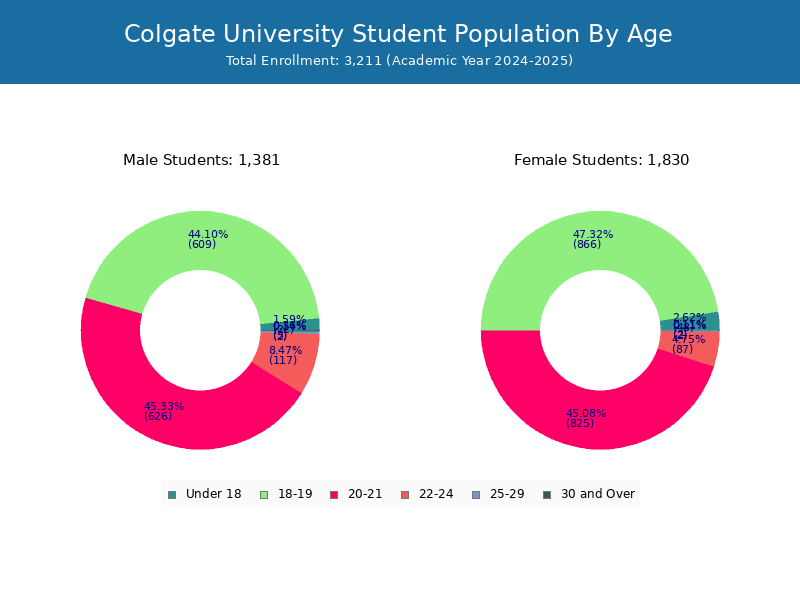
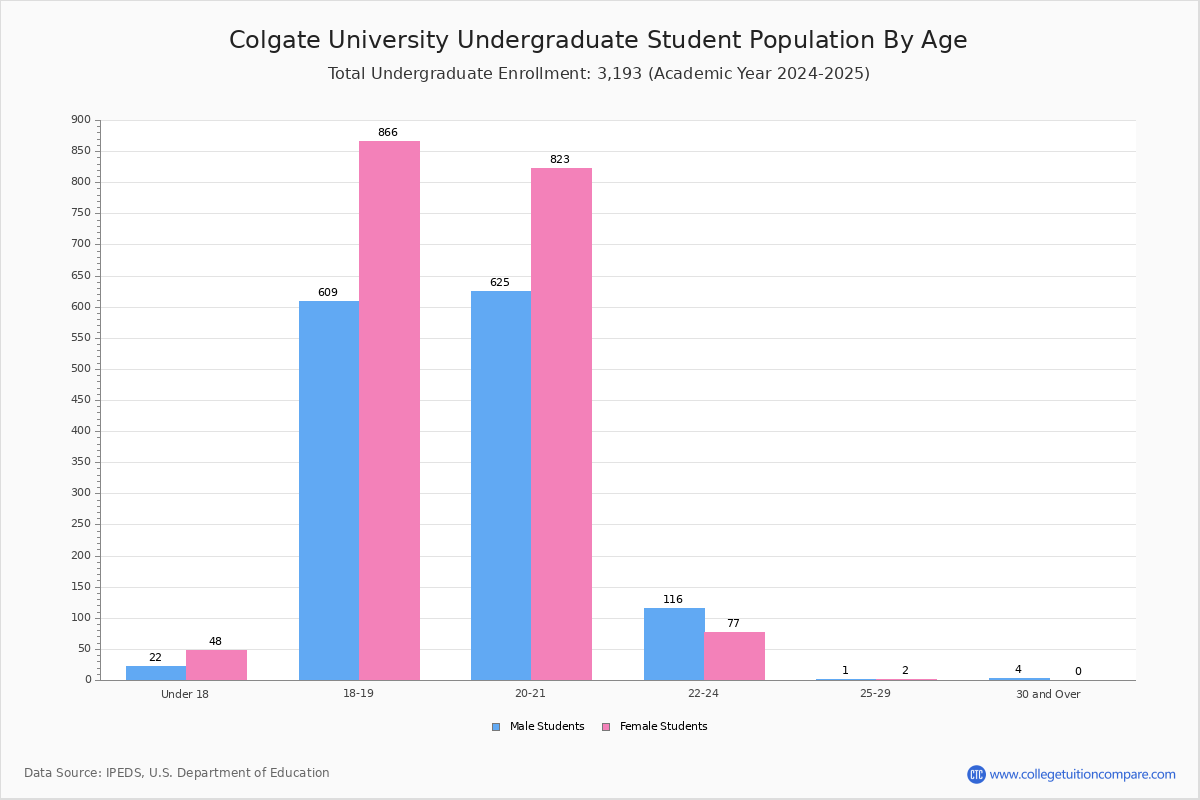
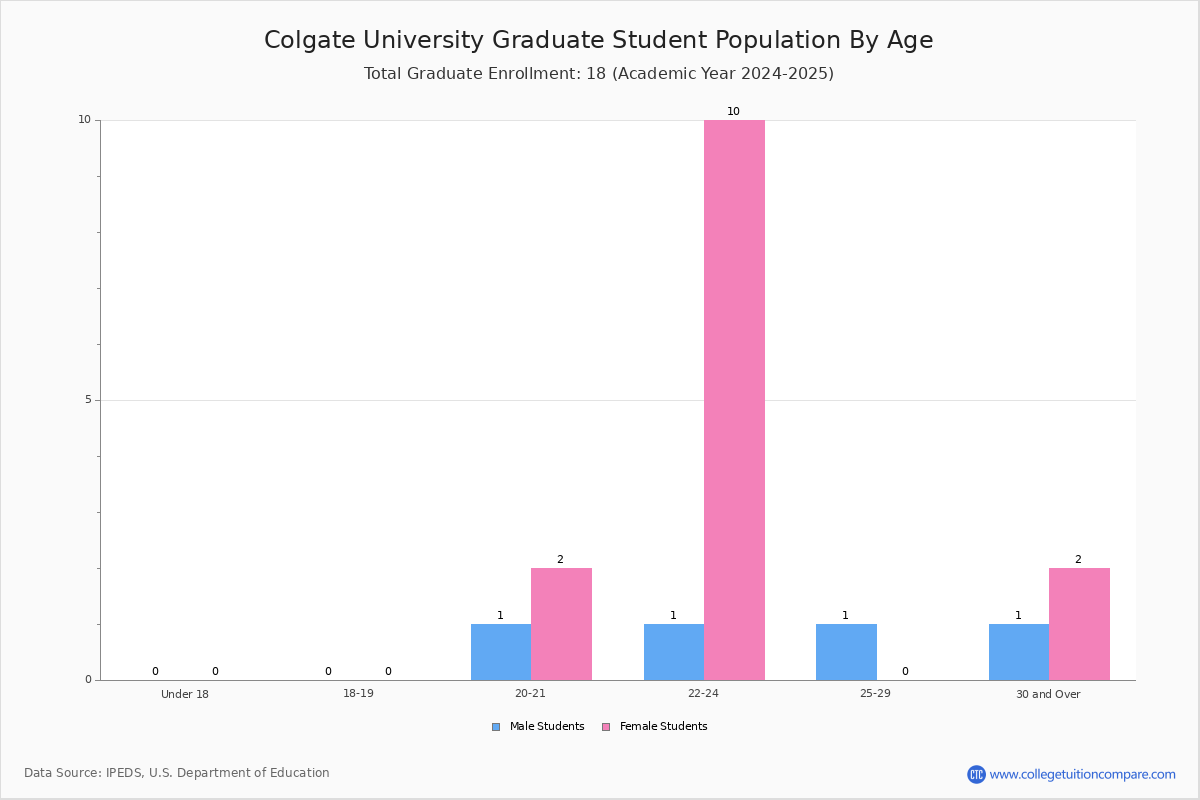
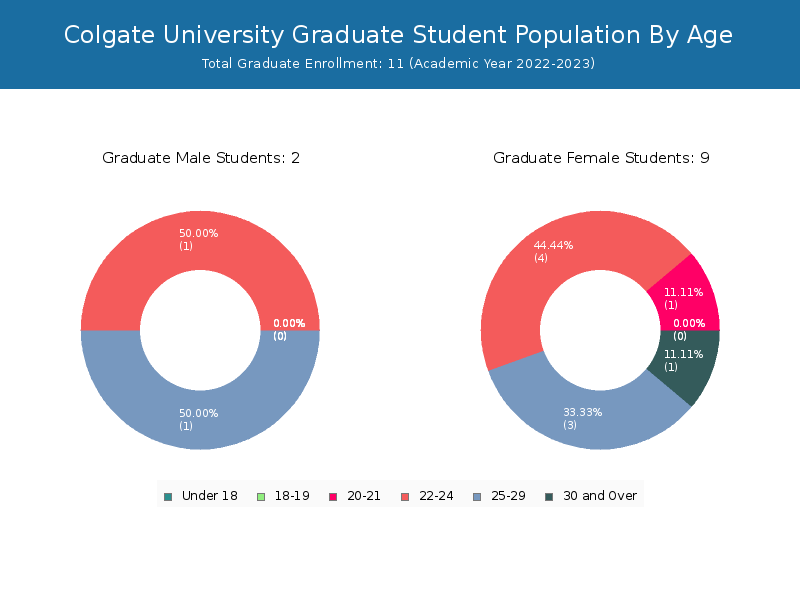
Student Age Distribution
There are 3,132 students under 25 years old, and 9 students over 25 years old out of 3,141 total students.
Colgate has 3,126 undergraduate students aged under 25 and 4 students aged 25 and over.
It has 6 graduate students aged under 25 and 5 students aged 25 and over.
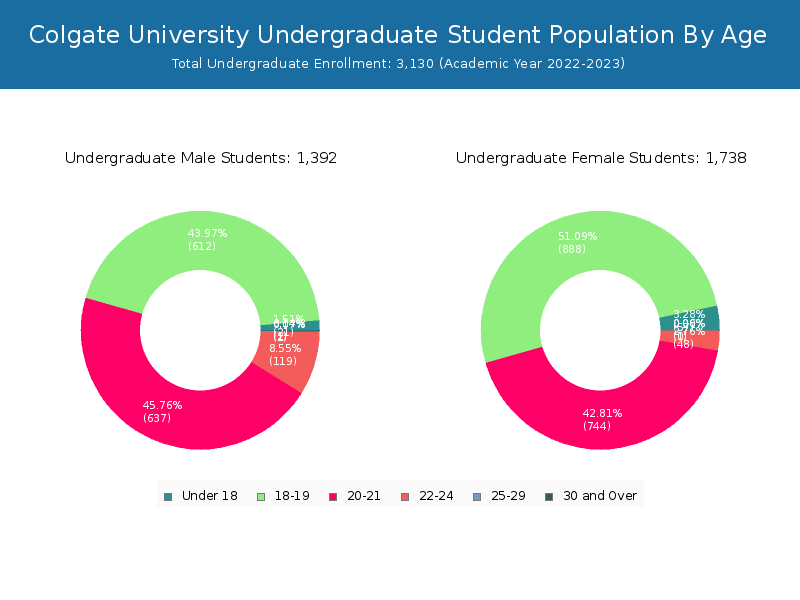
| Age | Total | Men | Women |
|---|---|---|---|
| Under 18 | 78 | 57 | 21 |
| 18-19 | 1,500 | 888 | 612 |
| 20-21 | 1,382 | 745 | 637 |
| 22-24 | 172 | 52 | 120 |
| 25-29 | 6 | 4 | 2 |
| Age | Total | Men | Women |
|---|---|---|---|
| Under 18 | 78 | 57 | 21 |
| 18-19 | 1,500 | 888 | 612 |
| 20-21 | 1,381 | 744 | 637 |
| 22-24 | 167 | 48 | 119 |
| 25-29 | 2 | 1 | 1 |
| Age | Total | Men | Women |
|---|
Transfer-in Students (Undergraduate)
Among 3,130 enrolled in undergraduate programs, 17 students have transferred-in from other institutions. The percentage of transfer-in students is 0.54%.
| Number of Students | |
|---|---|
| Regular Full-time | 3,095 |
| Transfer-in Full-time | 17 |