Student Population by Gender
Bard College has a total of 2,706 enrolled students for the academic year 2022-2023. 2,296 students have enrolled in undergraduate programs and 410 students joined graduate programs.
By gender, 1,136 male and 1,570 female students (the male-female ratio is 42:58) are attending the school. The gender distribution is based on the 2022-2023 data.
| Total | Undergraduate | Graduate | |
|---|---|---|---|
| Total | 2,706 | 2,296 | 410 |
| Men | 1,136 | 980 | 156 |
| Women | 1,570 | 1,316 | 254 |
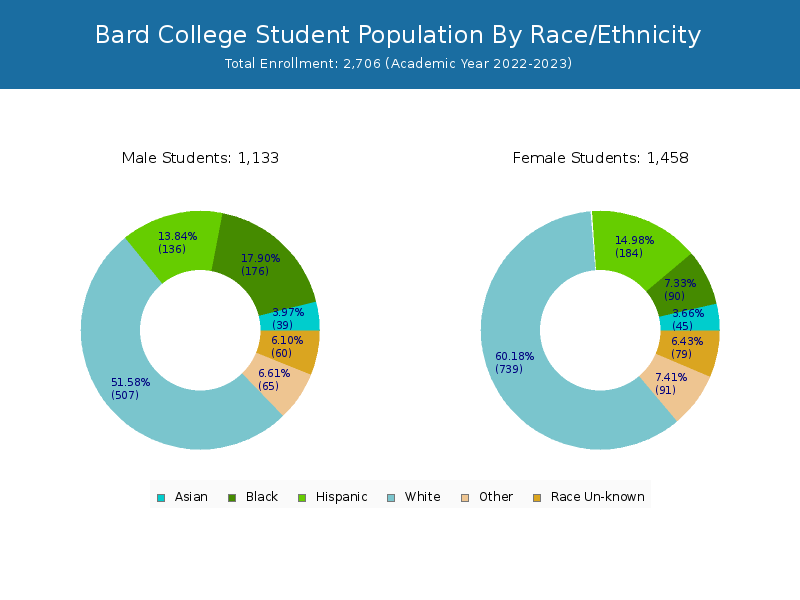
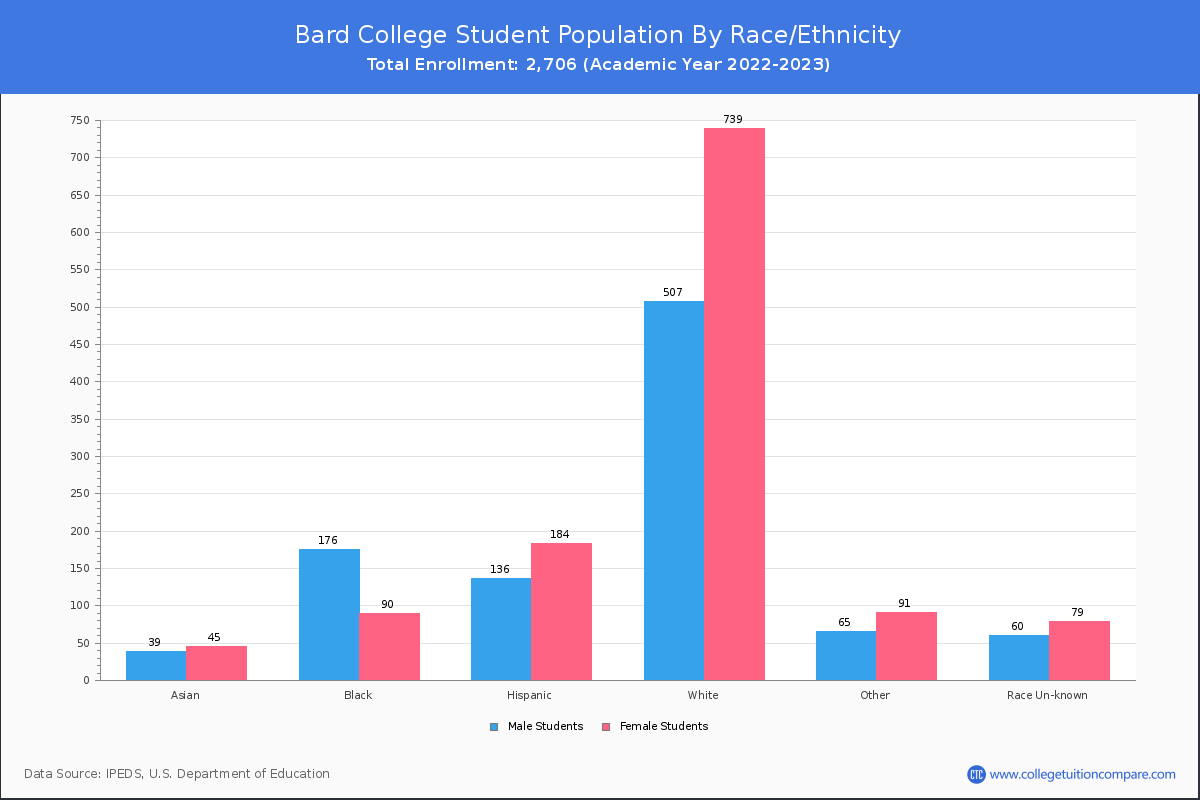
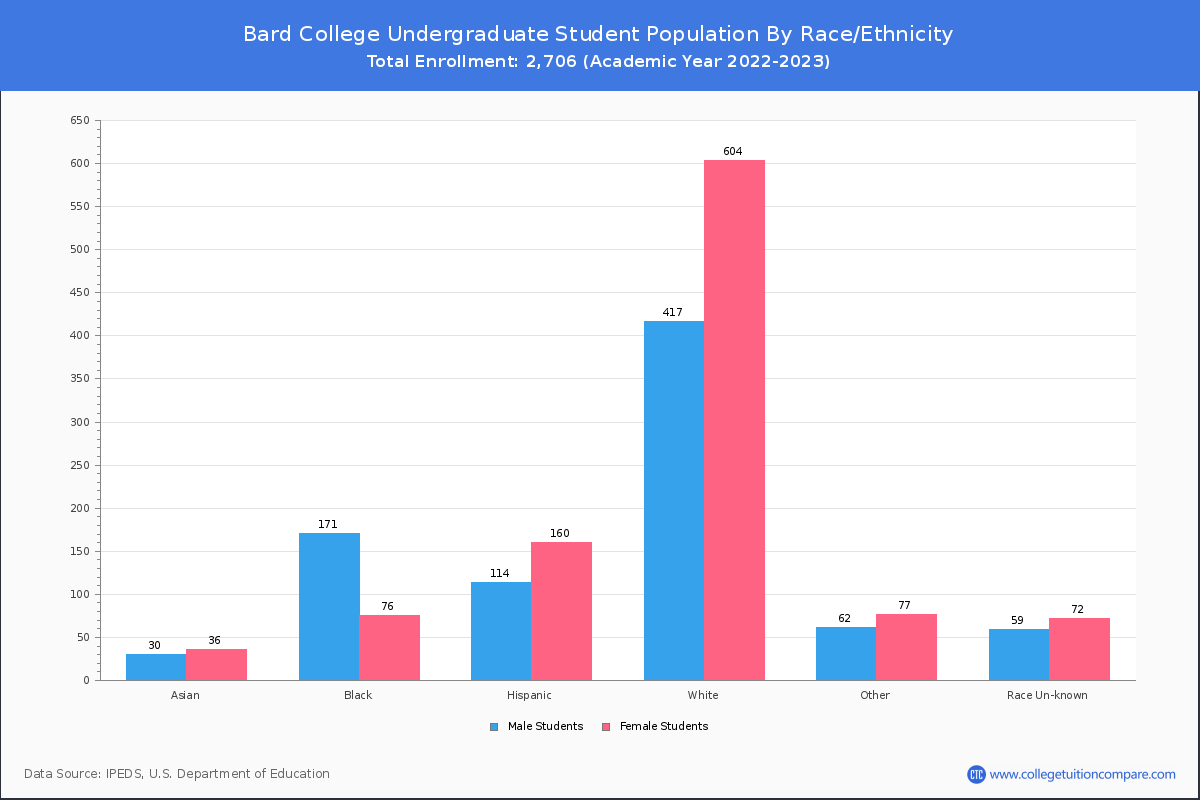
Student Distribution by Race/Ethnicity
By race/ethnicity, 1,230 White, 295 Black, and 89 Asian students out of a total of 2,706 are attending at Bard College. Comprehensive enrollment statistic data by race/ethnicity is shown in the next chart (Academic year 2022-2023 data).
| Race | Total | Men | Women |
|---|---|---|---|
| American Indian or Native American | 2 | 1 | 1 |
| Asian | 89 | 37 | 52 |
| Black | 295 | 195 | 100 |
| Hispanic | 317 | 132 | 185 |
| Native Hawaiian or Other Pacific Islanders | 0 | 0 | 0 |
| White | 1,230 | 452 | 778 |
| Two or more races | 177 | 78 | 99 |
| Race Unknown | 148 | 68 | 80 |
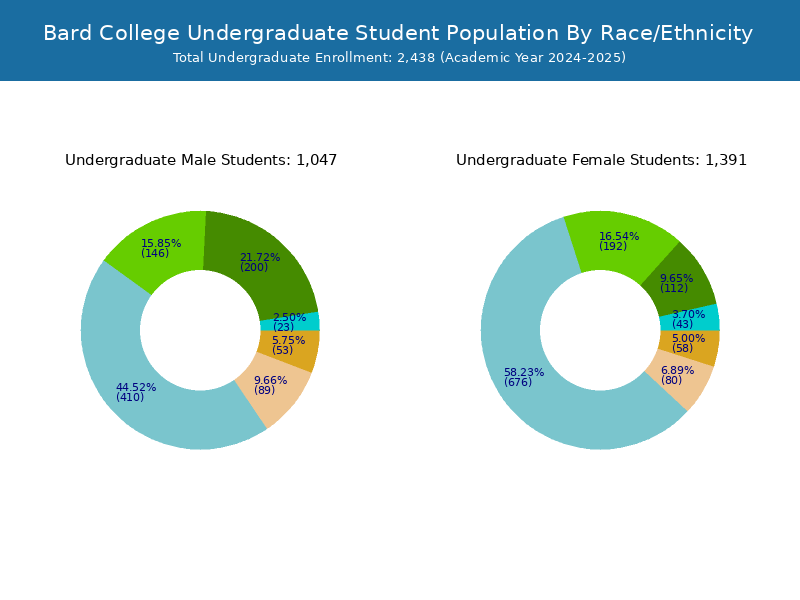
| Race | Total | Men | Women |
|---|---|---|---|
| American Indian or Native American | 2 | 1 | 1 |
| Asian | 68 | 25 | 43 |
| Black | 278 | 190 | 88 |
| Hispanic | 280 | 117 | 163 |
| Native Hawaiian or Other Pacific Islanders | 0 | 0 | 0 |
| White | 1,039 | 381 | 658 |
| Two or more races | 158 | 74 | 84 |
| Race Unknown | 140 | 66 | 74 |
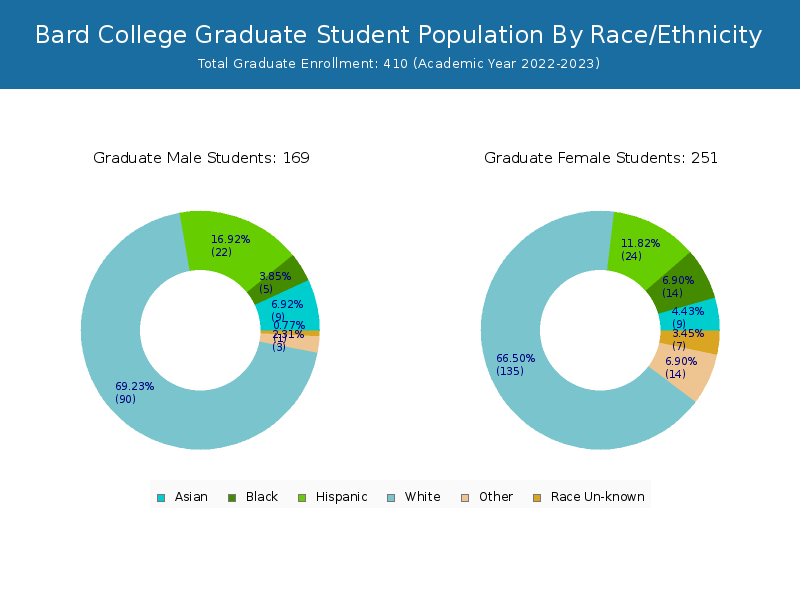
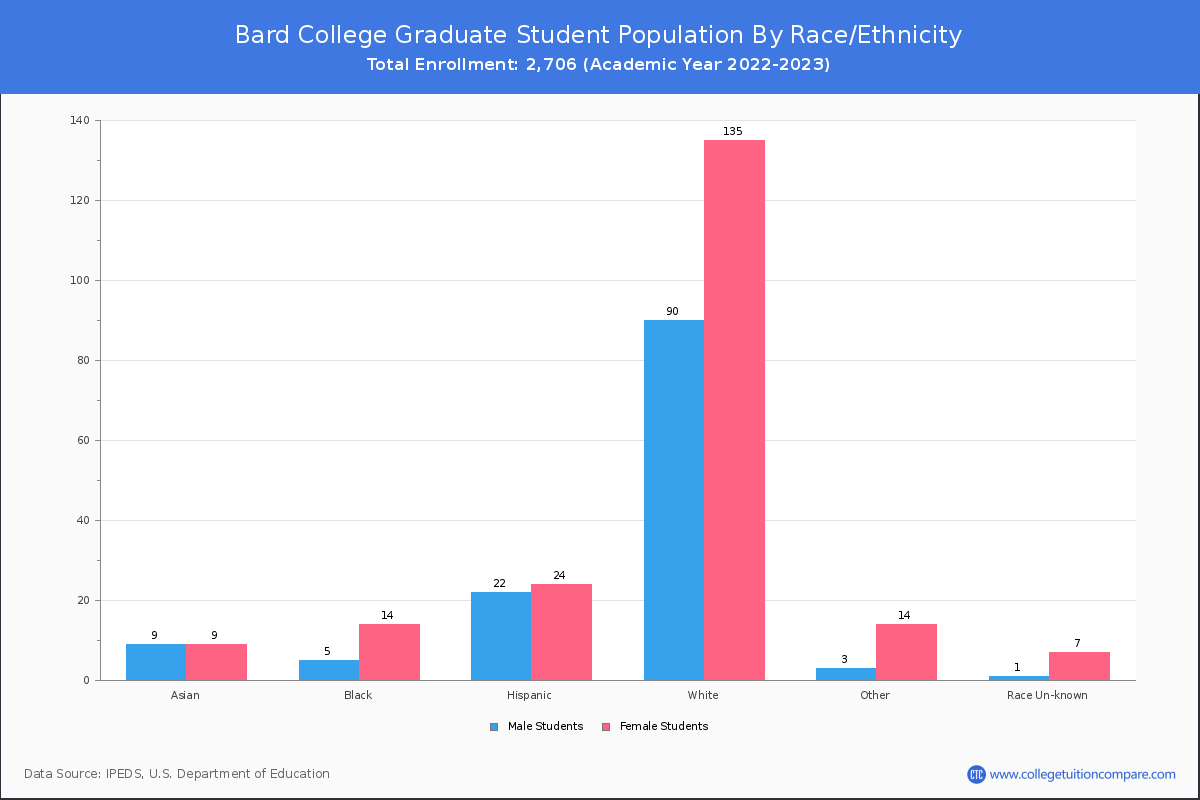
| Race | Total | Men | Women |
|---|---|---|---|
| American Indian or Native American | 0 | 0 | 0 |
| Asian | 1 | 0 | 1 |
| Black | 7 | 4 | 3 |
| Hispanic | 12 | 5 | 7 |
| Native Hawaiian or Other Pacific Islanders | 0 | 0 | 0 |
| White | 28 | 7 | 21 |
| Two or more races | 7 | 3 | 4 |
| Race Unknown | 2 | 2 | 0 |
Transfer-in Students (Undergraduate)
Among 2,296 enrolled in undergraduate programs, 81 students have transferred-in from other institutions. The percentage of transfer-in students is 3.53%.79 students have transferred in as full-time status and 2 students transferred in as part-time status.
| Number of Students | |
|---|---|
| Regular Full-time | 2,022 |
| Transfer-in Full-time | 79 |
| Regular Part-time | 193 |
| Transfer-in Part-time | 2 |