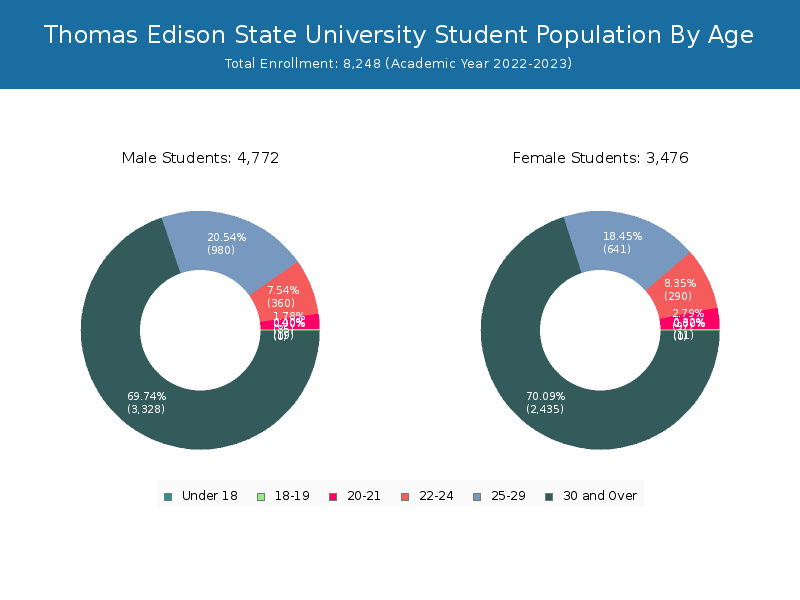
Student Population by Gender
Thomas Edison State University has a total of 8,248 enrolled students for the academic year 2022-2023. 7,358 students have enrolled in undergraduate programs and 890 students joined graduate programs.
By gender, 4,772 male and 3,476 female students (the male-female ratio is 58:42) are attending the school. The gender distribution is based on the 2022-2023 data.
| Total | Undergraduate | Graduate | |
|---|---|---|---|
| Total | 8,248 | 7,358 | 890 |
| Men | 4,772 | 4,390 | 382 |
| Women | 3,476 | 2,968 | 508 |
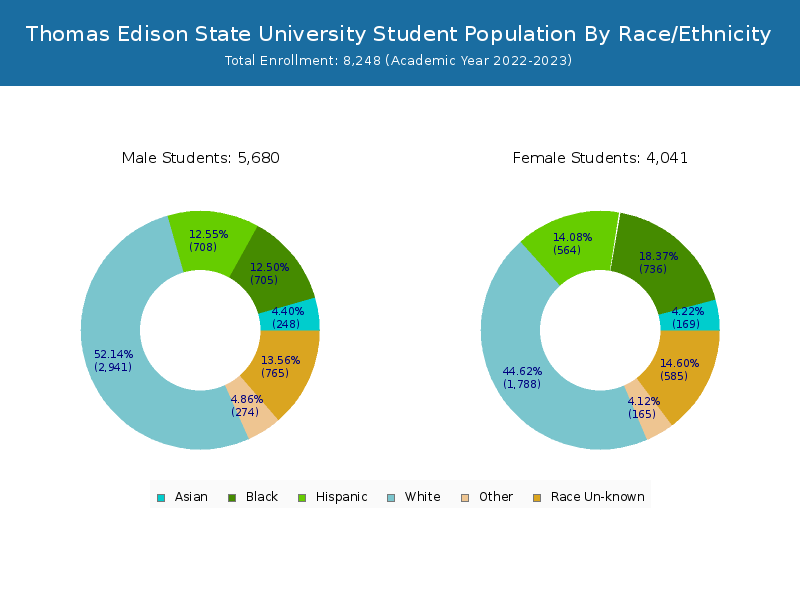
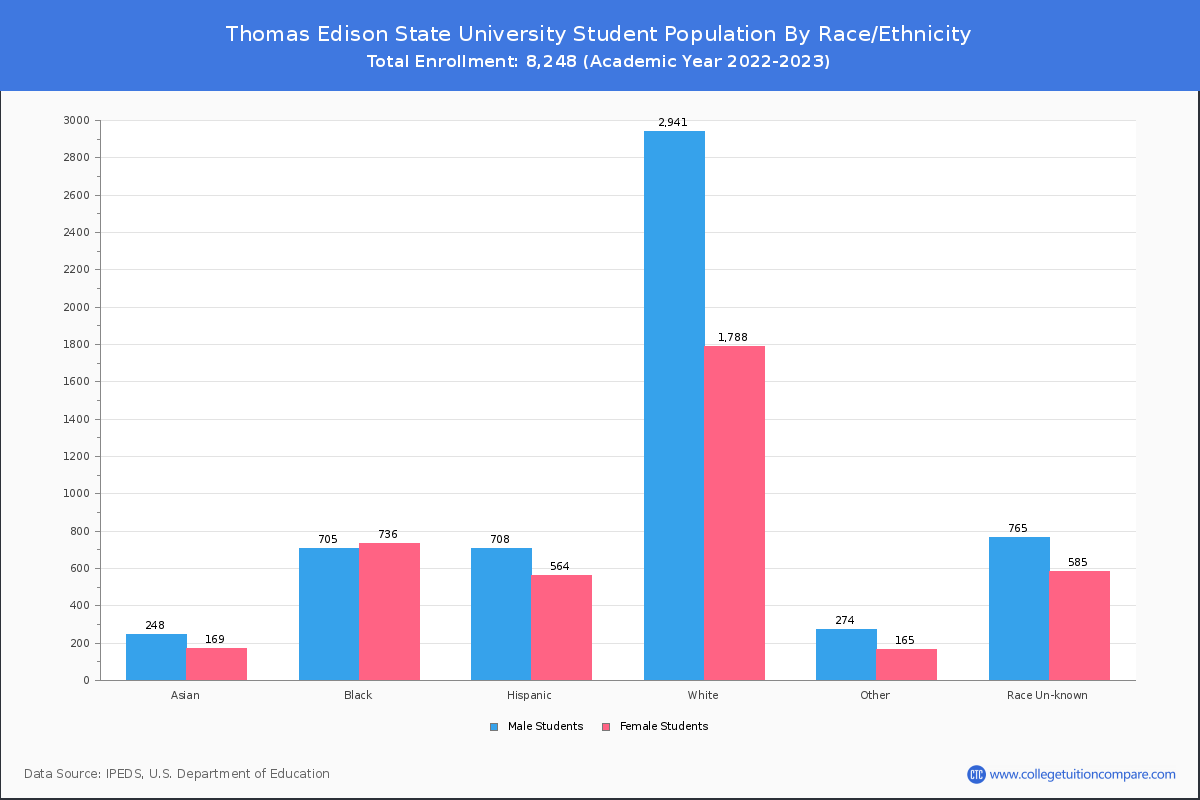
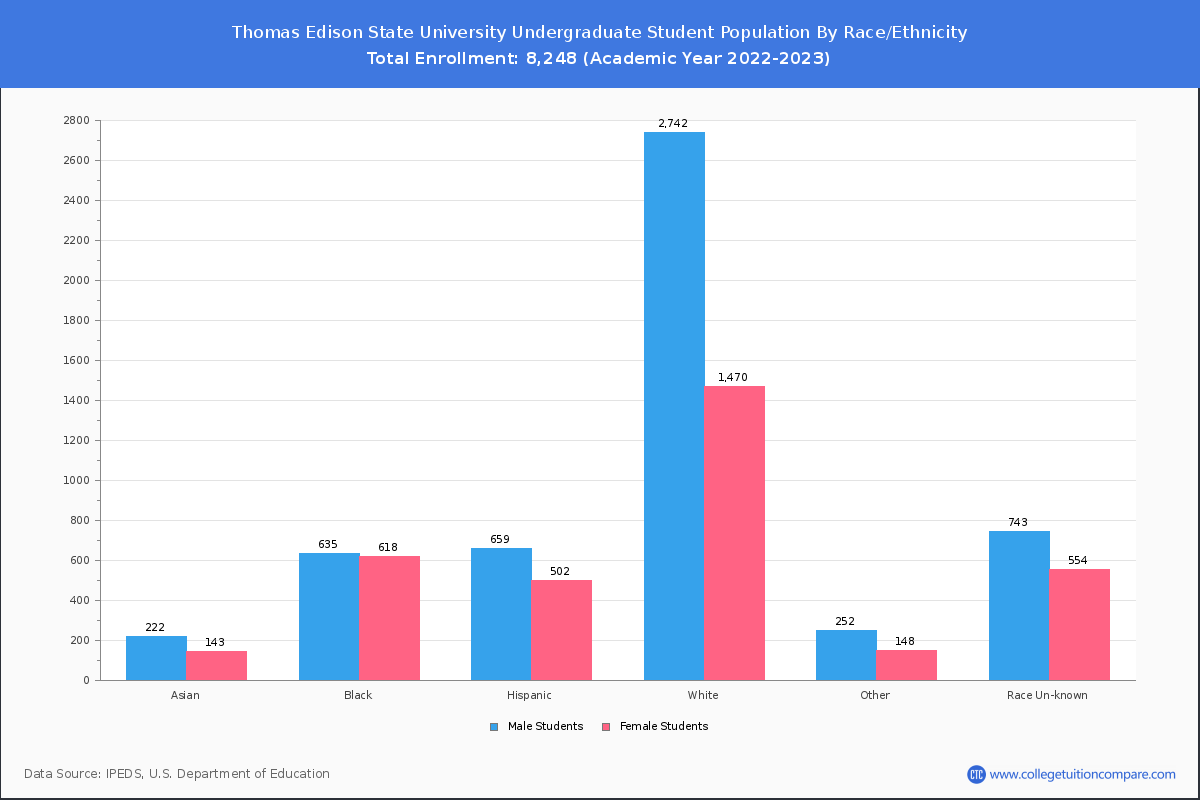
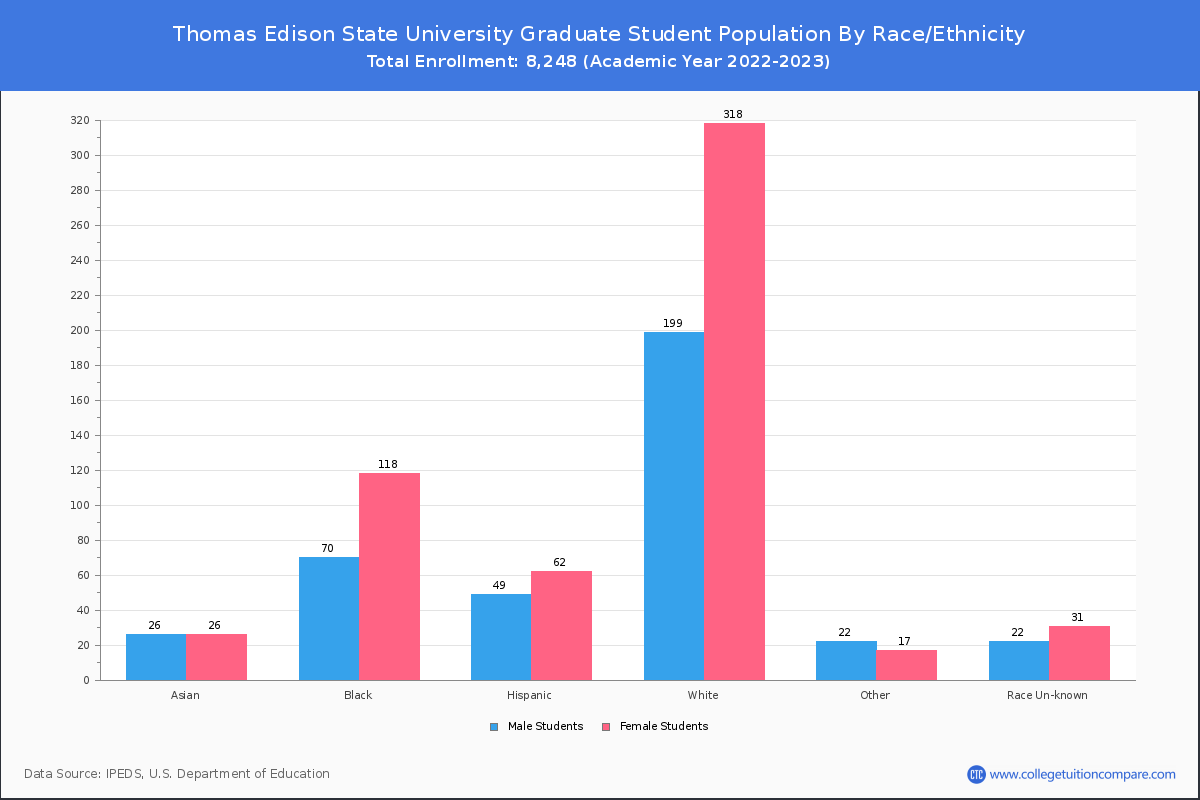
Student Distribution by Race/Ethnicity
By race/ethnicity, 3,838 White, 1,302 Black, and 379 Asian students out of a total of 8,248 are attending at Thomas Edison State University. Comprehensive enrollment statistic data by race/ethnicity is shown in the next chart (Academic year 2022-2023 data).
| Race | Total | Men | Women |
|---|---|---|---|
| American Indian or Native American | 27 | 17 | 10 |
| Asian | 379 | 228 | 151 |
| Black | 1,302 | 638 | 664 |
| Hispanic | 1,151 | 634 | 517 |
| Native Hawaiian or Other Pacific Islanders | 37 | 23 | 14 |
| White | 3,838 | 2,358 | 1,480 |
| Two or more races | 297 | 189 | 108 |
| Race Unknown | 1,149 | 646 | 503 |
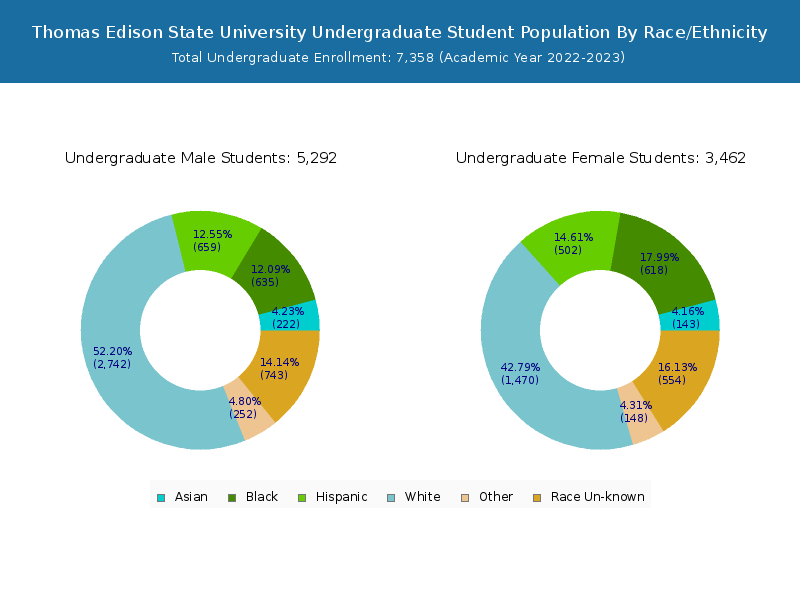
| Race | Total | Men | Women |
|---|---|---|---|
| American Indian or Native American | 26 | 16 | 10 |
| Asian | 326 | 202 | 124 |
| Black | 1,123 | 558 | 565 |
| Hispanic | 1,053 | 584 | 469 |
| Native Hawaiian or Other Pacific Islanders | 34 | 22 | 12 |
| White | 3,353 | 2,162 | 1,191 |
| Two or more races | 276 | 178 | 98 |
| Race Unknown | 1,107 | 630 | 477 |
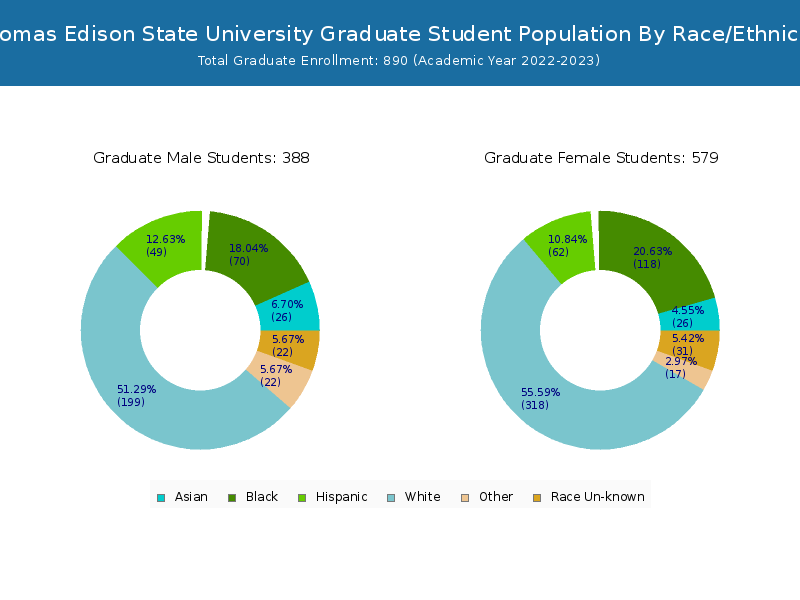
| Race | Total | Men | Women |
|---|---|---|---|
| American Indian or Native American | 6 | 5 | 1 |
| Asian | 87 | 58 | 29 |
| Black | 310 | 158 | 152 |
| Hispanic | 288 | 162 | 126 |
| Native Hawaiian or Other Pacific Islanders | 8 | 5 | 3 |
| White | 792 | 499 | 293 |
| Two or more races | 93 | 60 | 33 |
| Race Unknown | 261 | 157 | 104 |
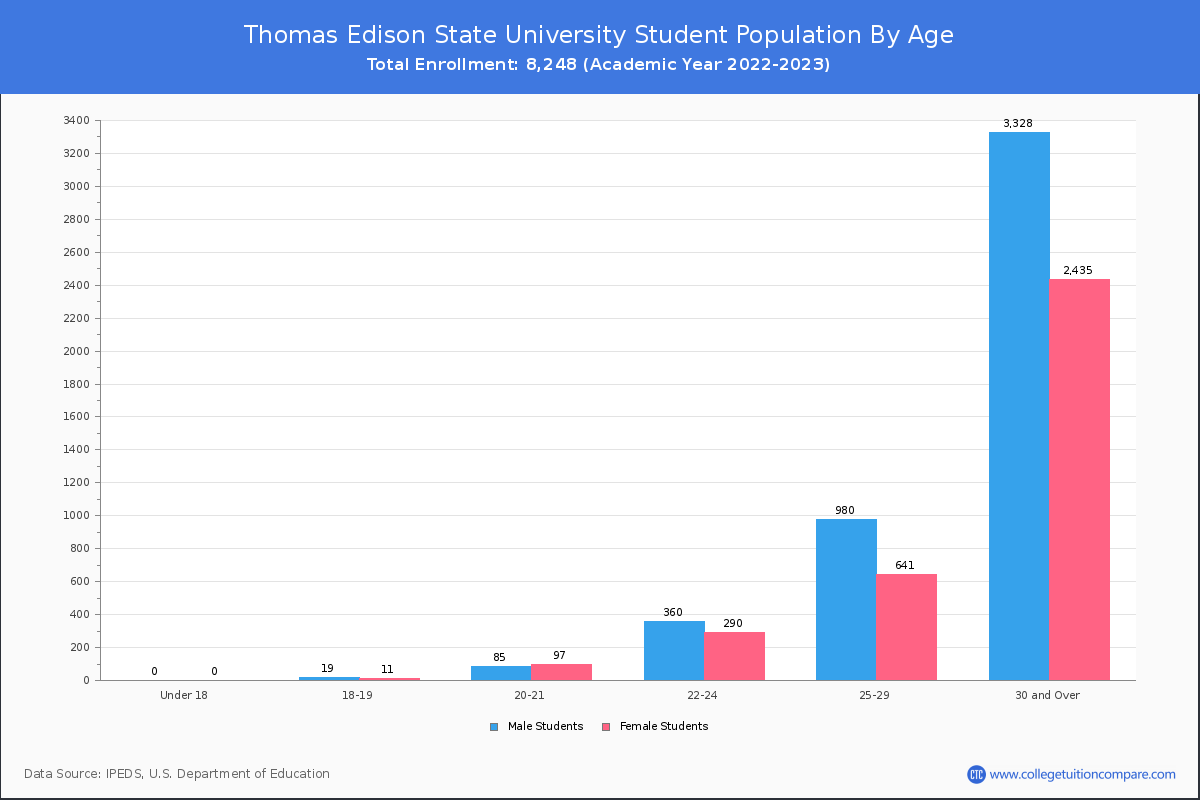
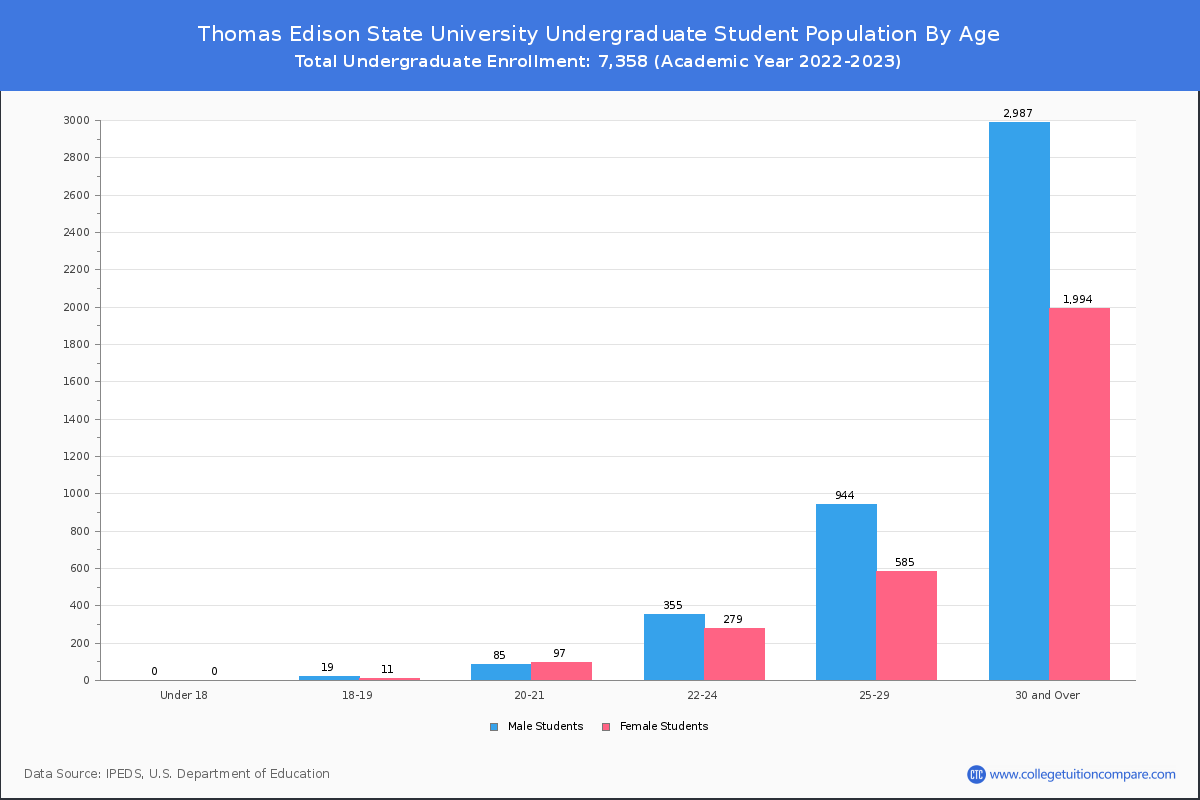
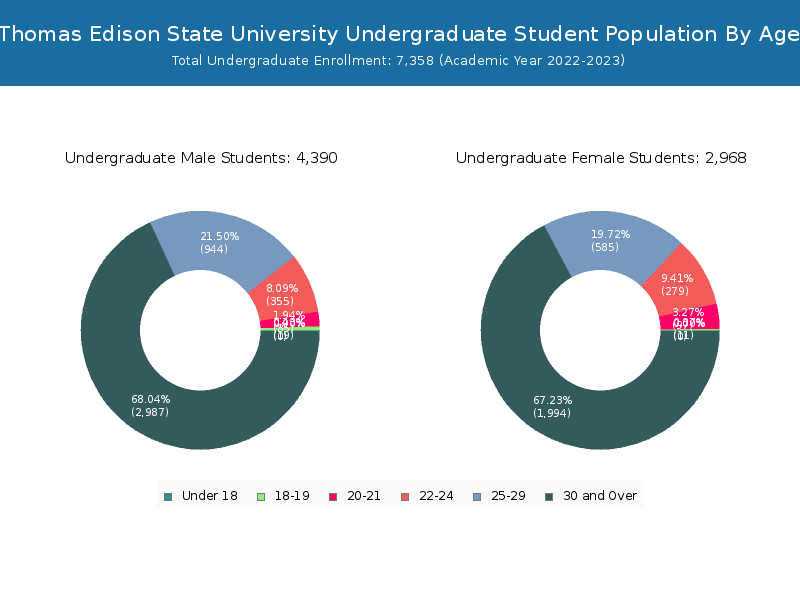
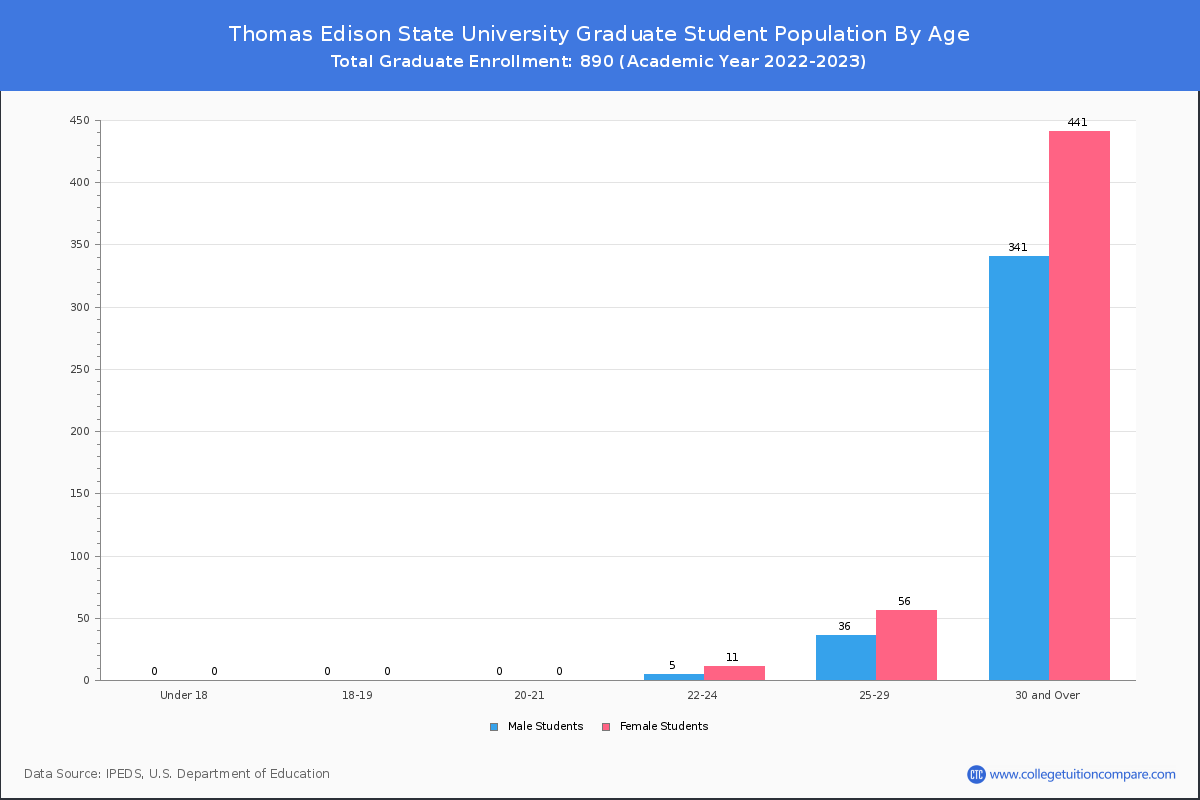
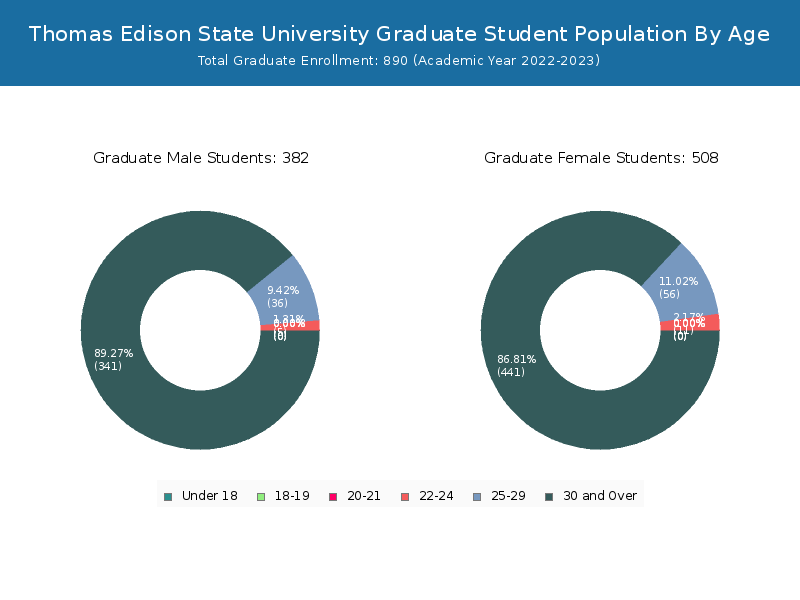
Student Age Distribution
There are 862 students under 25 years old, and 7,384 students over 25 years old out of 8,248 total students.
TESU has 846 undergraduate students aged under 25 and 6,510 students aged 25 and over.
It has 16 graduate students aged under 25 and 874 students aged 25 and over.
| Age | Total | Men | Women |
|---|
| Age | Total | Men | Women |
|---|
| Age | Total | Men | Women |
|---|
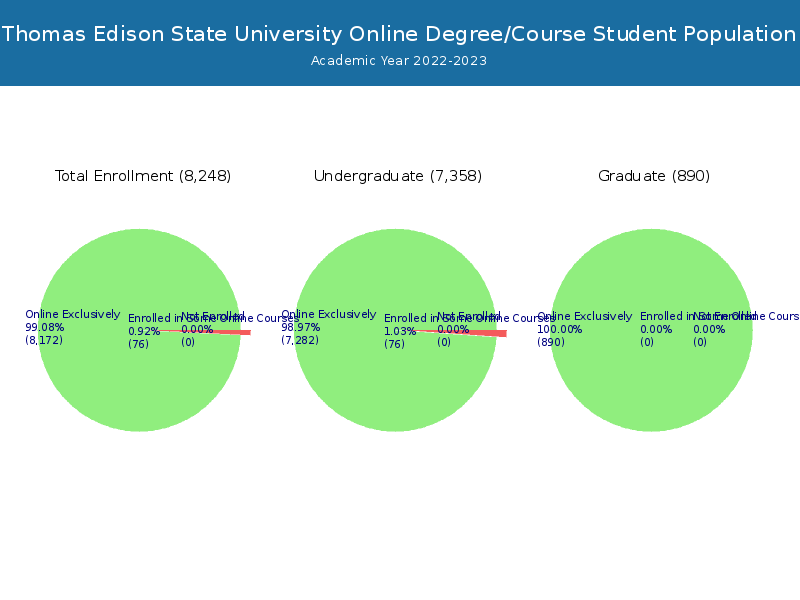
Online Student Enrollment
Distance learning, also called online education, is very attractive to students, especially who want to continue education and work in field. At Thomas Edison State University, 8,172 students are enrolled exclusively in online courses and 76 students are enrolled in some online courses.
3,139 students lived in New Jersey or jurisdiction in which the school is located are enrolled exclusively in online courses and 5,033 students live in other State or outside of the United States.
| All Students | Enrolled Exclusively Online Courses | Enrolled in Some Online Courses | |
|---|---|---|---|
| All Students | 8,248 | 8,172 | 76 |
| Undergraduate | 7,358 | 7,282 | 76 |
| Graduate | 890 | 890 | 0 |
| New Jersey Residents | Other States in U.S. | Outside of U.S. | |
|---|---|---|---|
| All Students | 3,139 | 4,955 | 78 |
| Undergraduate | 2,547 | 4,663 | 72 |
| Graduate | 592 | 292 | 6 |
Transfer-in Students (Undergraduate)
Among 7,358 enrolled in undergraduate programs, 1,863 students have transferred-in from other institutions. The percentage of transfer-in students is 25.32%.16 students have transferred in as full-time status and 1,847 students transferred in as part-time status.
| Number of Students | |
|---|---|
| Regular Full-time | 60 |
| Transfer-in Full-time | 16 |
| Regular Part-time | 5,435 |
| Transfer-in Part-time | 1,847 |