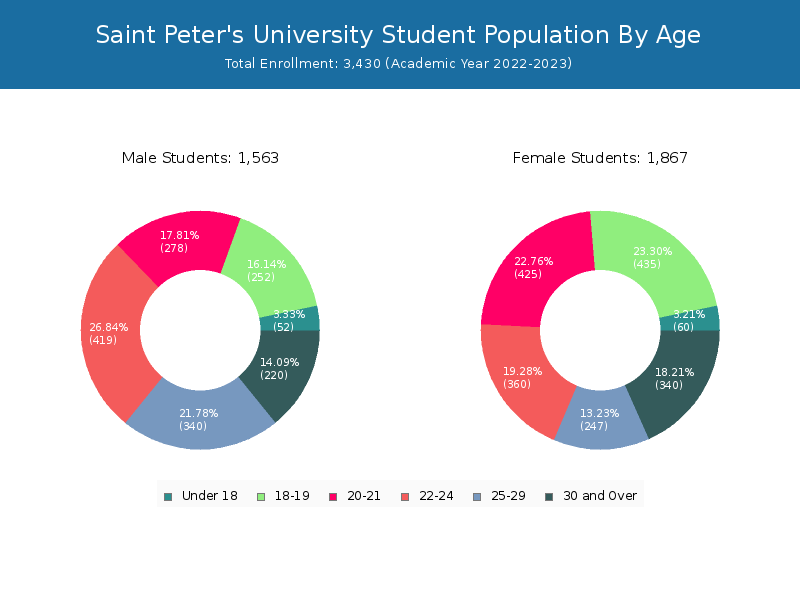
Student Population by Gender
Saint Peter's University has a total of 3,430 enrolled students for the academic year 2022-2023. 2,071 students have enrolled in undergraduate programs and 1,359 students joined graduate programs.
By gender, 1,563 male and 1,867 female students (the male-female ratio is 46:54) are attending the school. The gender distribution is based on the 2022-2023 data.
| Total | Undergraduate | Graduate | |
|---|---|---|---|
| Total | 3,430 | 2,071 | 1,359 |
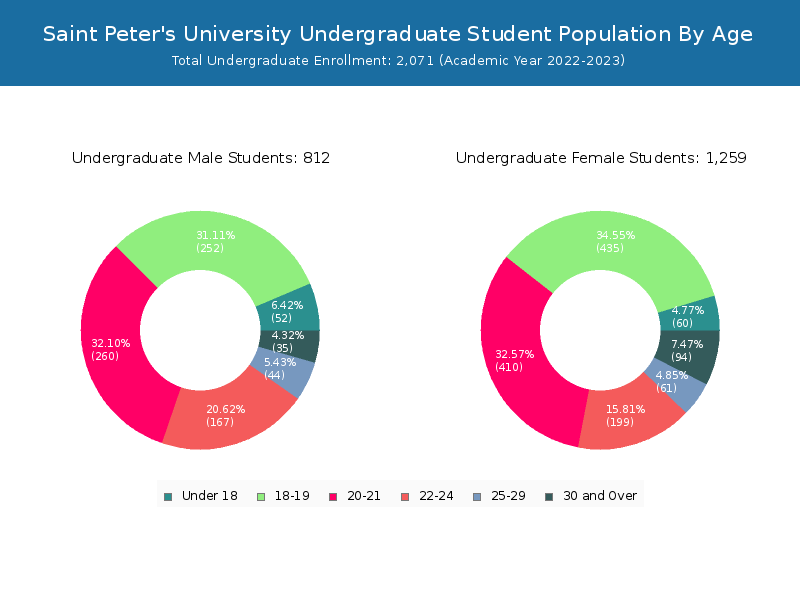
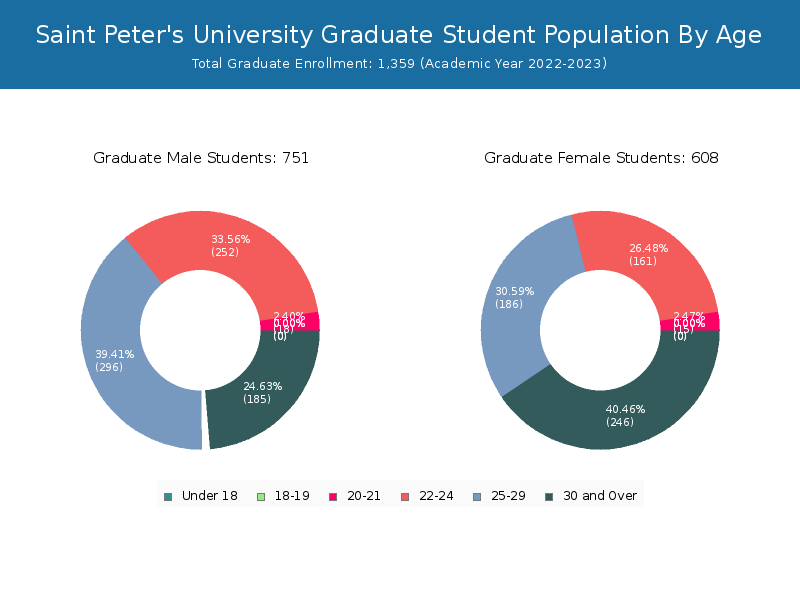
| Men | 1,563 | 812 | 751 |
| Women | 1,867 | 1,259 | 608 |
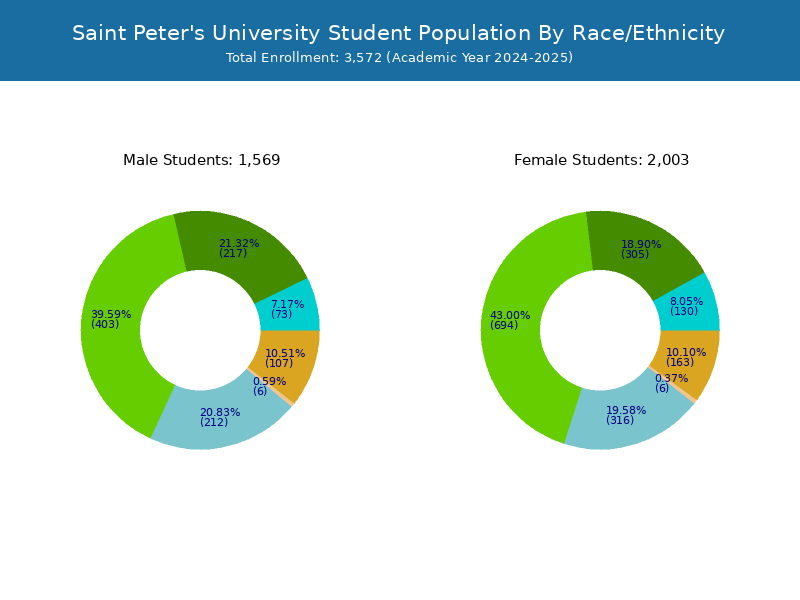
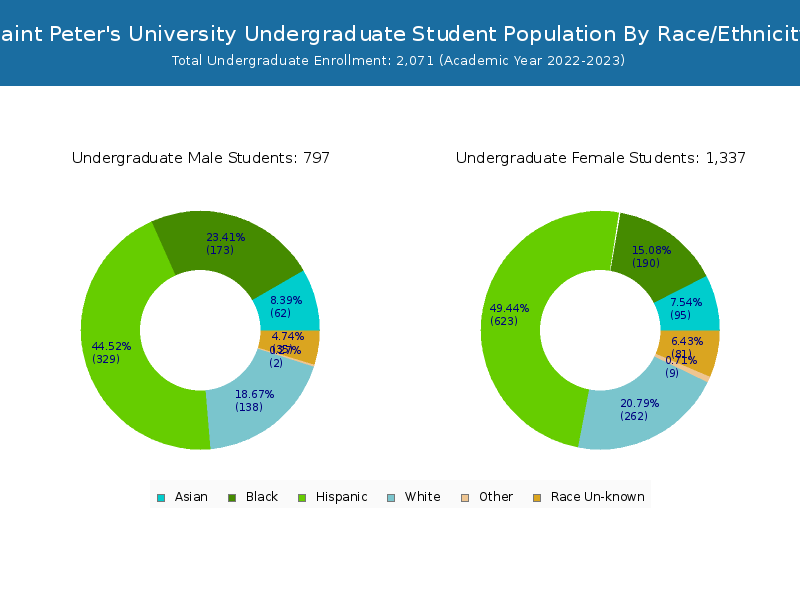
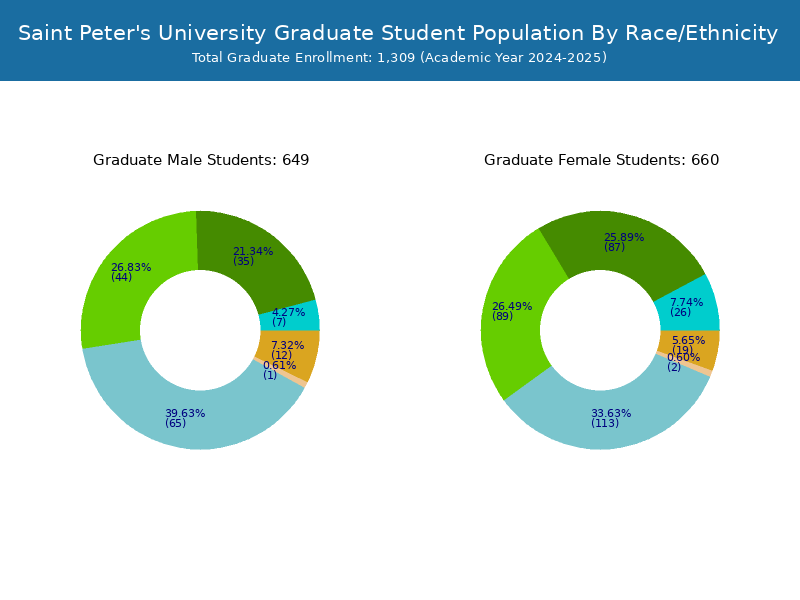
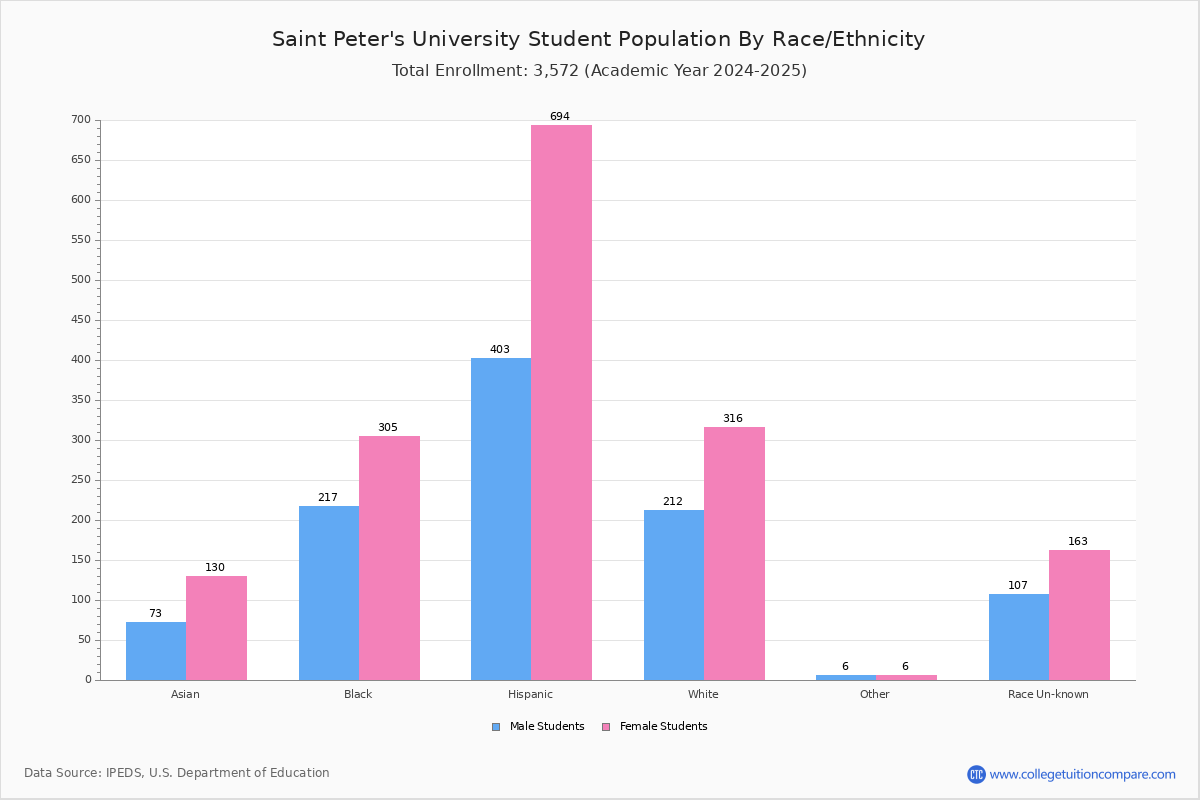
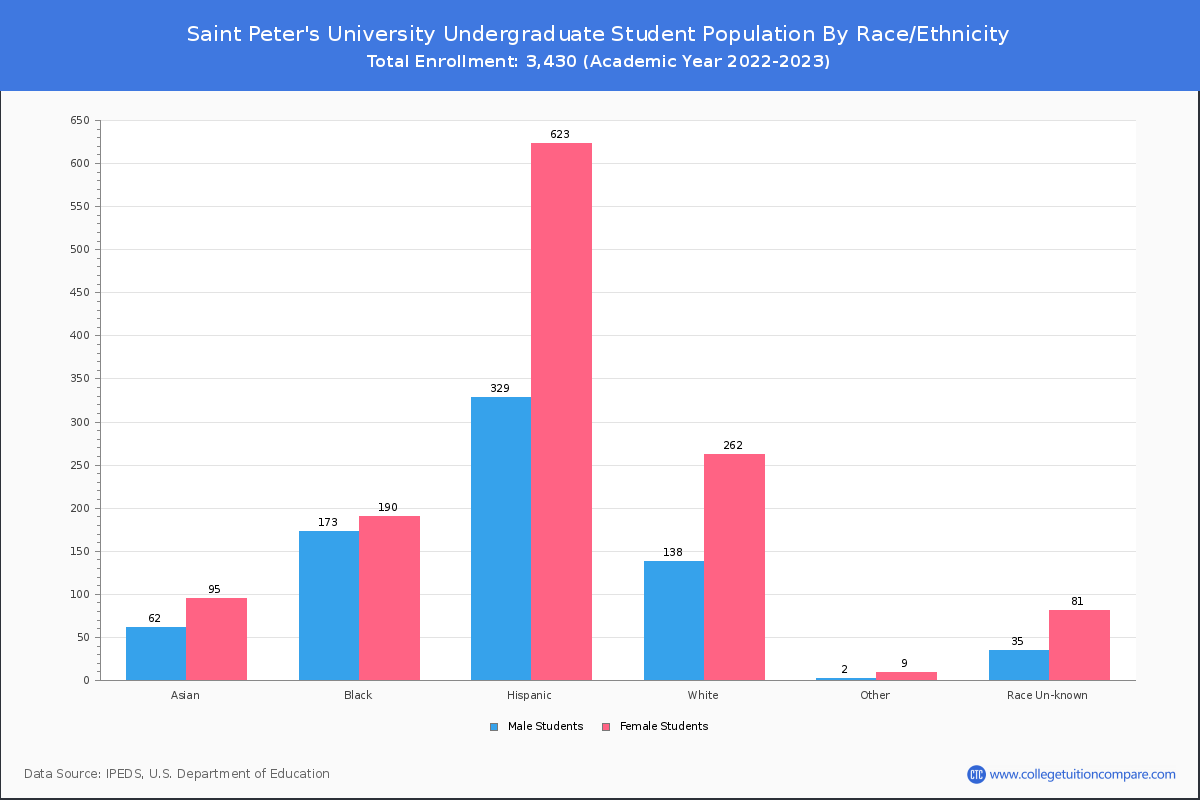
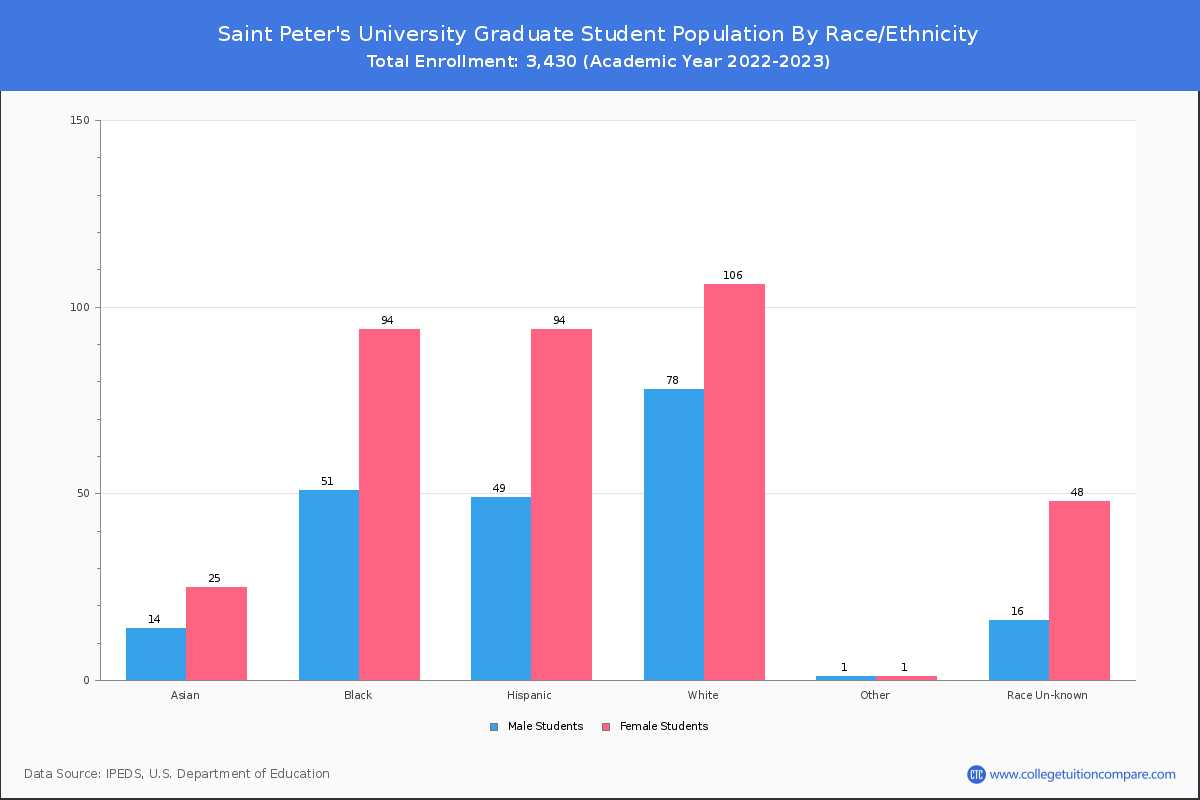
Student Distribution by Race/Ethnicity
By race/ethnicity, 654 White, 487 Black, and 217 Asian students out of a total of 3,430 are attending at Saint Peter's University. Comprehensive enrollment statistic data by race/ethnicity is shown in the next chart (Academic year 2022-2023 data).
| Race | Total | Men | Women |
|---|---|---|---|
| American Indian or Native American | 5 | 2 | 3 |
| Asian | 217 | 92 | 125 |
| Black | 487 | 205 | 282 |
| Hispanic | 979 | 371 | 608 |
| Native Hawaiian or Other Pacific Islanders | 4 | 3 | 1 |
| White | 654 | 229 | 425 |
| Two or more races | 6 | 0 | 6 |
| Race Unknown | 148 | 57 | 91 |
| Race | Total | Men | Women |
|---|---|---|---|
| American Indian or Native American | 3 | 1 | 2 |
| Asian | 171 | 74 | 97 |
| Black | 363 | 164 | 199 |
| Hispanic | 845 | 322 | 523 |
| Native Hawaiian or Other Pacific Islanders | 4 | 3 | 1 |
| White | 471 | 152 | 319 |
| Two or more races | 4 | 0 | 4 |
| Race Unknown | 102 | 44 | 58 |
| Race | Total | Men | Women |
|---|---|---|---|
| American Indian or Native American | 0 | 0 | 0 |
| Asian | 10 | 3 | 7 |
| Black | 16 | 5 | 11 |
| Hispanic | 36 | 19 | 17 |
| Native Hawaiian or Other Pacific Islanders | 1 | 0 | 1 |
| White | 148 | 31 | 117 |
| Two or more races | 0 | 0 | 0 |
| Race Unknown | 6 | 2 | 4 |
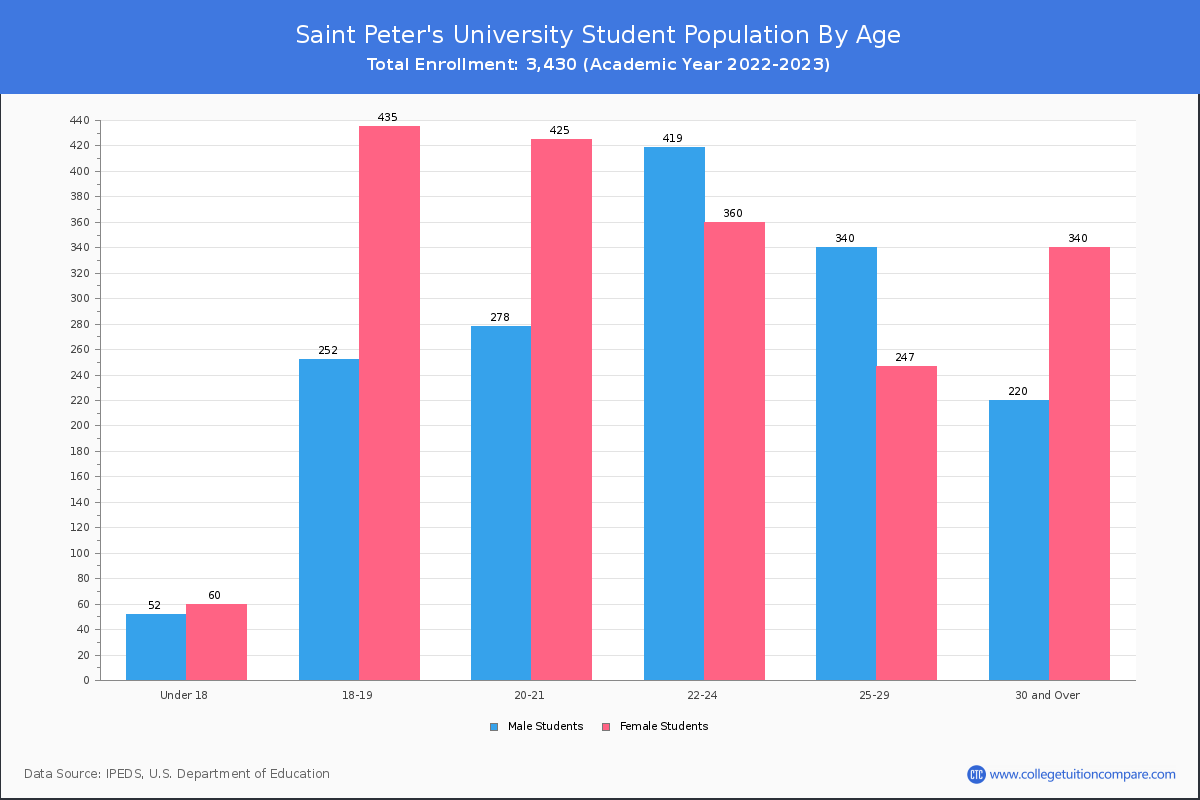
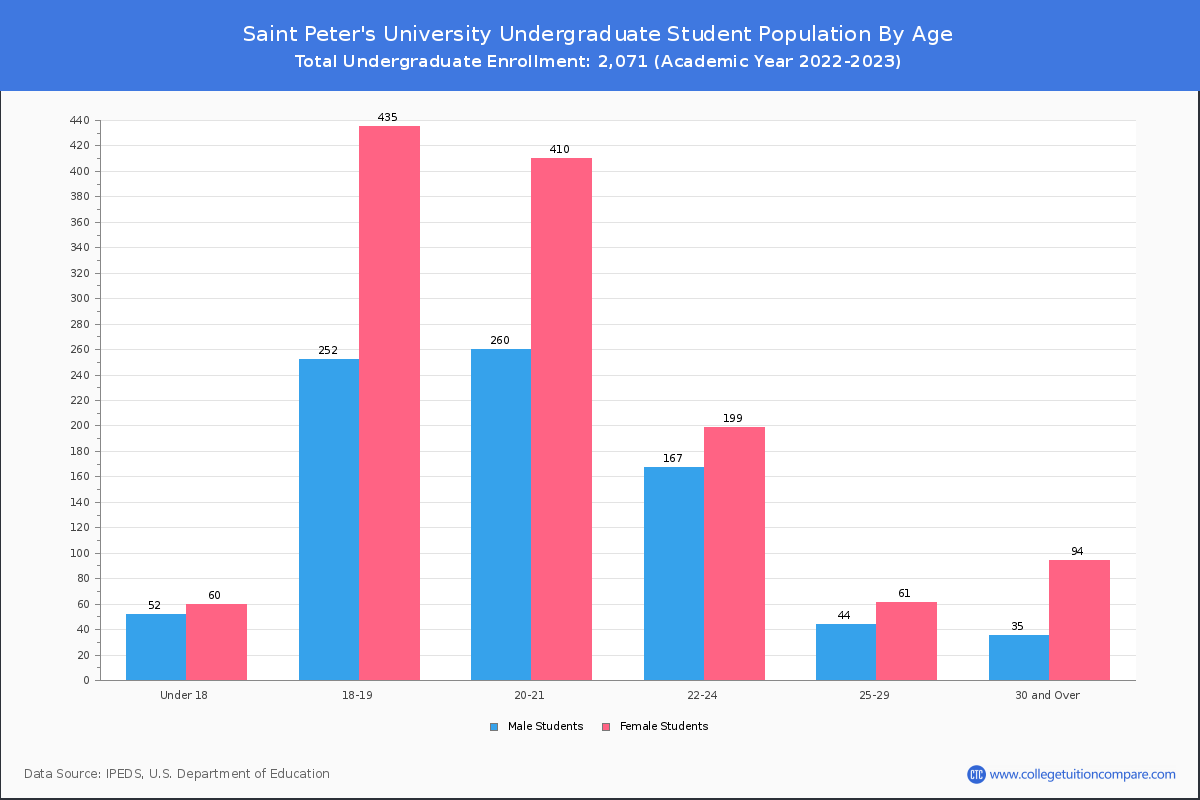
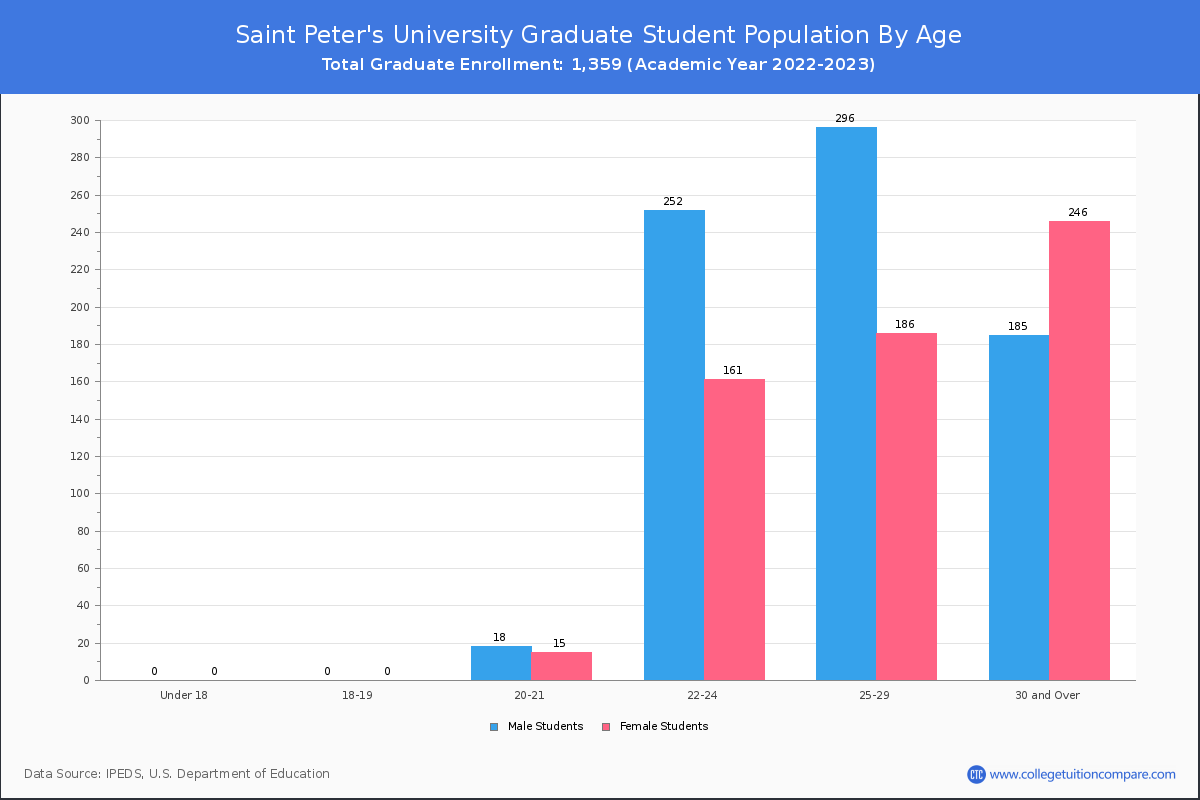
Student Age Distribution
By age, St. Peter's has 112 students under 18 years old and 2 students over 65 years old. There are 2,281 students under 25 years old, and 1,147 students over 25 years old out of 3,430 total students.
St. Peter's has 1,835 undergraduate students aged under 25 and 234 students aged 25 and over.
It has 446 graduate students aged under 25 and 913 students aged 25 and over.
| Age | Total | Men | Women |
|---|---|---|---|
| Under 18 | 112 | 60 | 52 |
| 18-19 | 687 | 435 | 252 |
| 20-21 | 703 | 425 | 278 |
| 22-24 | 779 | 360 | 419 |
| 25-29 | 587 | 247 | 340 |
| 30-34 | 199 | 111 | 88 |
| 35-39 | 114 | 58 | 56 |
| 40-49 | 147 | 102 | 45 |
| 50-64 | 98 | 67 | 31 |
| Over 65 | 2 | 2 | 0 |
| Age | Total | Men | Women |
|---|---|---|---|
| Under 18 | 112 | 60 | 52 |
| 18-19 | 687 | 435 | 252 |
| 20-21 | 670 | 410 | 260 |
| 22-24 | 366 | 199 | 167 |
| 25-29 | 105 | 61 | 44 |
| 30-34 | 46 | 33 | 13 |
| 35-39 | 29 | 19 | 10 |
| 40-49 | 38 | 30 | 8 |
| 50-64 | 16 | 12 | 4 |
| Age | Total | Men | Women |
|---|
Online Student Enrollment
Distance learning, also called online education, is very attractive to students, especially who want to continue education and work in field. At Saint Peter's University, 953 students are enrolled exclusively in online courses and 1,828 students are enrolled in some online courses.
565 students lived in New Jersey or jurisdiction in which the school is located are enrolled exclusively in online courses and 388 students live in other State or outside of the United States.
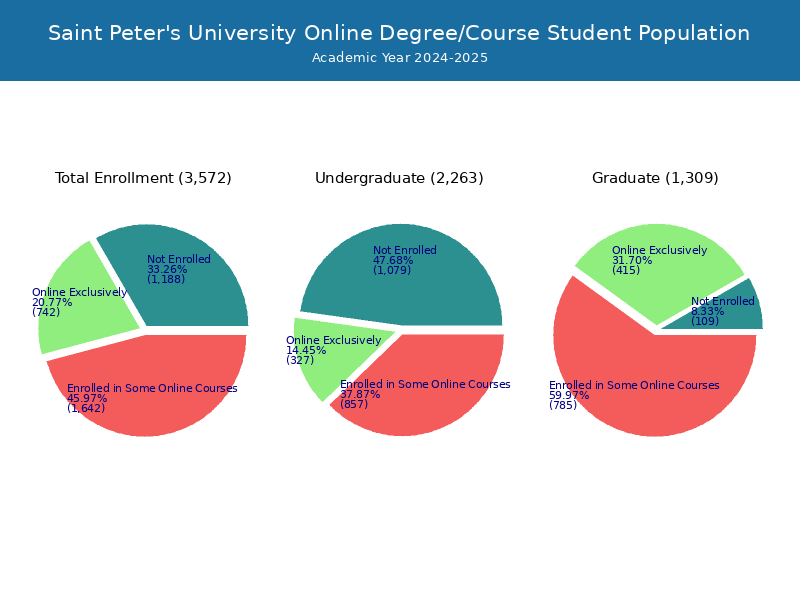
| All Students | Enrolled Exclusively Online Courses | Enrolled in Some Online Courses | |
|---|---|---|---|
| All Students | 3,430 | 953 | 1,828 |
| Undergraduate | 2,071 | 282 | 1,220 |
| Graduate | 1,359 | 671 | 608 |
| New Jersey Residents | Other States in U.S. | Outside of U.S. | |
|---|---|---|---|
| All Students | 565 | 221 | 167 |
| Undergraduate | 213 | 68 | 1 |
| Graduate | 352 | 153 | 166 |
Transfer-in Students (Undergraduate)
Among 2,071 enrolled in undergraduate programs, 225 students have transferred-in from other institutions. The percentage of transfer-in students is 10.86%.209 students have transferred in as full-time status and 16 students transferred in as part-time status.
| Number of Students | |
|---|---|
| Regular Full-time | 1,610 |
| Transfer-in Full-time | 209 |
| Regular Part-time | 236 |
| Transfer-in Part-time | 16 |