Student Population by Gender
Rutgers University-New Brunswick has a total of 50,637 enrolled students for the academic year 2022-2023. 36,344 students have enrolled in undergraduate programs and 14,293 students joined graduate programs.
By gender, 23,354 male and 27,283 female students (the male-female ratio is 46:54) are attending the school. The gender distribution is based on the 2022-2023 data.
| Total | Undergraduate | Graduate | |
|---|---|---|---|
| Total | 50,637 | 36,344 | 14,293 |
| Men | 23,354 | 18,156 | 5,198 |
| Women | 27,283 | 18,188 | 9,095 |
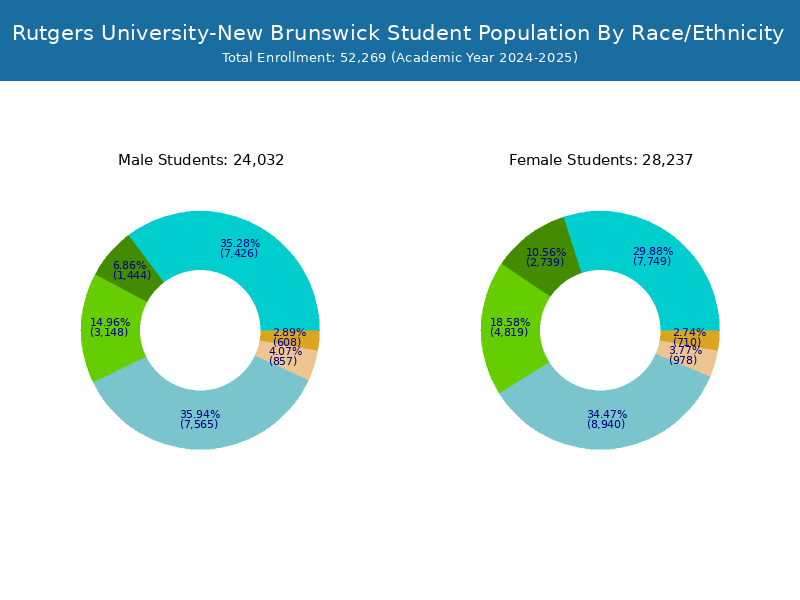
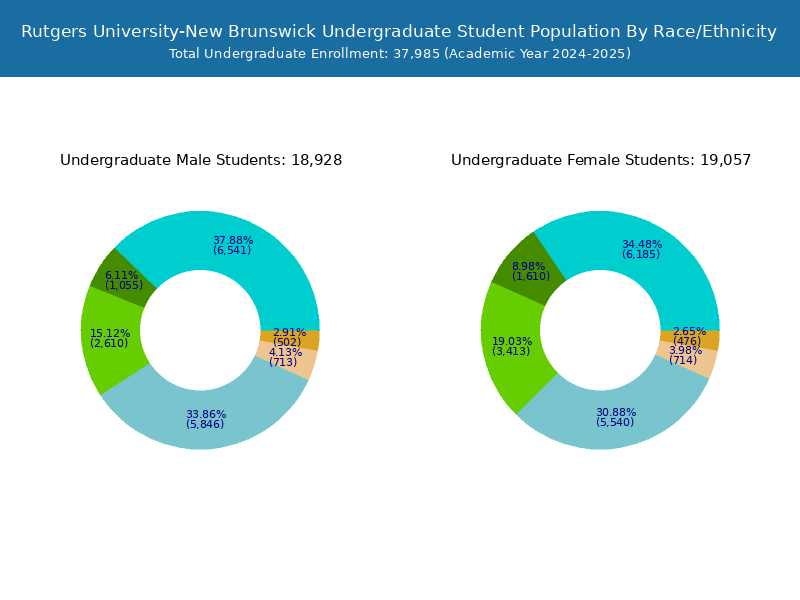

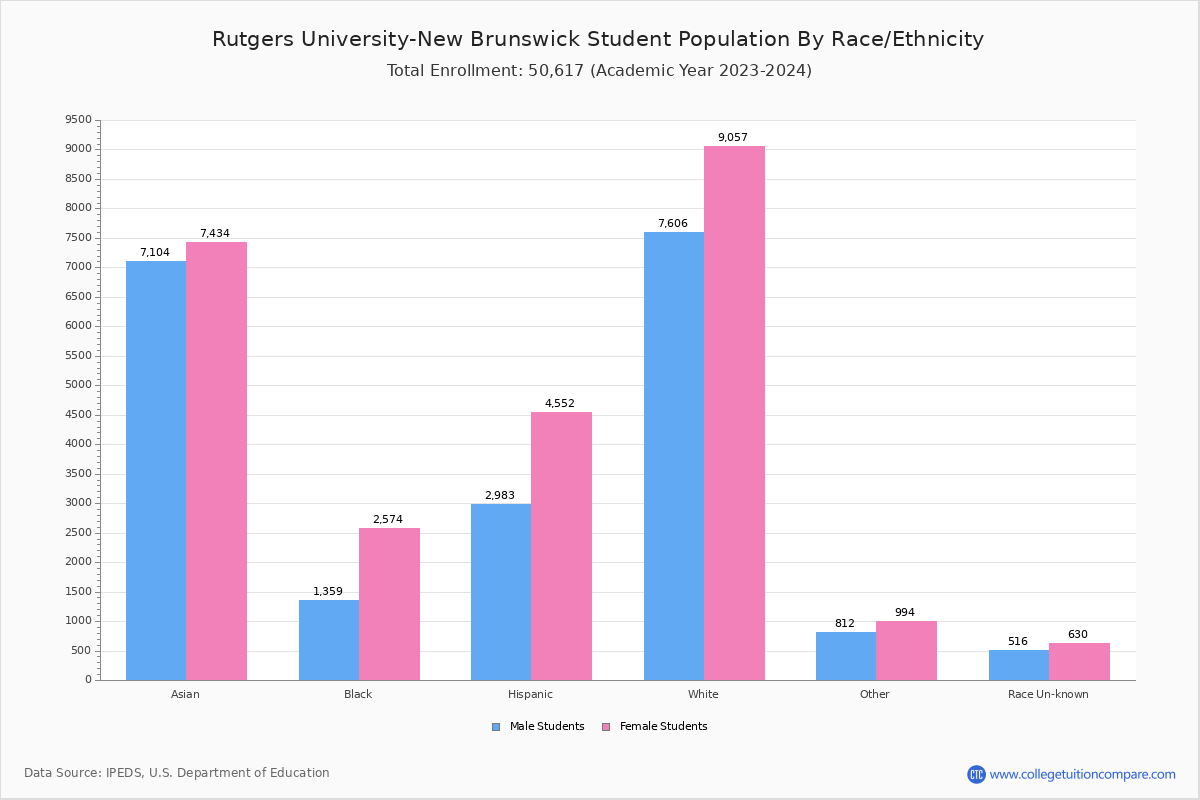
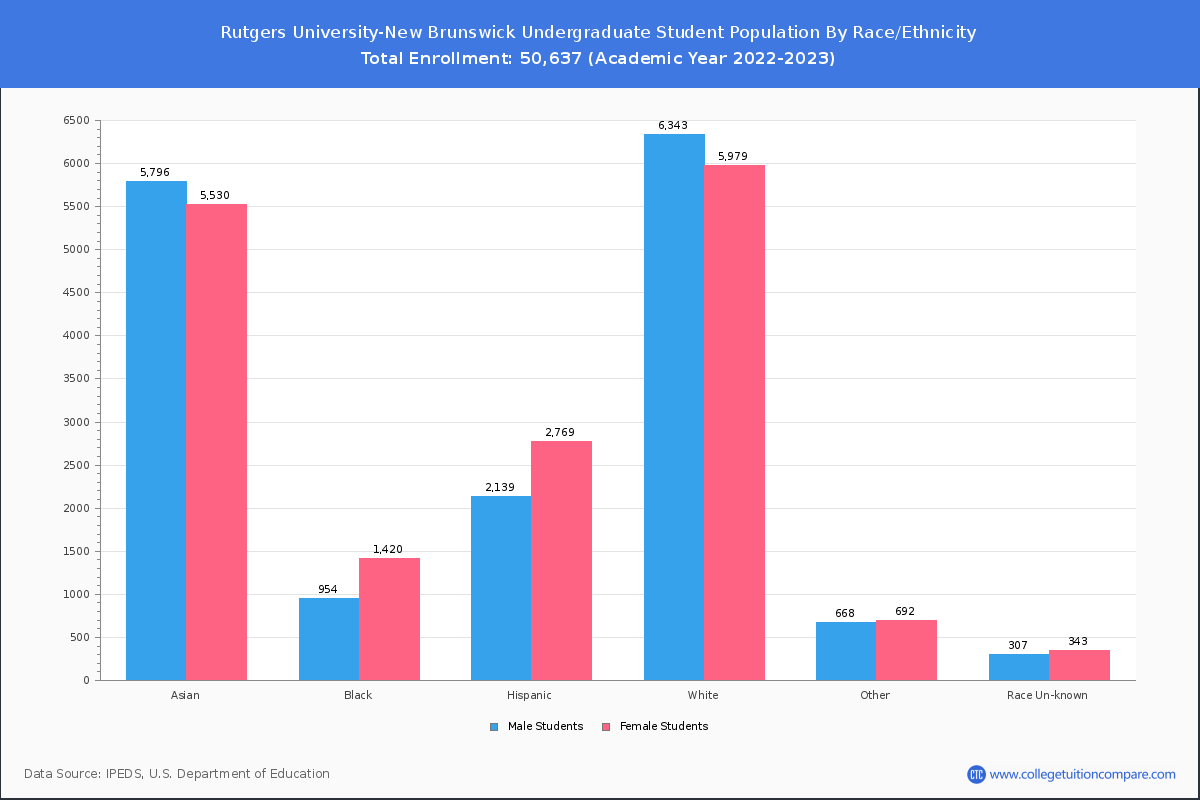
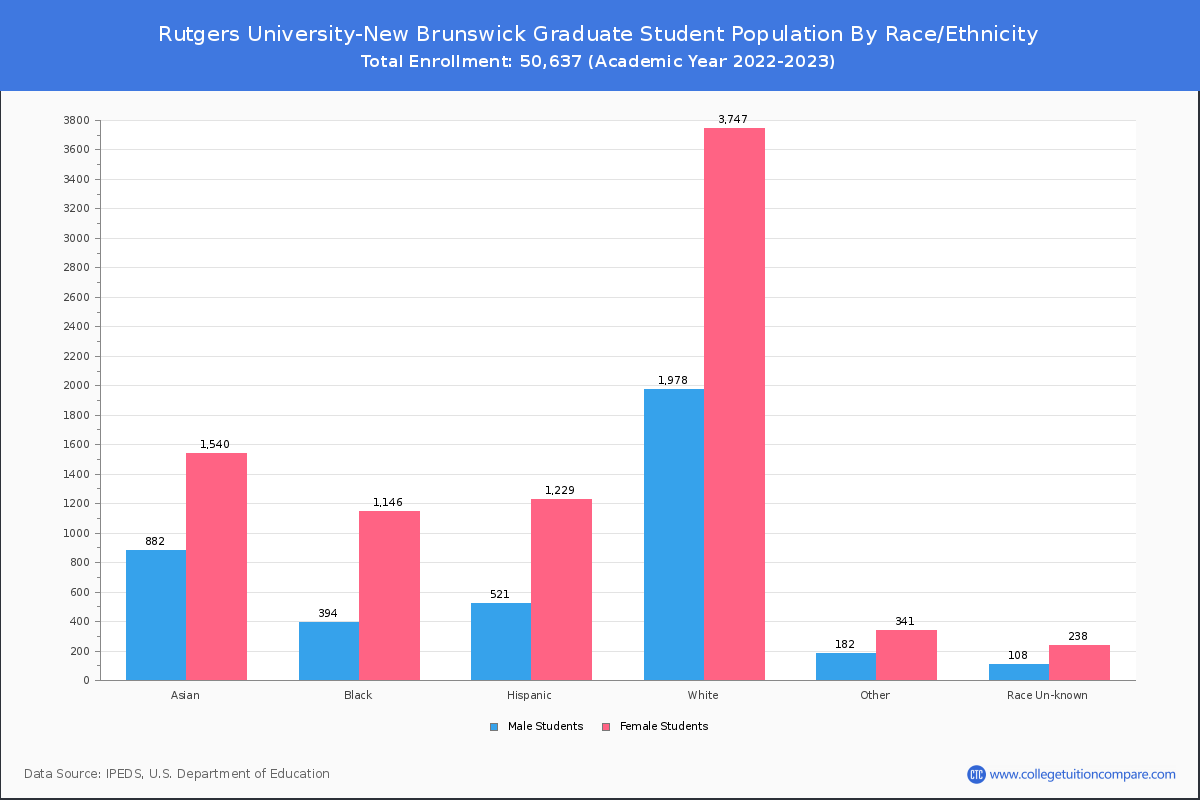
Student Distribution by Race/Ethnicity
By race/ethnicity, 17,098 White, 3,939 Black, and 14,185 Asian students out of a total of 50,637 are attending at Rutgers University-New Brunswick. Comprehensive enrollment statistic data by race/ethnicity is shown in the next chart (Academic year 2022-2023 data).
| Race | Total | Men | Women |
|---|---|---|---|
| American Indian or Native American | 34 | 14 | 20 |
| Asian | 14,185 | 6,918 | 7,267 |
| Black | 3,939 | 1,371 | 2,568 |
| Hispanic | 7,291 | 2,909 | 4,382 |
| Native Hawaiian or Other Pacific Islanders | 40 | 22 | 18 |
| White | 17,098 | 7,863 | 9,235 |
| Two or more races | 1,760 | 792 | 968 |
| Race Unknown | 1,072 | 469 | 603 |
| Race | Total | Men | Women |
|---|---|---|---|
| American Indian or Native American | 29 | 13 | 16 |
| Asian | 11,792 | 6,070 | 5,722 |
| Black | 2,471 | 987 | 1,484 |
| Hispanic | 5,472 | 2,389 | 3,083 |
| Native Hawaiian or Other Pacific Islanders | 33 | 20 | 13 |
| White | 11,772 | 6,050 | 5,722 |
| Two or more races | 1,302 | 630 | 672 |
| Race Unknown | 756 | 379 | 377 |
| Race | Total | Men | Women |
|---|---|---|---|
| American Indian or Native American | 3 | 1 | 2 |
| Asian | 393 | 199 | 194 |
| Black | 199 | 66 | 133 |
| Hispanic | 468 | 206 | 262 |
| Native Hawaiian or Other Pacific Islanders | 2 | 0 | 2 |
| White | 888 | 459 | 429 |
| Two or more races | 63 | 23 | 40 |
| Race Unknown | 39 | 19 | 20 |
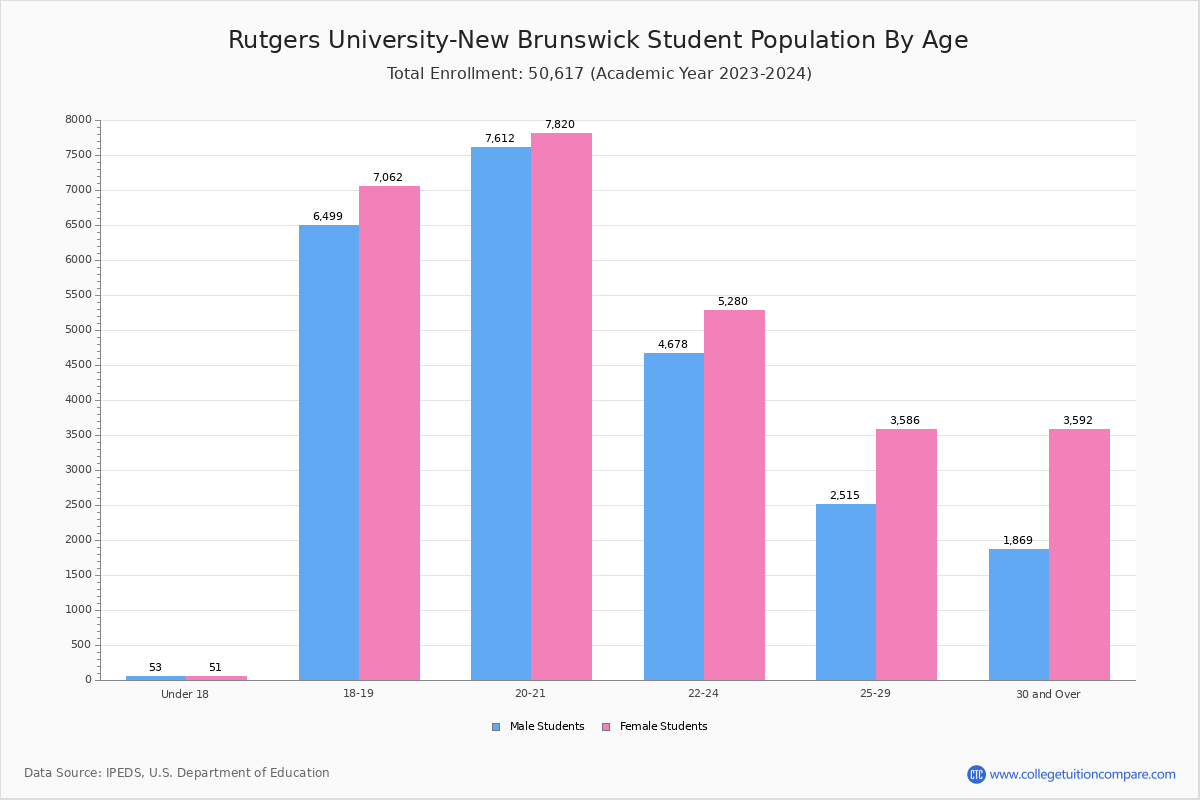
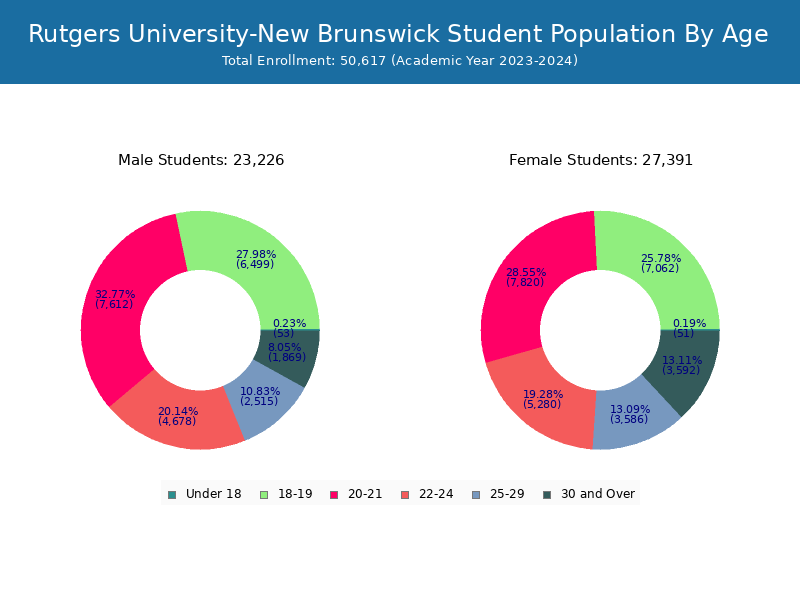
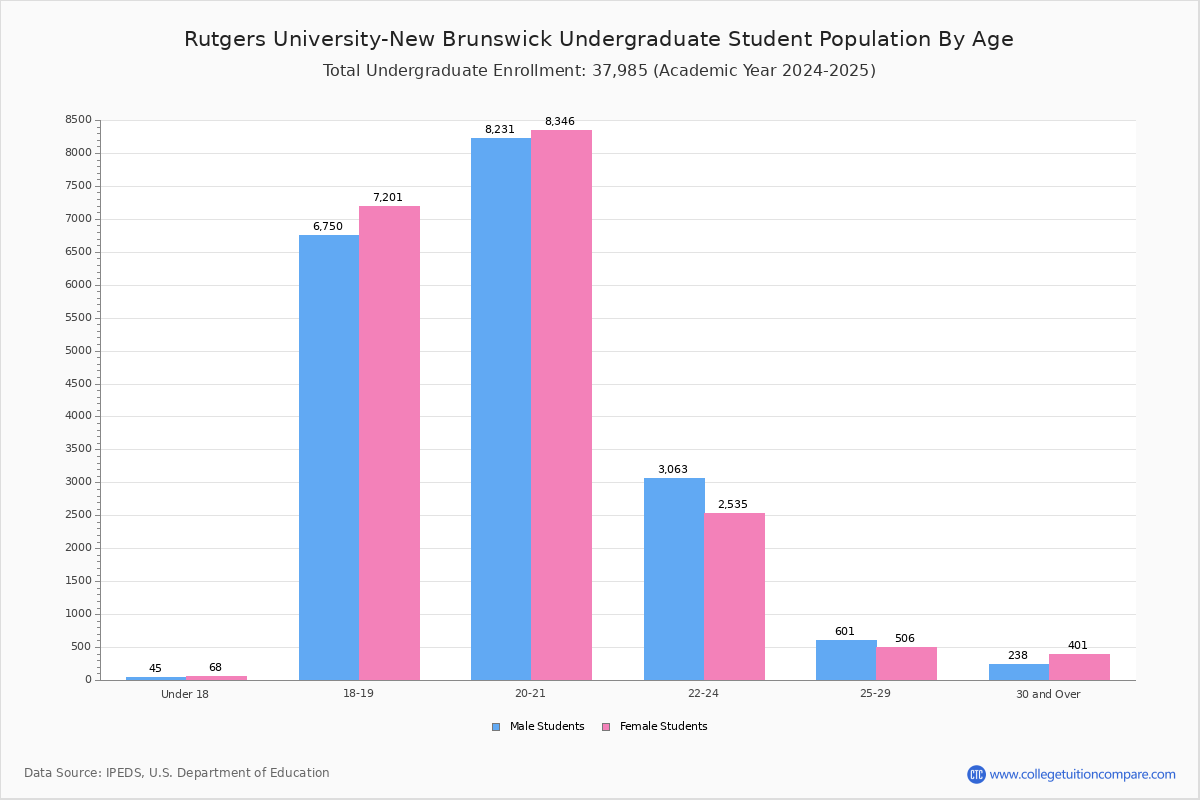
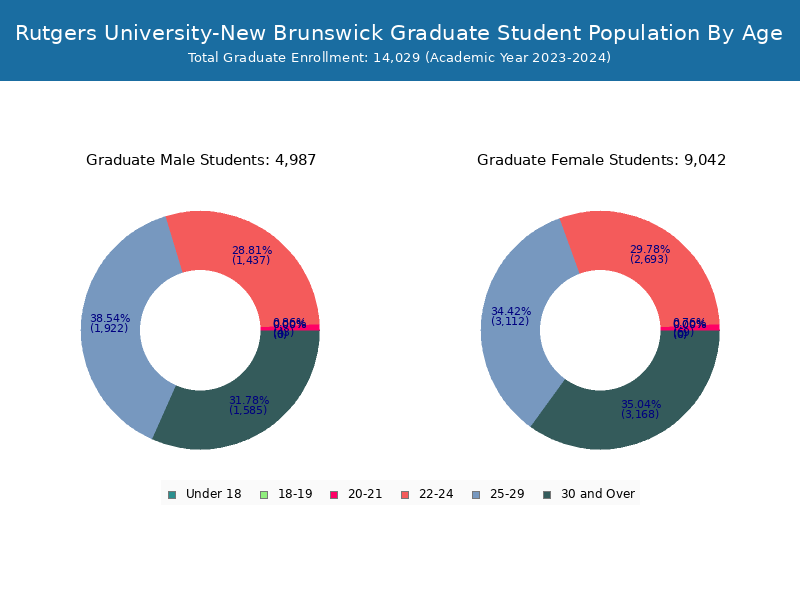
Student Age Distribution
By age, Rutgers has 94 students under 18 years old and 39 students over 65 years old. There are 38,753 students under 25 years old, and 11,884 students over 25 years old out of 50,637 total students.
In undergraduate programs, 94 students are younger than 18 and 7 students are older than 65. Rutgers has 34,476 undergraduate students aged under 25 and 1,868 students aged 25 and over.
It has 4,277 graduate students aged under 25 and 10,016 students aged 25 and over.
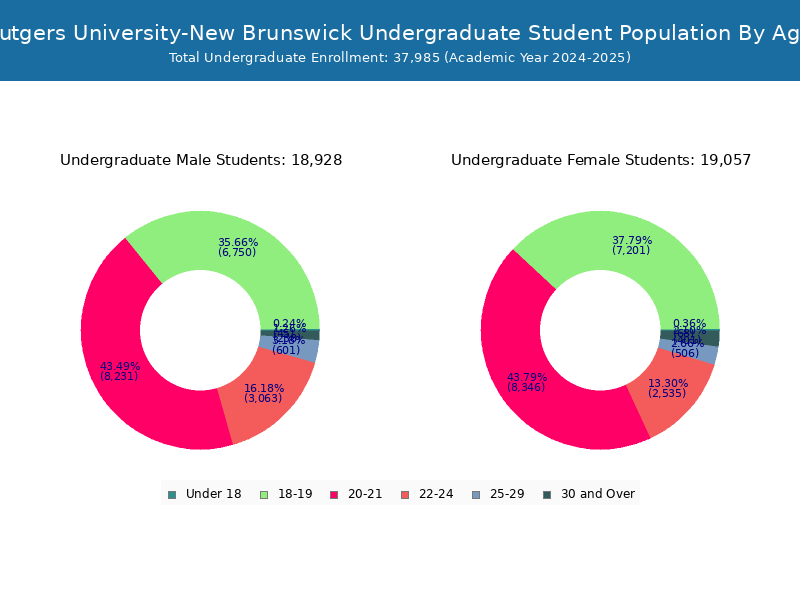

| Age | Total | Men | Women |
|---|---|---|---|
| Under 18 | 94 | 39 | 55 |
| 18-19 | 13,044 | 6,722 | 6,322 |
| 20-21 | 15,322 | 7,793 | 7,529 |
| 22-24 | 10,293 | 5,330 | 4,963 |
| 25-29 | 6,290 | 3,700 | 2,590 |
| 30-34 | 2,498 | 1,529 | 969 |
| 35-39 | 1,274 | 854 | 420 |
| 40-49 | 1,222 | 877 | 345 |
| 50-64 | 561 | 413 | 148 |
| Over 65 | 39 | 26 | 13 |
| Age | Total | Men | Women |
|---|---|---|---|
| Under 18 | 94 | 39 | 55 |
| 18-19 | 13,044 | 6,722 | 6,322 |
| 20-21 | 15,200 | 7,716 | 7,484 |
| 22-24 | 6,138 | 2,707 | 3,431 |
| 25-29 | 1,072 | 520 | 552 |
| 30-34 | 374 | 199 | 175 |
| 35-39 | 164 | 97 | 67 |
| 40-49 | 168 | 120 | 48 |
| 50-64 | 83 | 63 | 20 |
| Over 65 | 7 | 5 | 2 |
| Age | Total | Men | Women |
|---|
Online Student Enrollment
Distance learning, also called online education, is very attractive to students, especially who want to continue education and work in field. At Rutgers University-New Brunswick, 3,758 students are enrolled exclusively in online courses and 19,667 students are enrolled in some online courses.
2,910 students lived in New Jersey or jurisdiction in which the school is located are enrolled exclusively in online courses and 848 students live in other State or outside of the United States.
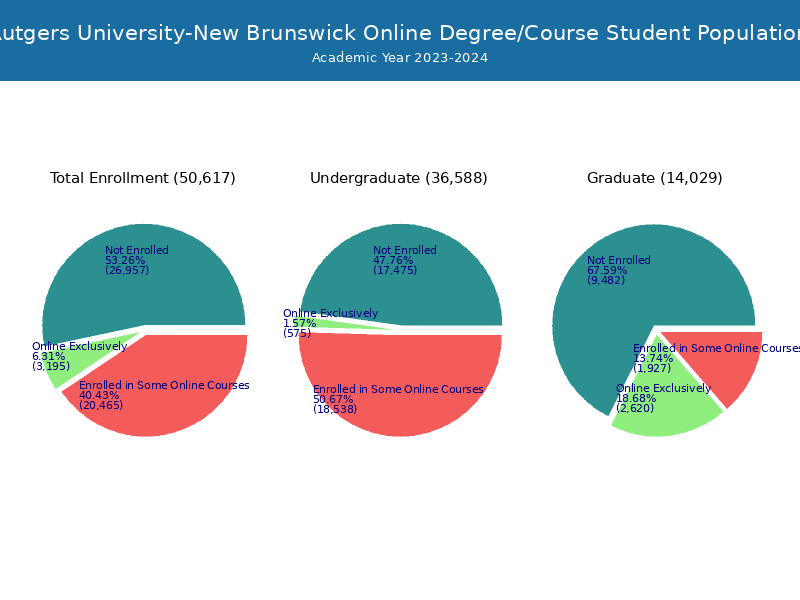
| All Students | Enrolled Exclusively Online Courses | Enrolled in Some Online Courses | |
|---|---|---|---|
| All Students | 50,637 | 3,758 | 19,667 |
| Undergraduate | 36,344 | 773 | 17,644 |
| Graduate | 14,293 | 2,985 | 2,023 |
| New Jersey Residents | Other States in U.S. | Outside of U.S. | |
|---|---|---|---|
| All Students | 2,910 | 699 | 149 |
| Undergraduate | 650 | 61 | 62 |
| Graduate | 2,260 | 638 | 87 |
Transfer-in Students (Undergraduate)
Among 36,344 enrolled in undergraduate programs, 2,144 students have transferred-in from other institutions. The percentage of transfer-in students is 5.90%.2,040 students have transferred in as full-time status and 104 students transferred in as part-time status.
| Number of Students | |
|---|---|
| Regular Full-time | 32,627 |
| Transfer-in Full-time | 2,040 |
| Regular Part-time | 1,573 |
| Transfer-in Part-time | 104 |