Student Population by Gender
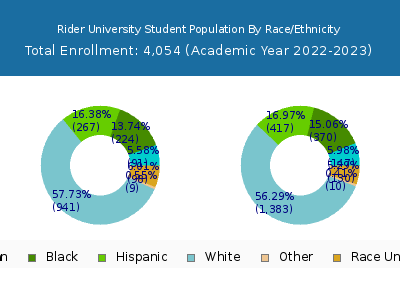
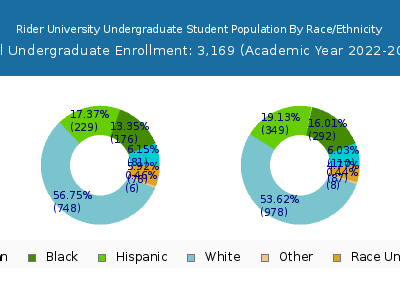
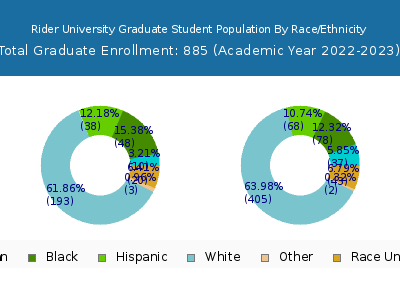
Rider University has a total of 4,054 enrolled students for the academic year 2022-2023. 3,169 students have enrolled in undergraduate programs and 885 students joined graduate programs.
By gender, 1,653 male and 2,401 female students (the male-female ratio is 41:59) are attending the school. The gender distribution is based on the 2022-2023 data.
| Total | Undergraduate | Graduate | |
|---|---|---|---|
| Total | 4,054 | 3,169 | 885 |
| Men | 1,653 | 1,369 | 284 |
| Women | 2,401 | 1,800 | 601 |
Student Distribution by Race/Ethnicity
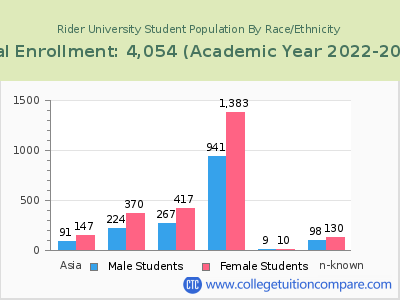
| Race | Total | Men | Women |
|---|---|---|---|
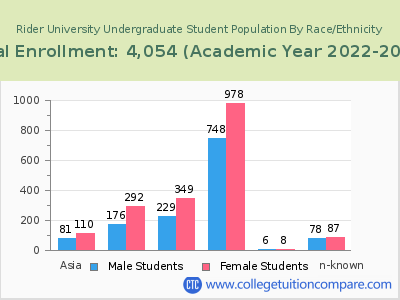
| American Indian or Native American | 12 | 7 | 5 |
| Asian | 207 | 84 | 123 |
| Black | 549 | 216 | 333 |
| Hispanic | 653 | 247 | 406 |
| Native Hawaiian or Other Pacific Islanders | 7 | 3 | 4 |
| White | 2,216 | 911 | 1,305 |
| Two or more races | 133 | 61 | 72 |
| Race Unknown | 110 | 46 | 64 |
| Race | Total | Men | Women |
|---|---|---|---|
| American Indian or Native American | 10 | 6 | 4 |
| Asian | 168 | 75 | 93 |
| Black | 450 | 181 | 269 |
| Hispanic | 565 | 220 | 345 |
| Native Hawaiian or Other Pacific Islanders | 7 | 3 | 4 |
| White | 1,657 | 733 | 924 |
| Two or more races | 108 | 54 | 54 |
| Race Unknown | 79 | 35 | 44 |
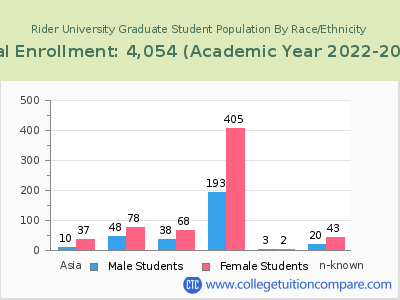
| Race | Total | Men | Women |
|---|---|---|---|
| American Indian or Native American | 0 | 0 | 0 |
| Asian | 3 | 2 | 1 |
| Black | 26 | 10 | 16 |
| Hispanic | 43 | 13 | 30 |
| Native Hawaiian or Other Pacific Islanders | 1 | 0 | 1 |
| White | 119 | 58 | 61 |
| Two or more races | 4 | 2 | 2 |
| Race Unknown | 5 | 1 | 4 |
Student Age Distribution
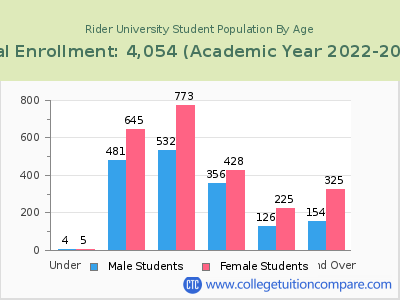
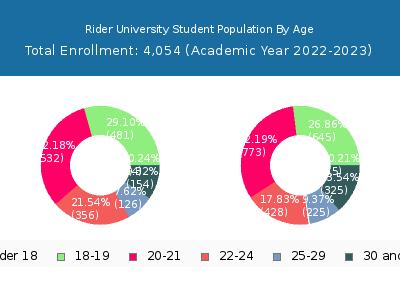
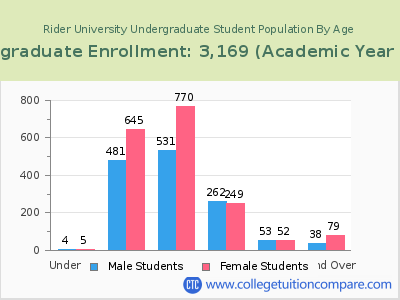
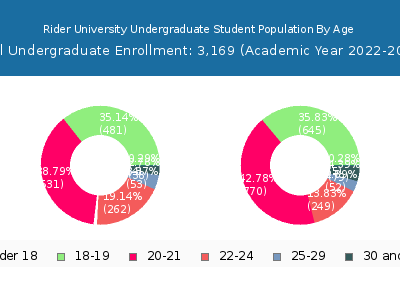
By age, Rider has 9 students under 18 years old and 12 students over 65 years old. There are 3,224 students under 25 years old, and 830 students over 25 years old out of 4,054 total students.
In undergraduate programs, 9 students are younger than 18 and 6 students are older than 65. Rider has 2,947 undergraduate students aged under 25 and 222 students aged 25 and over.
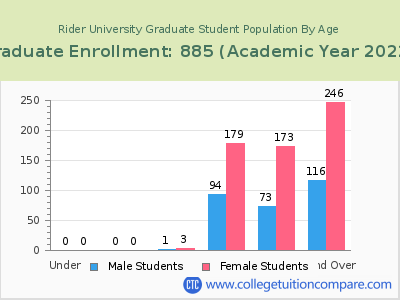
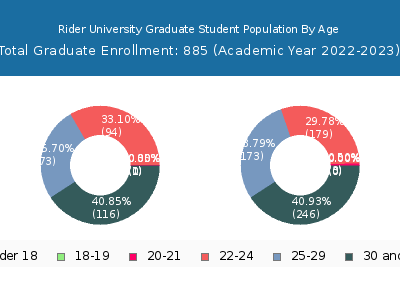
It has 277 graduate students aged under 25 and 608 students aged 25 and over.
| Age | Total | Men | Women |
|---|---|---|---|
| Under 18 | 9 | 5 | 4 |
| 18-19 | 1,126 | 645 | 481 |
| 20-21 | 1,305 | 773 | 532 |
| 22-24 | 784 | 428 | 356 |
| 25-29 | 351 | 225 | 126 |
| 30-34 | 156 | 105 | 51 |
| 35-39 | 99 | 65 | 34 |
| 40-49 | 128 | 89 | 39 |
| 50-64 | 84 | 62 | 22 |
| Over 65 | 12 | 4 | 8 |
| Age | Total | Men | Women |
|---|---|---|---|
| Under 18 | 9 | 5 | 4 |
| 18-19 | 1,126 | 645 | 481 |
| 20-21 | 1,301 | 770 | 531 |
| 22-24 | 511 | 249 | 262 |
| 25-29 | 105 | 52 | 53 |
| 30-34 | 39 | 26 | 13 |
| 35-39 | 26 | 16 | 10 |
| 40-49 | 25 | 19 | 6 |
| 50-64 | 21 | 16 | 5 |
| Over 65 | 6 | 2 | 4 |
| Age | Total | Men | Women |
|---|
Online Student Enrollment
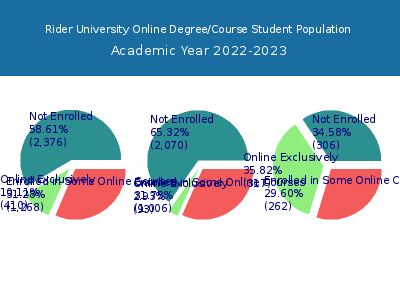
Distance learning, also called online education, is very attractive to students, especially who want to continue education and work in field. At Rider University, 410 students are enrolled exclusively in online courses and 1,268 students are enrolled in some online courses.
306 students lived in New Jersey or jurisdiction in which the school is located are enrolled exclusively in online courses and 104 students live in other State or outside of the United States.
| All Students | Enrolled Exclusively Online Courses | Enrolled in Some Online Courses | |
|---|---|---|---|
| All Students | 4,054 | 410 | 1,268 |
| Undergraduate | 3,169 | 93 | 1,006 |
| Graduate | 885 | 317 | 262 |
| New Jersey Residents | Other States in U.S. | Outside of U.S. | |
|---|---|---|---|
| All Students | 306 | 98 | 6 |
| Undergraduate | 81 | 10 | 2 |
| Graduate | 225 | 88 | 4 |
Transfer-in Students (Undergraduate)
Among 3,169 enrolled in undergraduate programs, 221 students have transferred-in from other institutions. The percentage of transfer-in students is 6.97%.193 students have transferred in as full-time status and 28 students transferred in as part-time status.
| Number of Students | |
|---|---|
| Regular Full-time | 2,773 |
| Transfer-in Full-time | 193 |
| Regular Part-time | 175 |
| Transfer-in Part-time | 28 |
