Student Population by Gender
Princeton University has a total of 8,842 enrolled students for the academic year 2022-2023. 5,604 students have enrolled in undergraduate programs and 3,238 students joined graduate programs.
By gender, 4,668 male and 4,174 female students (the male-female ratio is 53:47) are attending the school. The gender distribution is based on the 2022-2023 data.
| Total | Undergraduate | Graduate | |
|---|---|---|---|
| Total | 8,842 | 5,604 | 3,238 |
| Men | 4,668 | 2,803 | 1,865 |
| Women | 4,174 | 2,801 | 1,373 |
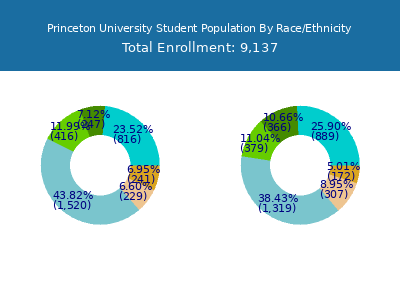
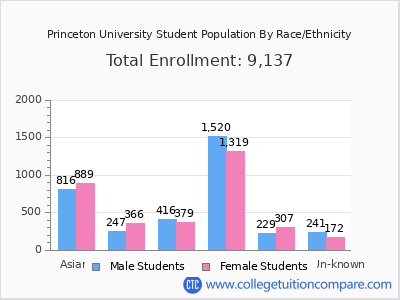
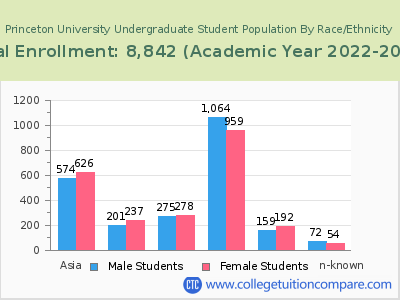
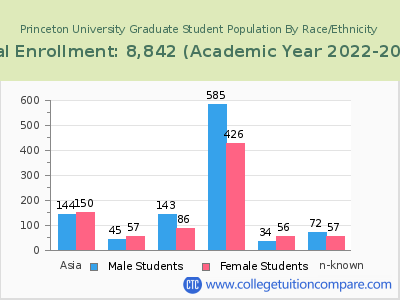
Student Distribution by Race/Ethnicity
| Race | Total | Men | Women |
|---|---|---|---|
| American Indian or Native American | 8 | 2 | 6 |
| Asian | 1,615 | 790 | 825 |
| Black | 568 | 254 | 314 |
| Hispanic | 786 | 415 | 371 |
| Native Hawaiian or Other Pacific Islanders | 6 | 4 | 2 |
| White | 3,055 | 1,659 | 1,396 |
| Two or more races | 483 | 208 | 275 |
| Race Unknown | 262 | 143 | 119 |
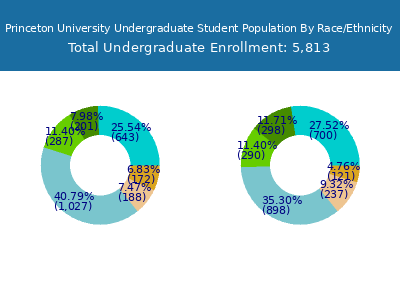
| Race | Total | Men | Women |
|---|---|---|---|
| American Indian or Native American | 7 | 1 | 6 |
| Asian | 1,301 | 631 | 670 |
| Black | 442 | 196 | 246 |
| Hispanic | 556 | 279 | 277 |
| Native Hawaiian or Other Pacific Islanders | 6 | 4 | 2 |
| White | 2,079 | 1,101 | 978 |
| Two or more races | 378 | 164 | 214 |
| Race Unknown | 130 | 66 | 64 |
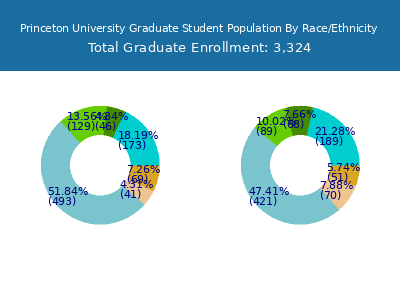
| Race | Total | Men | Women |
|---|---|---|---|
| American Indian or Native American | 0 | 0 | 0 |
| Asian | 7 | 5 | 2 |
| Black | 4 | 3 | 1 |
| Hispanic | 8 | 6 | 2 |
| Native Hawaiian or Other Pacific Islanders | 0 | 0 | 0 |
| White | 8 | 6 | 2 |
| Two or more races | 0 | 0 | 0 |
| Race Unknown | 0 | 0 | 0 |
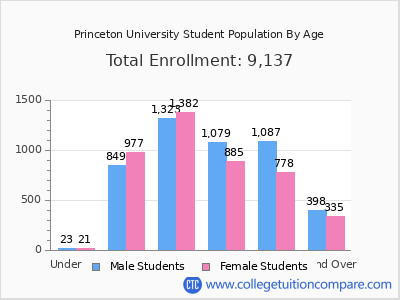
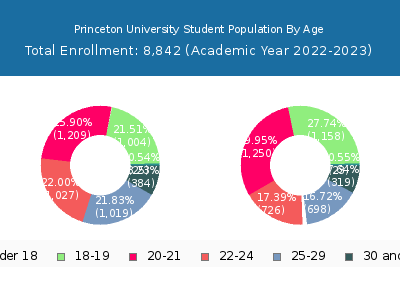
Student Age Distribution
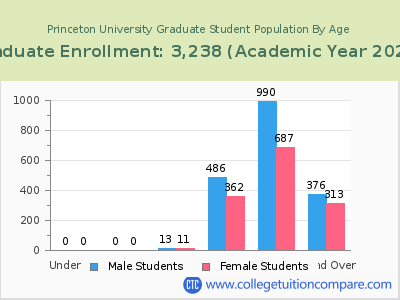
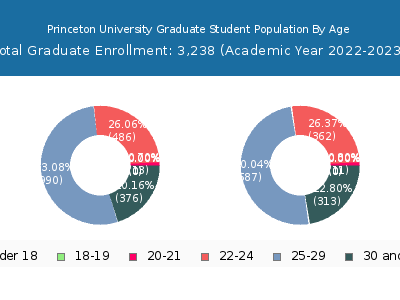
| Age | Total | Men | Women |
|---|---|---|---|
| Under 18 | 48 | 23 | 25 |
| 18-19 | 2,162 | 1,158 | 1,004 |
| 20-21 | 2,459 | 1,250 | 1,209 |
| 22-24 | 1,753 | 726 | 1,027 |
| 25-29 | 1,717 | 698 | 1,019 |
| 30-34 | 543 | 242 | 301 |
| 35-39 | 113 | 59 | 54 |
| 40-49 | 42 | 16 | 26 |
| 50-64 | 5 | 2 | 3 |
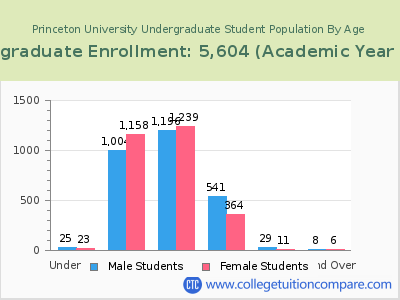
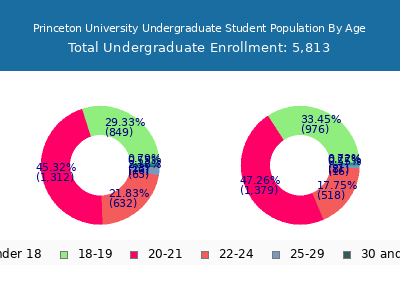
| Age | Total | Men | Women |
|---|---|---|---|
| Under 18 | 48 | 23 | 25 |
| 18-19 | 2,162 | 1,158 | 1,004 |
| 20-21 | 2,435 | 1,239 | 1,196 |
| 22-24 | 905 | 364 | 541 |
| 25-29 | 40 | 11 | 29 |
| 30-34 | 7 | 2 | 5 |
| 35-39 | 1 | 1 | 0 |
| 40-49 | 4 | 2 | 2 |
| 50-64 | 2 | 1 | 1 |
| Age | Total | Men | Women |
|---|
Transfer-in Students (Undergraduate)
Among 5,604 enrolled in undergraduate programs, 27 students have transferred-in from other institutions. The percentage of transfer-in students is 0.48%.
| Number of Students | |
|---|---|
| Regular Full-time | 5,513 |
| Transfer-in Full-time | 27 |
