Student Population by Gender
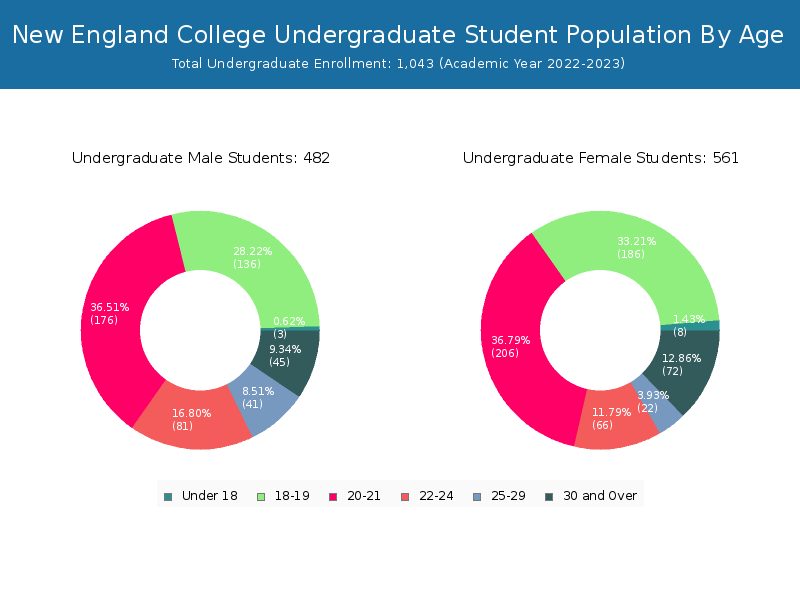
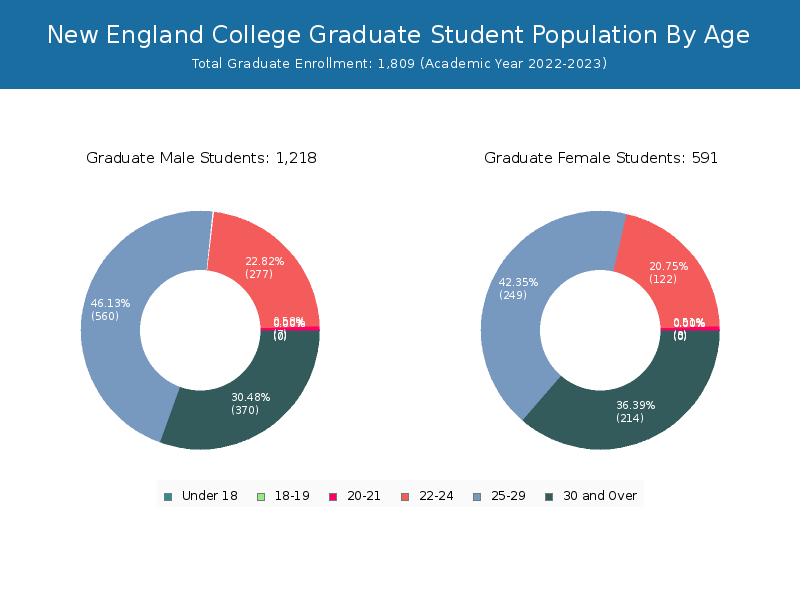
New England College has a total of 2,852 enrolled students for the academic year 2022-2023. 1,043 students have enrolled in undergraduate programs and 1,809 students joined graduate programs.
By gender, 1,700 male and 1,152 female students (the male-female ratio is 60:40) are attending the school. The gender distribution is based on the 2022-2023 data.
| Total | Undergraduate | Graduate | |
|---|---|---|---|
| Total | 2,852 | 1,043 | 1,809 |
| Men | 1,700 | 482 | 1,218 |
| Women | 1,152 | 561 | 591 |
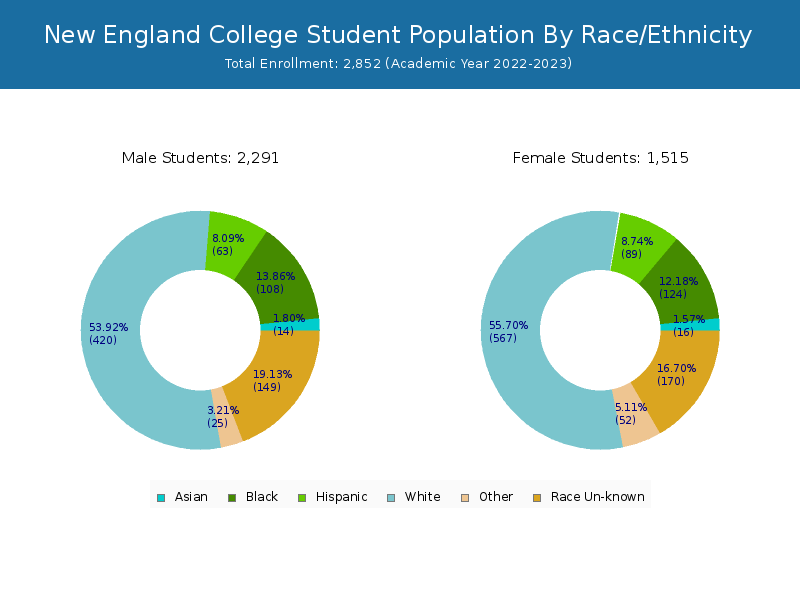
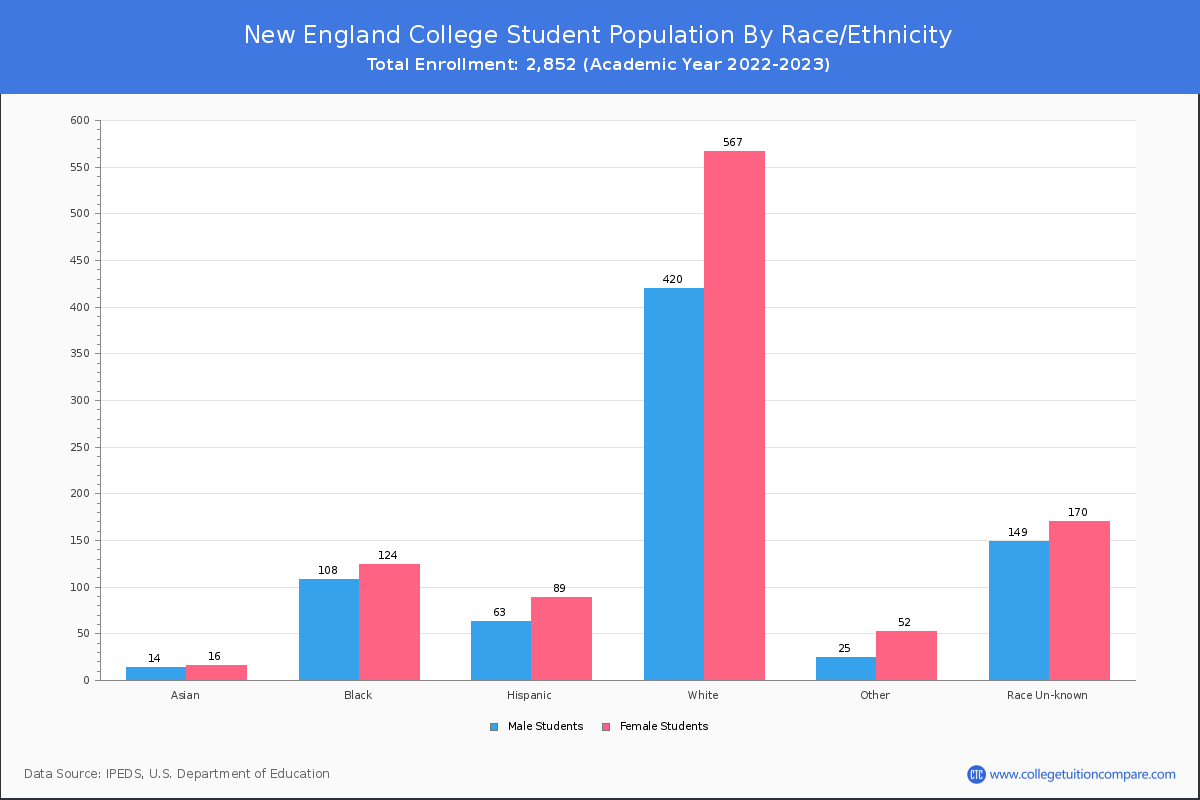
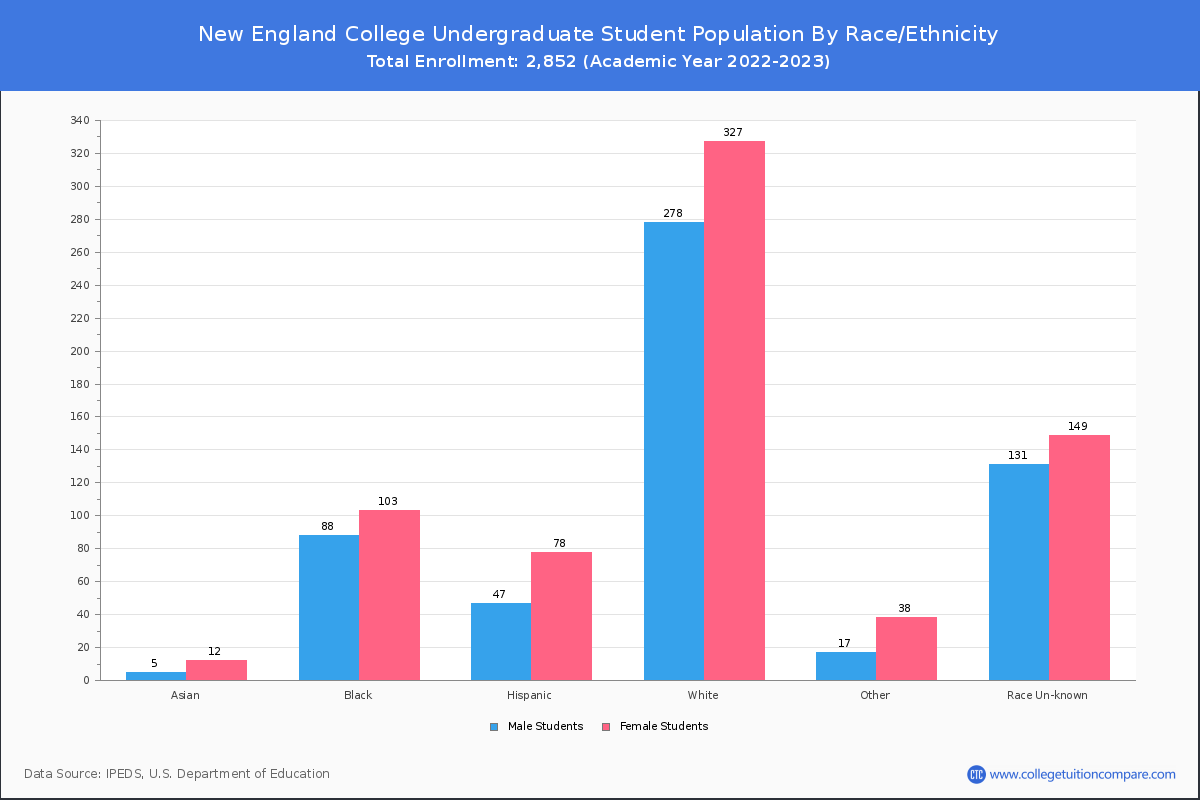
Student Distribution by Race/Ethnicity
By race/ethnicity, 717 White, 157 Black, and 20 Asian students out of a total of 2,852 are attending at New England College. Comprehensive enrollment statistic data by race/ethnicity is shown in the next chart (Academic year 2022-2023 data).
| Race | Total | Men | Women |
|---|---|---|---|
| American Indian or Native American | 5 | 1 | 4 |
| Asian | 20 | 10 | 10 |
| Black | 157 | 72 | 85 |
| Hispanic | 125 | 48 | 77 |
| Native Hawaiian or Other Pacific Islanders | 1 | 1 | 0 |
| White | 717 | 300 | 417 |
| Two or more races | 44 | 17 | 27 |
| Race Unknown | 284 | 139 | 145 |
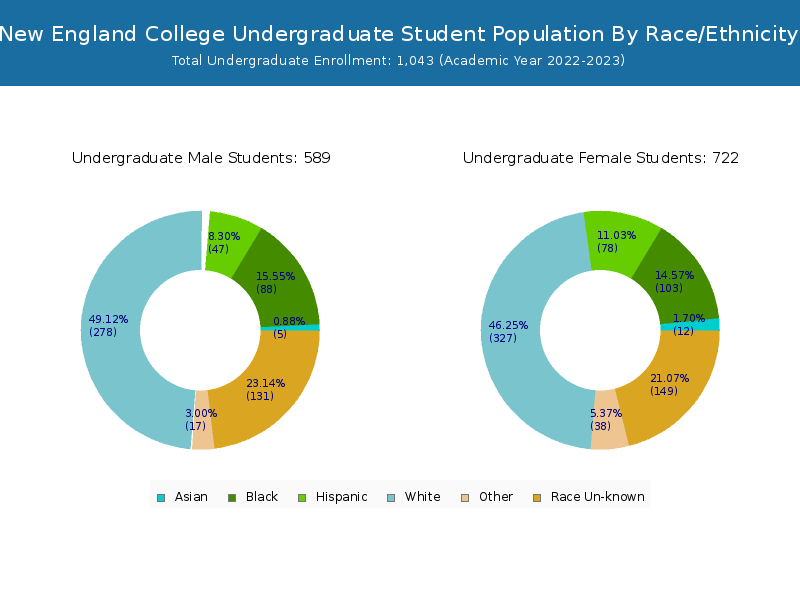
| Race | Total | Men | Women |
|---|---|---|---|
| American Indian or Native American | 4 | 1 | 3 |
| Asian | 12 | 5 | 7 |
| Black | 129 | 61 | 68 |
| Hispanic | 104 | 40 | 64 |
| Native Hawaiian or Other Pacific Islanders | 1 | 1 | 0 |
| White | 485 | 221 | 264 |
| Two or more races | 32 | 14 | 18 |
| Race Unknown | 248 | 120 | 128 |
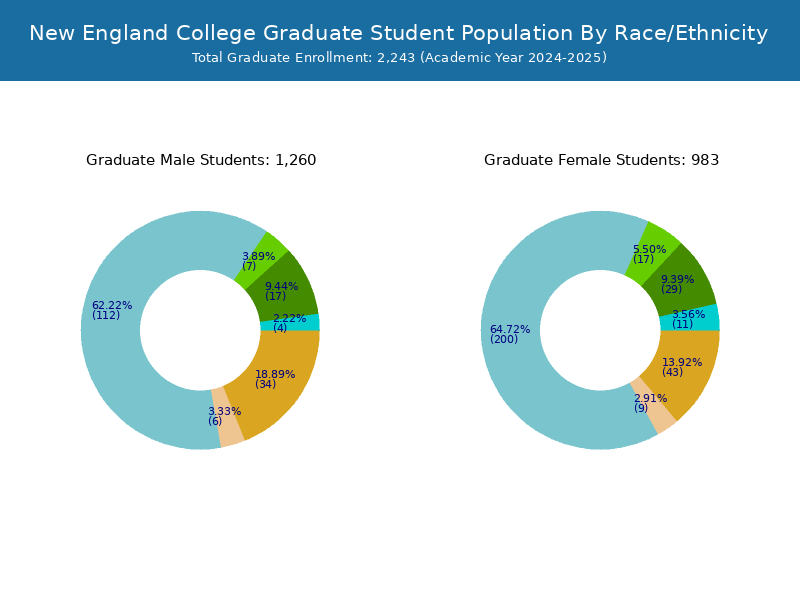
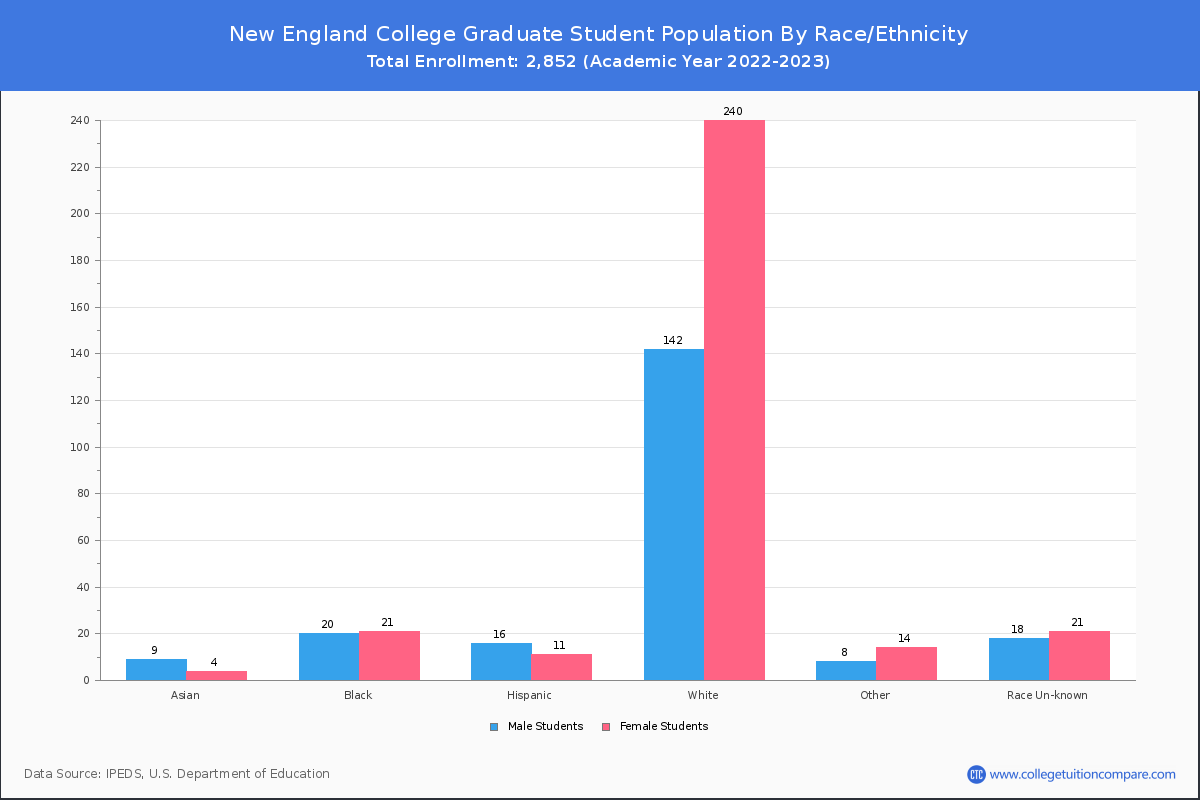
| Race | Total | Men | Women |
|---|---|---|---|
| American Indian or Native American | 0 | 0 | 0 |
| Asian | 1 | 0 | 1 |
| Black | 5 | 2 | 3 |
| Hispanic | 3 | 1 | 2 |
| Native Hawaiian or Other Pacific Islanders | 0 | 0 | 0 |
| White | 38 | 12 | 26 |
| Two or more races | 1 | 1 | 0 |
| Race Unknown | 20 | 8 | 12 |
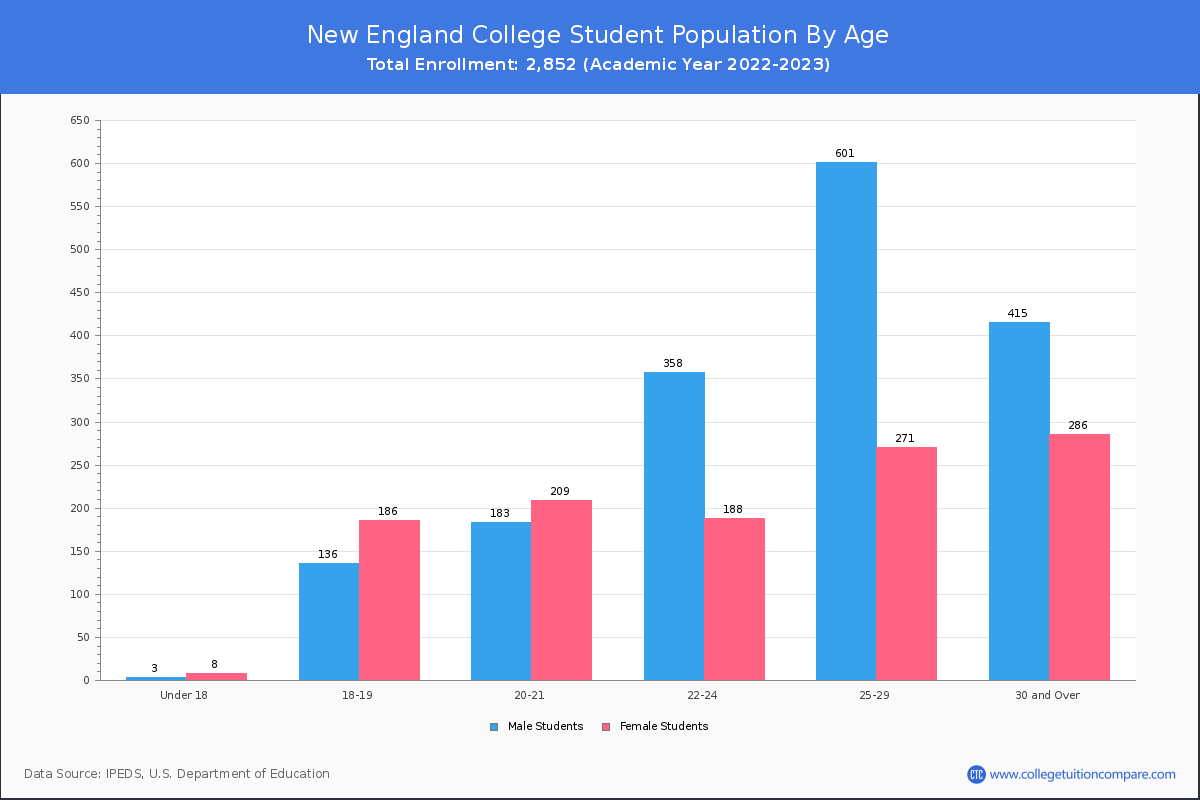
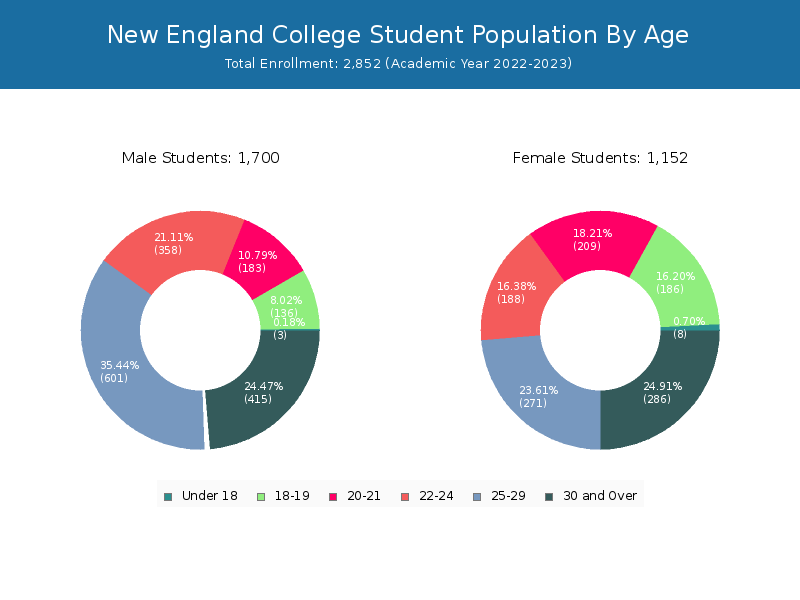
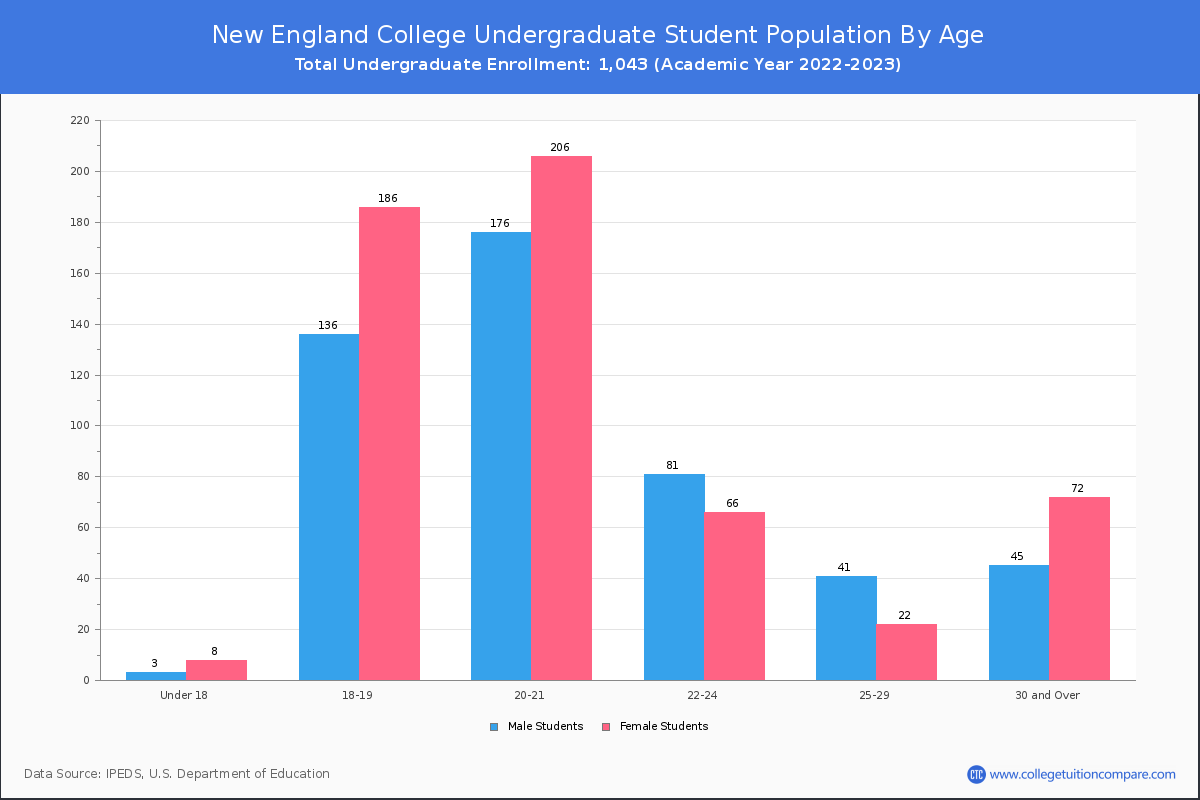
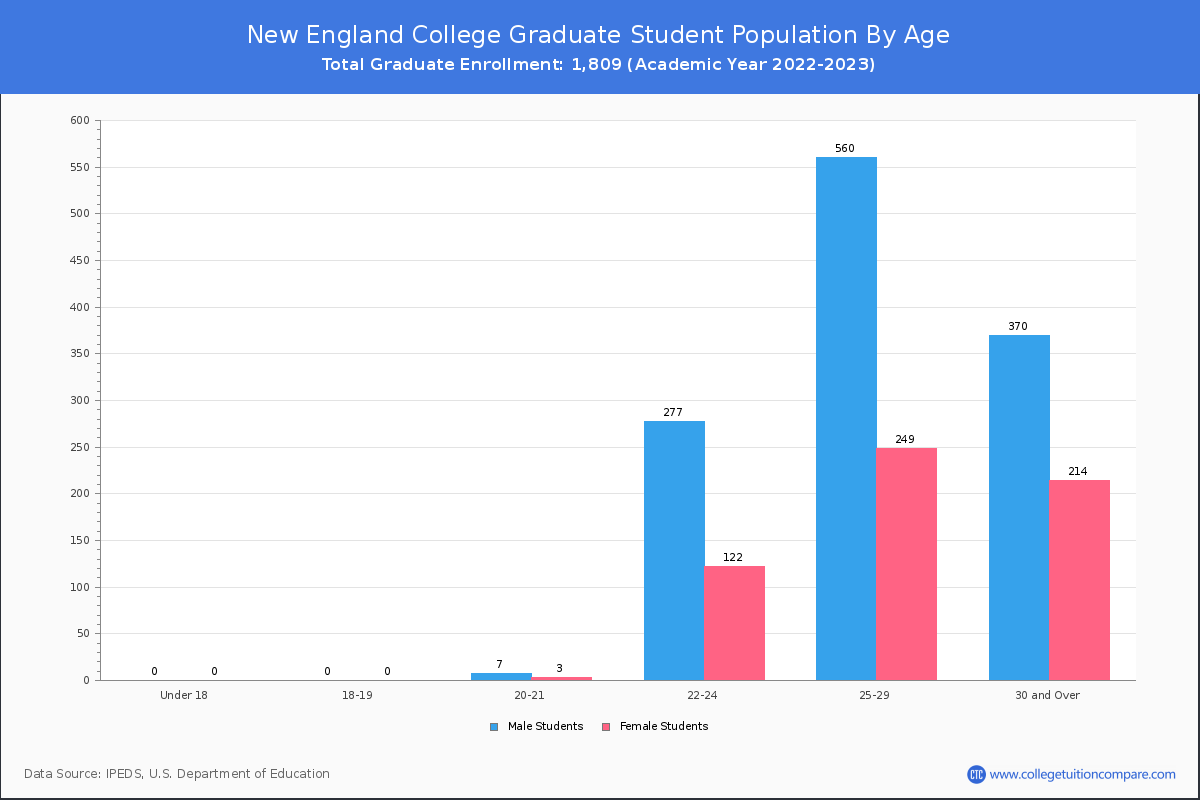
Student Age Distribution
There are 1,271 students under 25 years old, and 1,573 students over 25 years old out of 2,852 total students.
NEC has 862 undergraduate students aged under 25 and 180 students aged 25 and over.
It has 409 graduate students aged under 25 and 1,393 students aged 25 and over.
| Age | Total | Men | Women |
|---|---|---|---|
| Under 18 | 11 | 8 | 3 |
| 18-19 | 322 | 186 | 136 |
| 20-21 | 392 | 209 | 183 |
| 22-24 | 546 | 188 | 358 |
| 25-29 | 872 | 271 | 601 |
| 30-34 | 413 | 134 | 279 |
| 35-39 | 123 | 51 | 72 |
| 40-49 | 118 | 71 | 47 |
| 50-64 | 47 | 30 | 17 |
| Age | Total | Men | Women |
|---|---|---|---|
| Under 18 | 11 | 8 | 3 |
| 18-19 | 322 | 186 | 136 |
| 20-21 | 382 | 206 | 176 |
| 22-24 | 147 | 66 | 81 |
| 25-29 | 63 | 22 | 41 |
| 30-34 | 43 | 24 | 19 |
| 35-39 | 25 | 15 | 10 |
| 40-49 | 39 | 28 | 11 |
| 50-64 | 10 | 5 | 5 |
| Age | Total | Men | Women |
|---|
Online Student Enrollment
Distance learning, also called online education, is very attractive to students, especially who want to continue education and work in field. At New England College, 474 students are enrolled exclusively in online courses and 445 students are enrolled in some online courses.
120 students lived in New Hampshire or jurisdiction in which the school is located are enrolled exclusively in online courses and 354 students live in other State or outside of the United States.
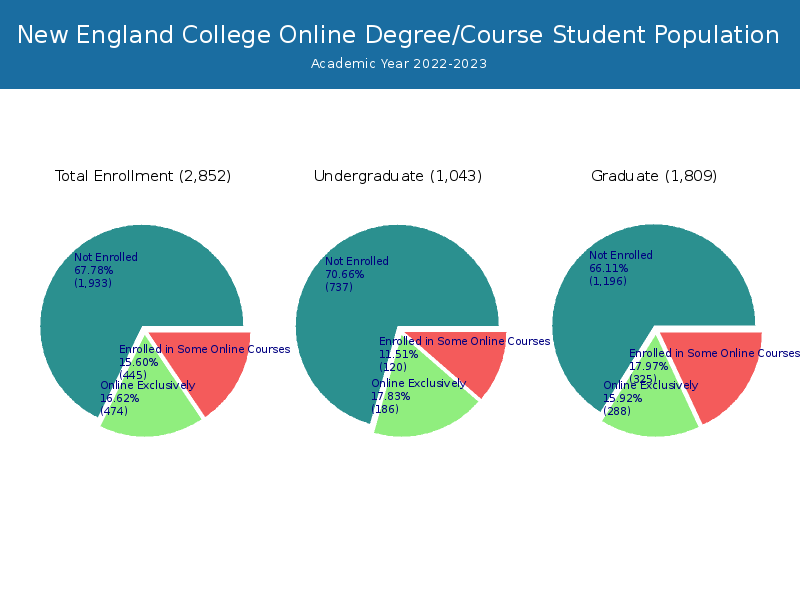
| All Students | Enrolled Exclusively Online Courses | Enrolled in Some Online Courses | |
|---|---|---|---|
| All Students | 2,852 | 474 | 445 |
| Undergraduate | 1,043 | 186 | 120 |
| Graduate | 1,809 | 288 | 325 |
| New Hampshire Residents | Other States in U.S. | Outside of U.S. | |
|---|---|---|---|
| All Students | 120 | 347 | 7 |
| Undergraduate | 15 | 169 | 2 |
| Graduate | 105 | 178 | 5 |
Transfer-in Students (Undergraduate)
Among 1,043 enrolled in undergraduate programs, 70 students have transferred-in from other institutions. The percentage of transfer-in students is 6.71%.67 students have transferred in as full-time status and 3 students transferred in as part-time status.
| Number of Students | |
|---|---|
| Regular Full-time | 939 |
| Transfer-in Full-time | 67 |
| Regular Part-time | 34 |
| Transfer-in Part-time | 3 |