Student Population by Gender
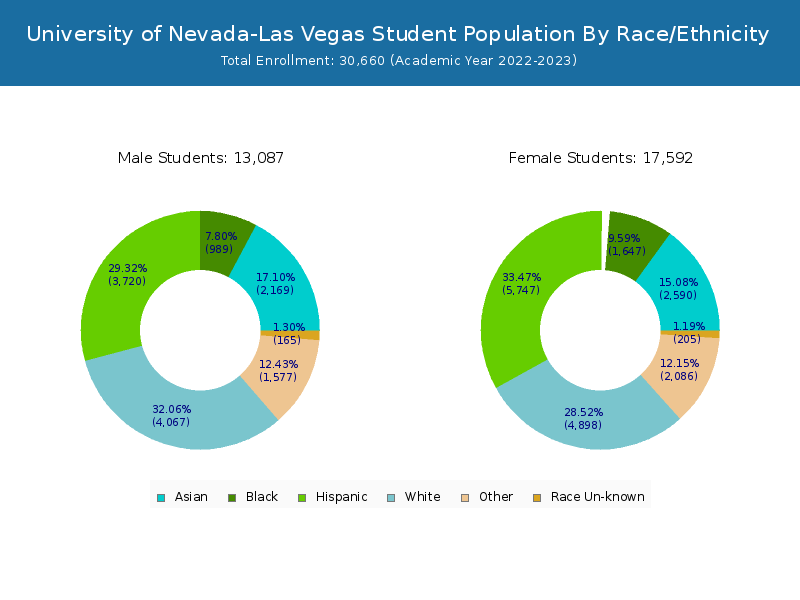
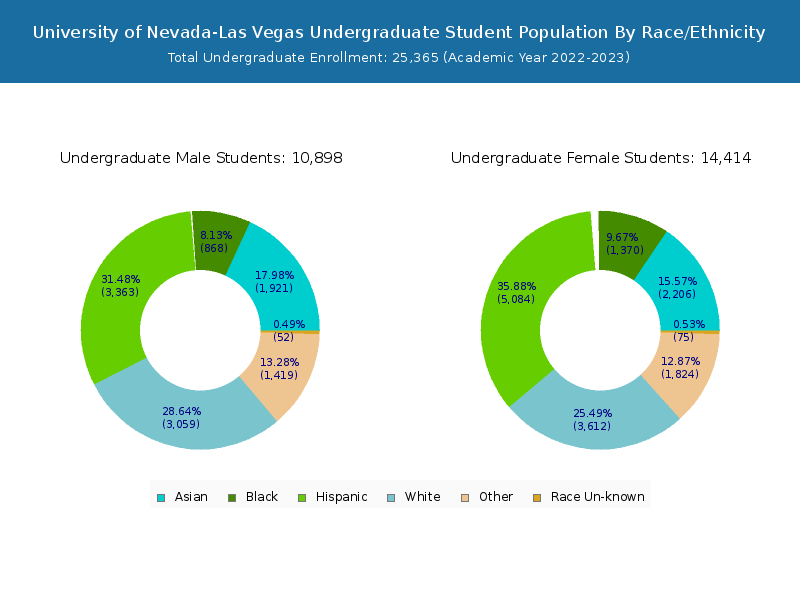
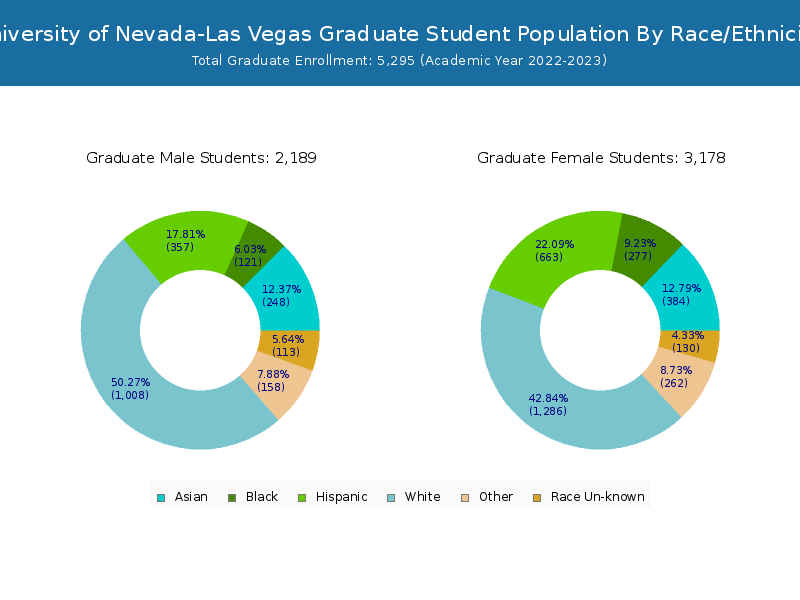
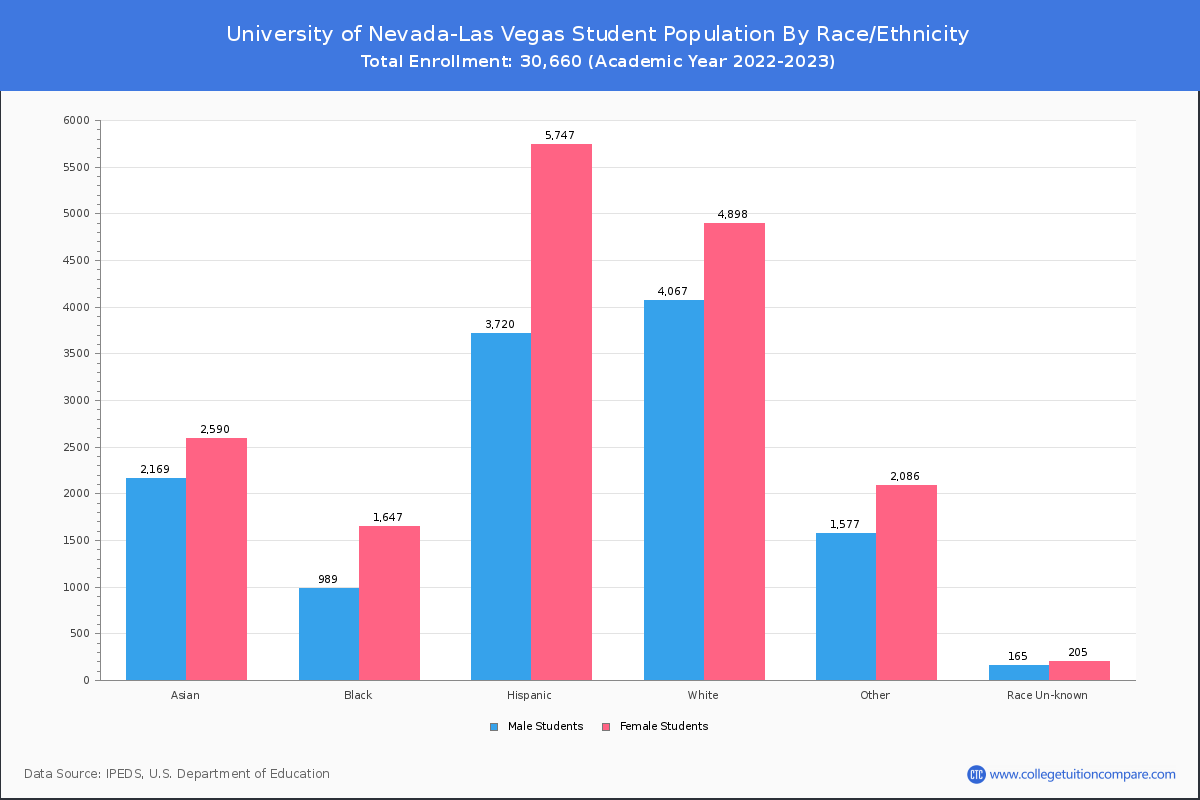
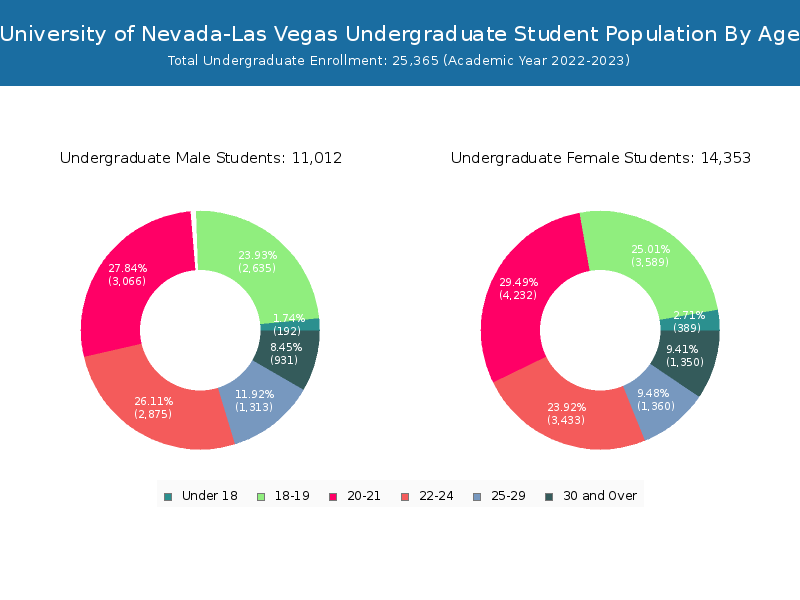
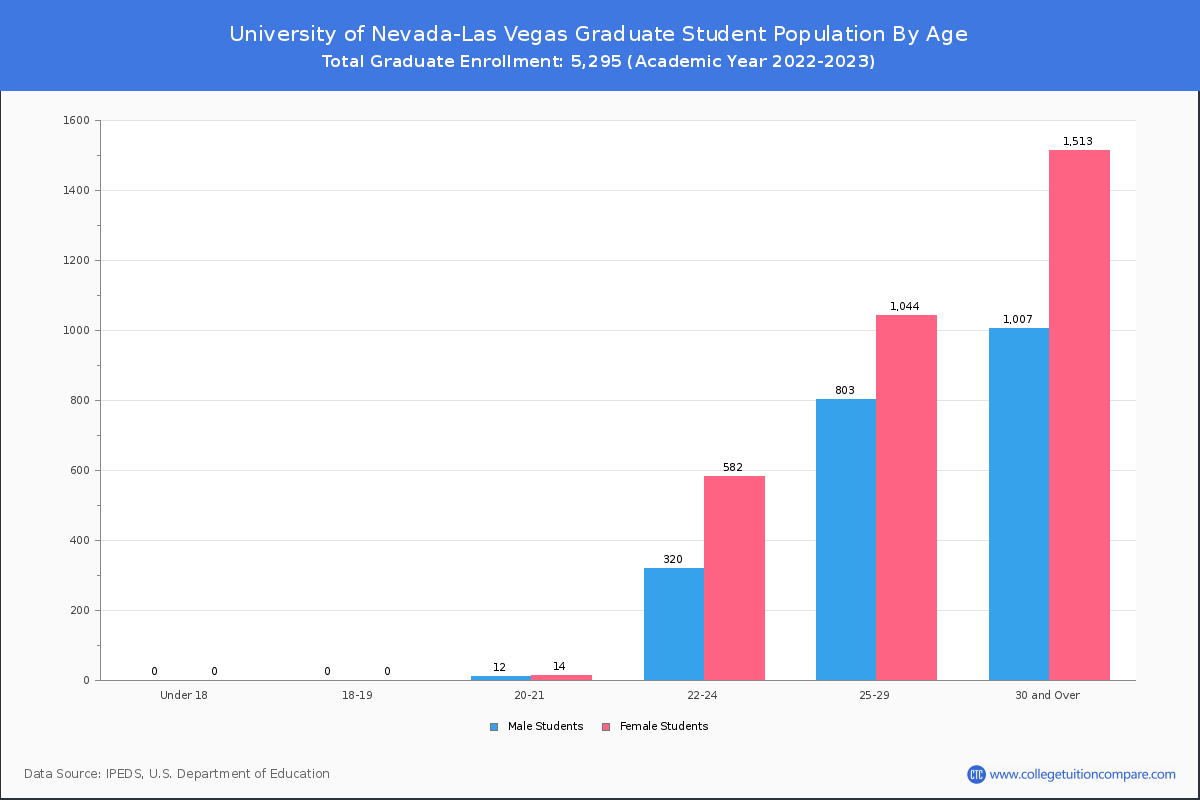
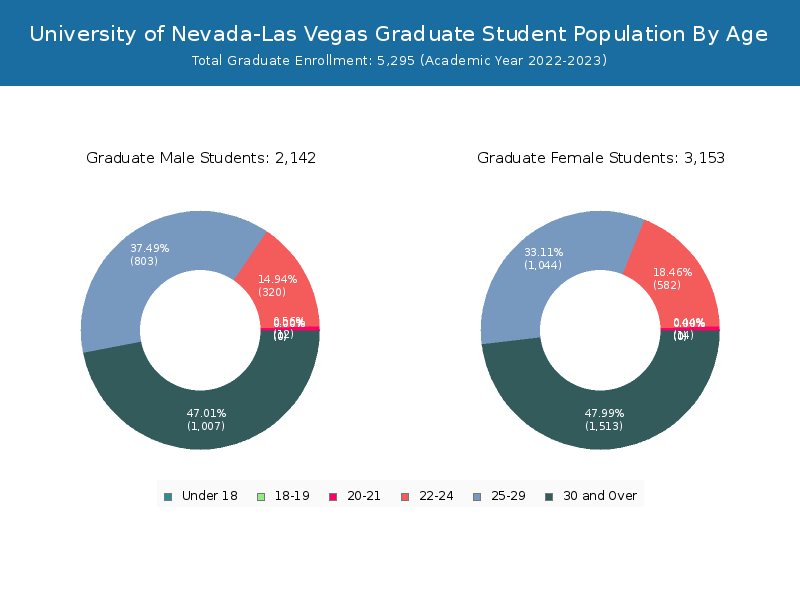
University of Nevada-Las Vegas has a total of 30,660 enrolled students for the academic year 2022-2023. 25,365 students have enrolled in undergraduate programs and 5,295 students joined graduate programs.
By gender, 13,154 male and 17,506 female students (the male-female ratio is 43:57) are attending the school. The gender distribution is based on the 2022-2023 data.
| Total | Undergraduate | Graduate | |
|---|---|---|---|
| Total | 30,660 | 25,365 | 5,295 |
| Men | 13,154 | 11,012 | 2,142 |
| Women | 17,506 | 14,353 | 3,153 |
Student Distribution by Race/Ethnicity
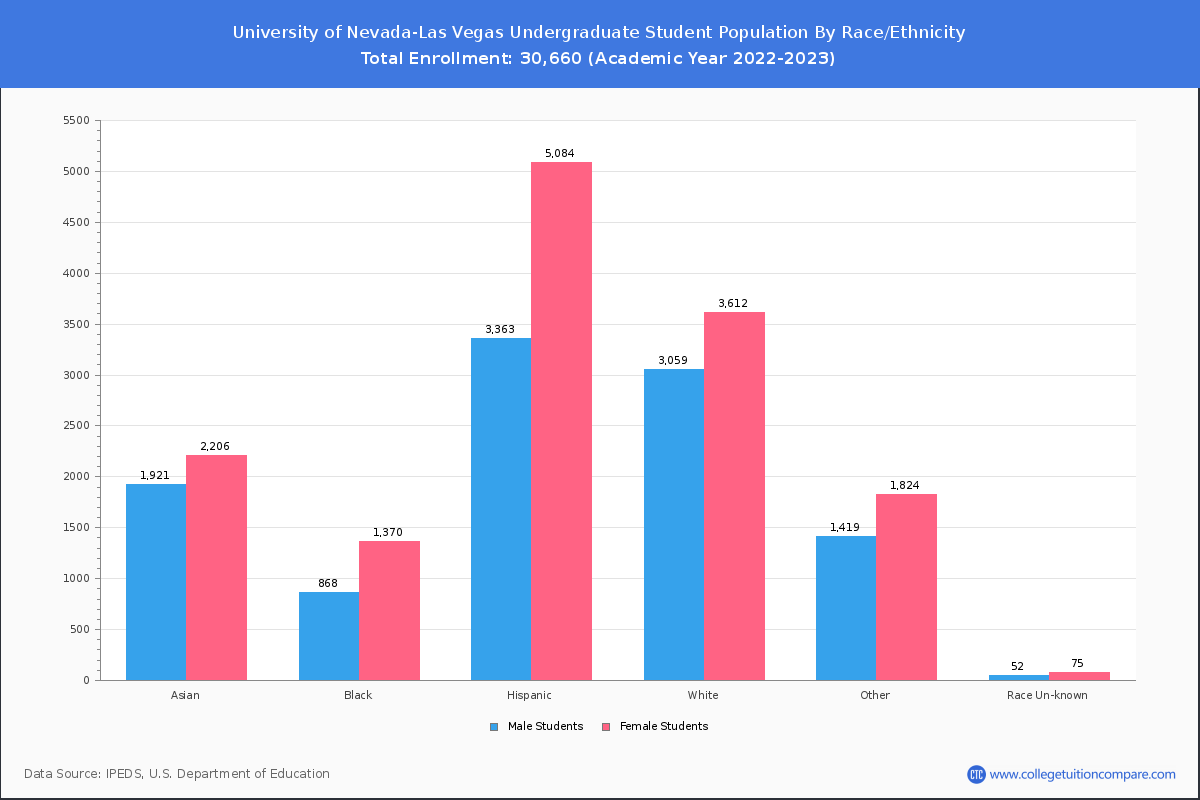
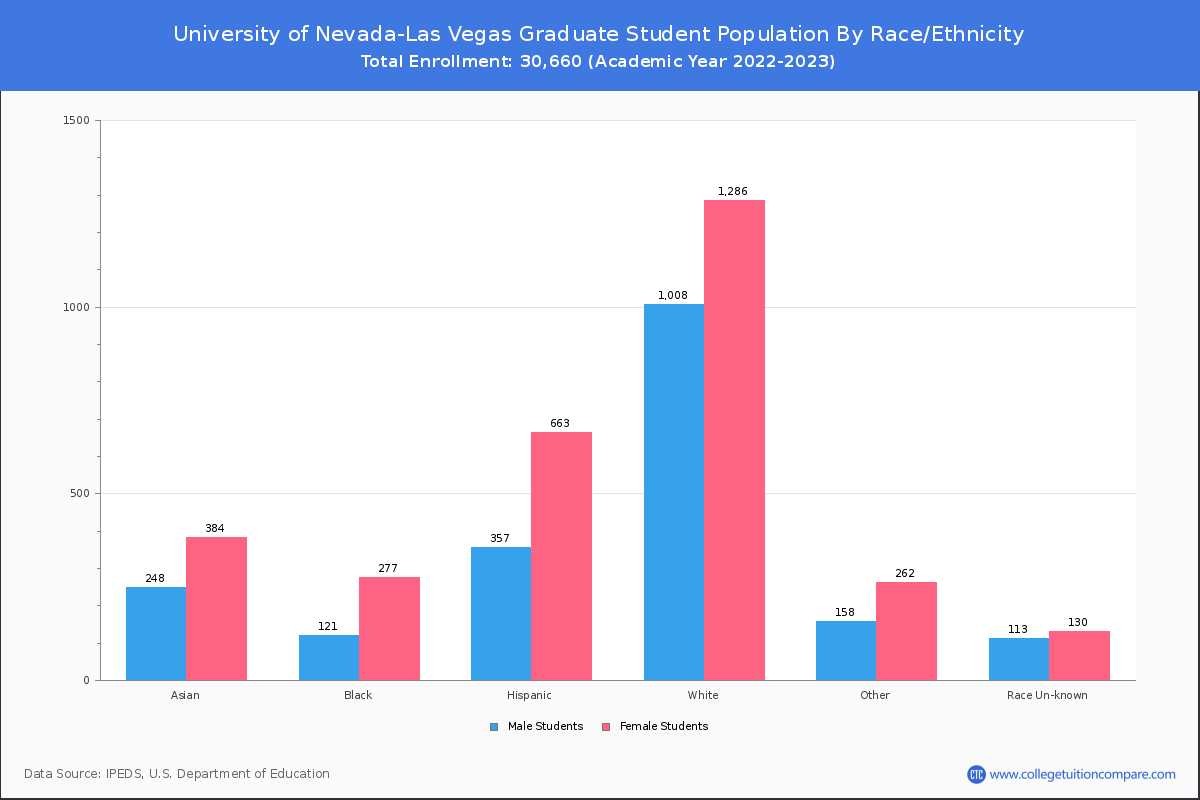
By race/ethnicity, 8,346 White, 2,697 Black, and 4,651 Asian students out of a total of 30,660 are attending at University of Nevada-Las Vegas. Comprehensive enrollment statistic data by race/ethnicity is shown in the next chart (Academic year 2022-2023 data).
| Race | Total | Men | Women |
|---|---|---|---|
| American Indian or Native American | 81 | 28 | 53 |
| Asian | 4,651 | 2,170 | 2,481 |
| Black | 2,697 | 1,046 | 1,651 |
| Hispanic | 9,819 | 3,887 | 5,932 |
| Native Hawaiian or Other Pacific Islanders | 227 | 115 | 112 |
| White | 8,346 | 3,752 | 4,594 |
| Two or more races | 3,683 | 1,596 | 2,087 |
| Race Unknown | 346 | 148 | 198 |
| Race | Total | Men | Women |
|---|---|---|---|
| American Indian or Native American | 68 | 25 | 43 |
| Asian | 3,996 | 1,912 | 2,084 |
| Black | 2,310 | 920 | 1,390 |
| Hispanic | 8,708 | 3,503 | 5,205 |
| Native Hawaiian or Other Pacific Islanders | 210 | 108 | 102 |
| White | 6,187 | 2,820 | 3,367 |
| Two or more races | 3,296 | 1,446 | 1,850 |
| Race Unknown | 149 | 66 | 83 |
| Race | Total | Men | Women |
|---|---|---|---|
| American Indian or Native American | 5 | 2 | 3 |
| Asian | 207 | 95 | 112 |
| Black | 229 | 91 | 138 |
| Hispanic | 662 | 255 | 407 |
| Native Hawaiian or Other Pacific Islanders | 24 | 12 | 12 |
| White | 596 | 269 | 327 |
| Two or more races | 235 | 84 | 151 |
| Race Unknown | 7 | 2 | 5 |
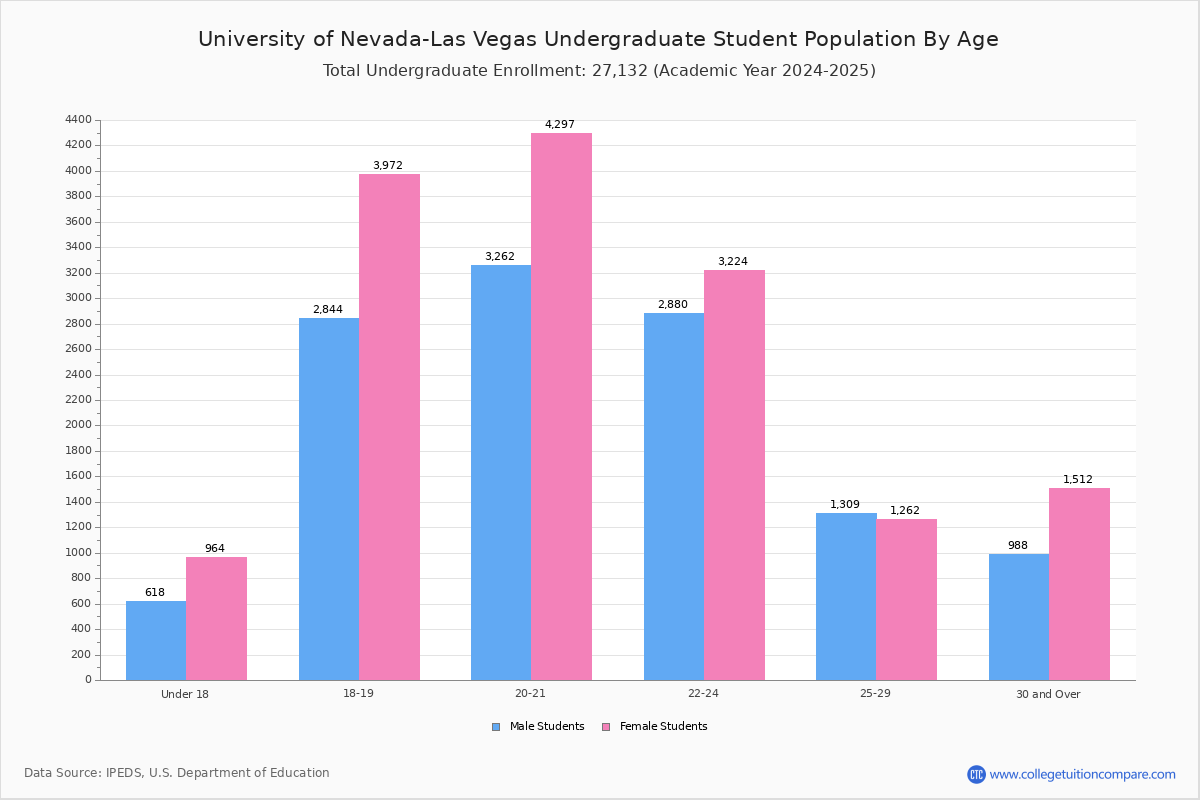
Student Age Distribution
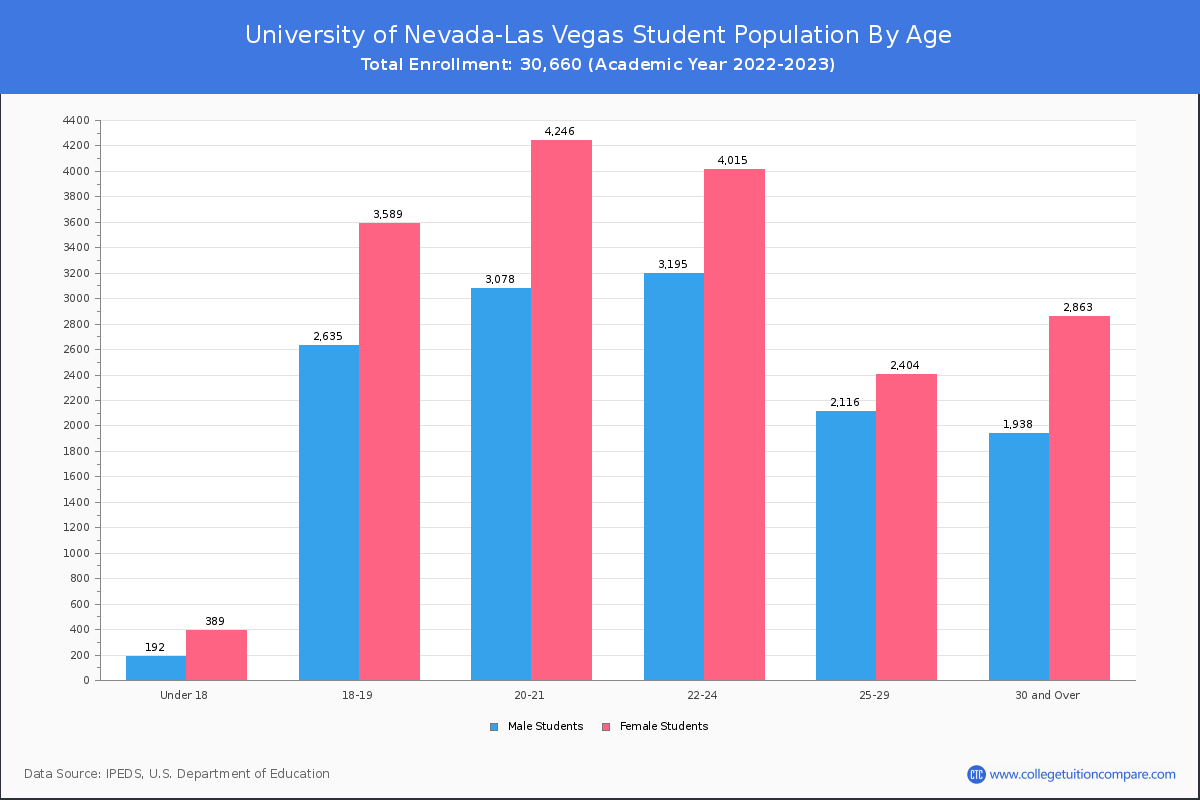
By age, UNLV has 581 students under 18 years old and 60 students over 65 years old. There are 21,339 students under 25 years old, and 9,321 students over 25 years old out of 30,660 total students.
In undergraduate programs, 581 students are younger than 18 and 28 students are older than 65. UNLV has 20,411 undergraduate students aged under 25 and 4,954 students aged 25 and over.
It has 928 graduate students aged under 25 and 4,367 students aged 25 and over.
| Age | Total | Men | Women |
|---|---|---|---|
| Under 18 | 581 | 389 | 192 |
| 18-19 | 6,224 | 3,589 | 2,635 |
| 20-21 | 7,324 | 4,246 | 3,078 |
| 22-24 | 7,210 | 4,015 | 3,195 |
| 25-29 | 4,520 | 2,404 | 2,116 |
| 30-34 | 1,971 | 1,086 | 885 |
| 35-39 | 1,094 | 655 | 439 |
| 40-49 | 1,186 | 762 | 424 |
| 50-64 | 490 | 332 | 158 |
| Over 65 | 60 | 28 | 32 |
| Age | Total | Men | Women |
|---|---|---|---|
| Under 18 | 581 | 389 | 192 |
| 18-19 | 6,224 | 3,589 | 2,635 |
| 20-21 | 7,298 | 4,232 | 3,066 |
| 22-24 | 6,308 | 3,433 | 2,875 |
| 25-29 | 2,673 | 1,360 | 1,313 |
| 30-34 | 1,033 | 574 | 459 |
| 35-39 | 526 | 318 | 208 |
| 40-49 | 510 | 325 | 185 |
| 50-64 | 184 | 120 | 64 |
| Over 65 | 28 | 13 | 15 |
| Age | Total | Men | Women |
|---|
Online Student Enrollment
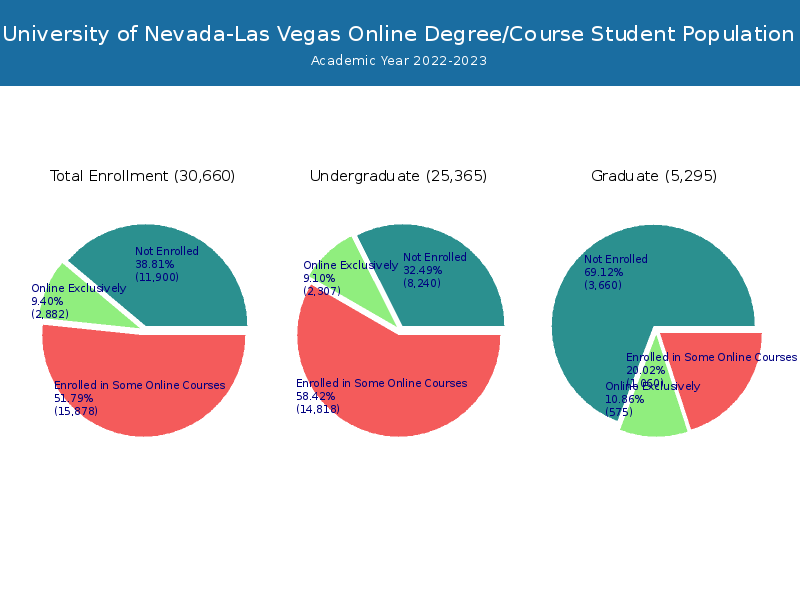
Distance learning, also called online education, is very attractive to students, especially who want to continue education and work in field. At University of Nevada-Las Vegas, 2,882 students are enrolled exclusively in online courses and 15,878 students are enrolled in some online courses.
2,349 students lived in Nevada or jurisdiction in which the school is located are enrolled exclusively in online courses and 533 students live in other State or outside of the United States.
| All Students | Enrolled Exclusively Online Courses | Enrolled in Some Online Courses | |
|---|---|---|---|
| All Students | 30,660 | 2,882 | 15,878 |
| Undergraduate | 25,365 | 2,307 | 14,818 |
| Graduate | 5,295 | 575 | 1,060 |
| Nevada Residents | Other States in U.S. | Outside of U.S. | |
|---|---|---|---|
| All Students | 2,349 | 531 | 2 |
| Undergraduate | 1,926 | 379 | 2 |
| Graduate | 423 | 152 | 0 |
Transfer-in Students (Undergraduate)
Among 25,365 enrolled in undergraduate programs, 2,022 students have transferred-in from other institutions. The percentage of transfer-in students is 7.97%.1,508 students have transferred in as full-time status and 514 students transferred in as part-time status.
| Number of Students | |
|---|---|
| Regular Full-time | 18,079 |
| Transfer-in Full-time | 1,508 |
| Regular Part-time | 5,264 |
| Transfer-in Part-time | 514 |